Two-step seasonal adjustment
The economic problem
Combining data with different seasonal patterns
One of the most important measures of economic activity is employment. With its Current Employment Statistics (CES) program, the Bureau of Labor Statistics (BLS) produces monthly estimates of nonfarm payroll employment.[1] To generate a series that provides timely estimates of current payroll employment while incorporating the most reliable historical figures, the CES series links two sources of data.
The most recent employment estimates, referred to as the nonbenchmarked data, rely directly on the CES survey.[2] This survey samples about one-third of the nation’s businesses monthly and provides timely information on recent payroll employment. In contrast, historical payroll employment numbers, referred to as benchmarked data, offer revisions to the real-time estimates using more comprehensive, administrative data.[3]
Employment data often exhibit seasonal patterns, such as extra hiring at Christmas. One complication of combining the two payroll employment series is that the benchmarked and nonbenchmarked portions exhibit distinct seasonal patterns. For example, both the benchmarked and nonbenchmarked data show a decline in employment from December to January as businesses lay off temporary holiday workers, but the benchmarked data decline more steeply than the nonbenchmarked data during this period (Chart 1). This difference has important implications for seasonal adjustment.
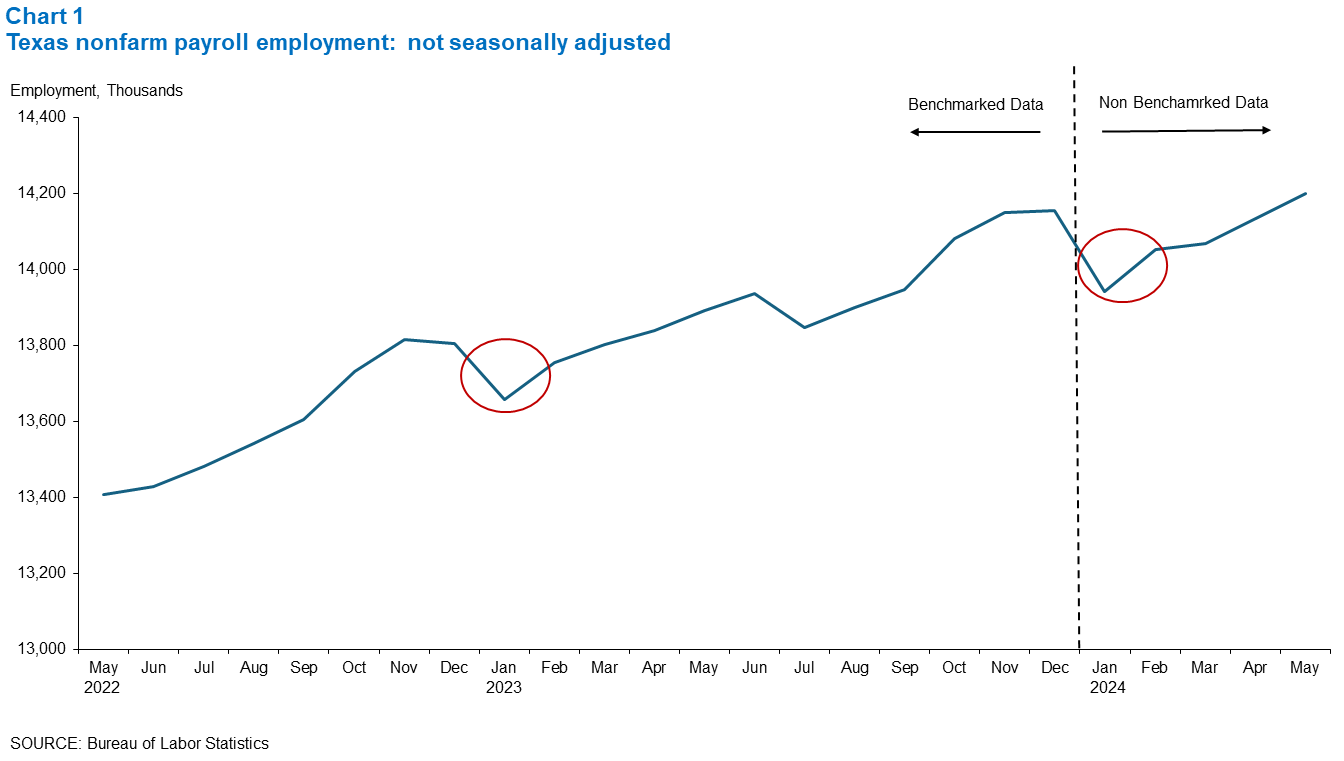
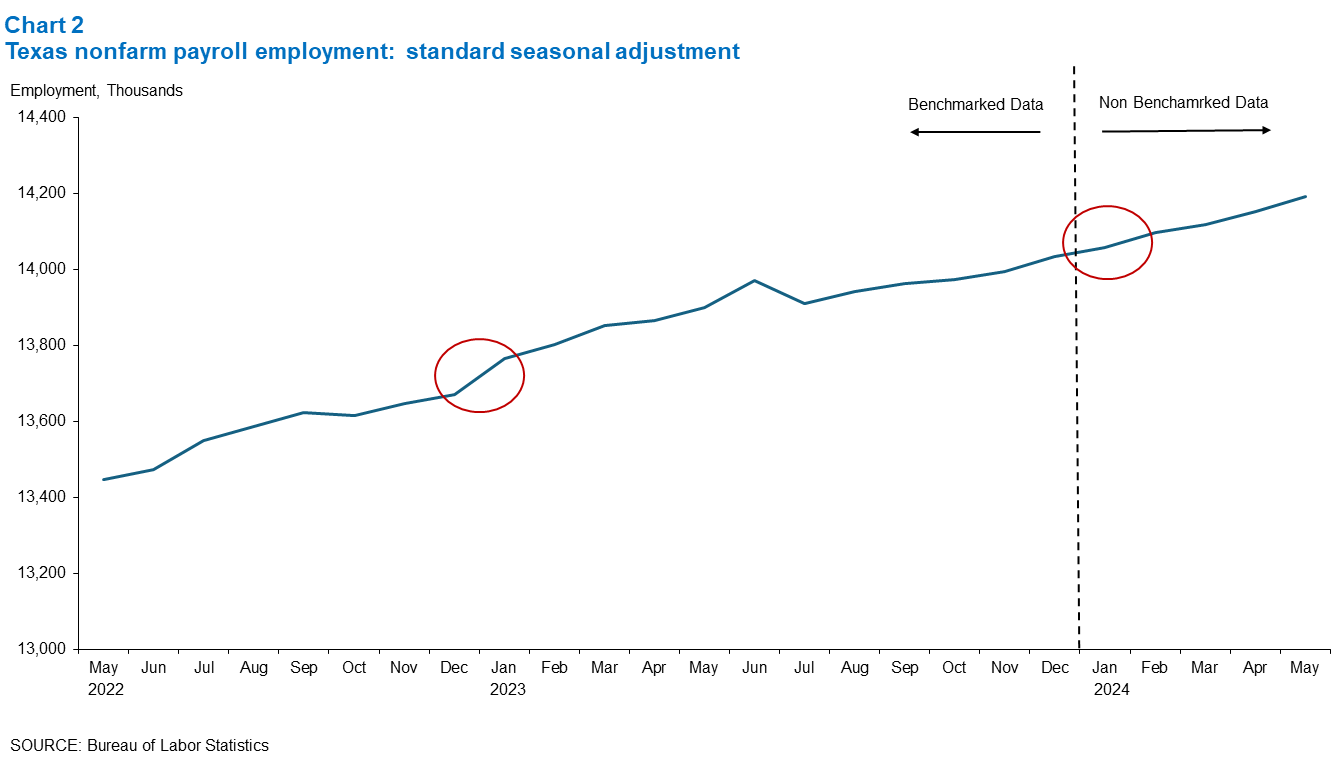
When one combines these data and performs a standard seasonal adjustment, the seasonally adjusted data suggest that nonbenchmarked employment increases significantly from December to January. In Chart 1, the seasonally-adjusted change in employment from December to January in the years covered by the benchmarked data appears flat. But for the year in which the employment numbers rely on the nonbenchmarked CES survey data, it appears that employment increases steeply between these months.
The technical solution
Seasonally adjust each data source separately
As explained in "Seasonally Adjusting Data," the X12 seasonal adjustment procedure estimates the changes that occur every year in the same magnitude and direction and then removes these recurring seasonal components from the series to reveal the trend and remaining variation.
Importantly, the magnitude of the seasonal changes differs across the benchmarked and nonbenchmarked data that make up the BLS payroll employment series. The benchmarked data exhibit a larger decline in employment from December to January than the nonbenchmarked data, so when the X12 procedure is applied to the combined data, it overestimates the negative seasonal factor for the December–January period covered by the nonbenchmarked data. As a result, when the data are adjusted to remove these estimated seasonal components, it appears that employment jumped up during this period.
Dallas Fed economists recognized that this December–January jump emerged regularly within the nonbenchmarked part of the data but not in the benchmarked part.[4] The Dallas Fed therefore developed an alternative seasonal adjustment procedure, known as the Berger–Phillips two-step method.
With the Berger–Phillips two-step method, the X12 procedure is applied separately to the benchmarked and nonbenchmarked CES survey data. Then, the two types of data are combined to create the complete employment series.
Real-world example
Two-step seasonal adjustment more accurately adjusts payroll employment data
Chart 2 plots the two-step seasonally adjusted Texas employment data from May 2024 to May 2026. Notice how the increase in employment from December 2025 to January 2026 is less pronounced. Two-step seasonal adjustment therefore allows analysts to more accurately assess the change in employment from one month to the next.
Summary
Seasonally adjusting data that have been constructed from multiple sources may create problems if the different data sources exhibit distinct seasonal patterns. Most notably, this arises when researchers combine employment data to create a continuous monthly series. A more accurate view of the trends in the series emerges by seasonally adjusting the data separately.
Notes
- The BLS also releases employment estimates from a household survey, known as the Current Population Survey (CPS). However, the Dallas Fed’s two-step seasonal adjustment procedure is only used on the CES payroll employment series. For more information about the differences between the CPS and the CES, see bls.gov/web/empsit/ces_cps_trends.htm.
- This survey is also referred to as the Establishment Survey or the payroll survey.
- For more information on the CES survey and the revisions that generate the benchmarked data, see bls.gov/bls/empsitquickguide.htm and bls.gov/web/empsit/cesbmart.htm. See Early Benchmarking article in DataBasics for details on how the Dallas Fed’s early benchmarking procedure differs from the BLS methodology.
- See “Solving the Mystery of the Disappearing January Blip in Employment Data,” by Franklin D. Berger and Keith R. Phillips, Federal Reserve Bank of Dallas Economic Review, Second Quarter 1994.