Growth rates versus levels
The economic problem
Level or growth rate? Researchers use both
Researchers study many indicators when following the economy. In economic research, it is important to look at both the level and the growth rates of these variables. The decision whether to use one or the other in economic analysis depends on the question a researcher wants to answer.
Use levels to compare things that are similar in size
A level refers to the value of a certain indicator at a given point in time. In most cases, analysts use levels to compare similar entities. For instance, economists often compare the current level of output, or gross domestic product (GDP), of different countries. As another example, a researcher might want to compare the level of per capita personal income in neighboring states like Louisiana and Texas. Such comparisons help answer questions about the relative economic health of a country or state.
Researchers also examine level changes. A level change is the difference in the level amount from one period to the next. For example, analysts are interested in the level change when the job count is released each month. Rather than reporting the overall job level, the Bureau of Labor Statistics often reports the number of jobs lost or gained over the month for the labor market overall and for each industry. Looking at changes in the job level (the level change) allows researchers to answer questions such as, How many jobs were added to the economy this month? or Which industries contributed the most to the overall job gain and which sectors lost jobs?
Use growth rates to compare things that are not similar in size
A growth rate is used when an economist wants to know how fast an indicator has risen (or declined) over a certain period. This rate can be used as a measure of comparison with other time periods, answering questions such as, Has job growth in Texas picked up in 2023, compared with 2022?
Additionally, growth rates allow for better comparison across regions. For example, because of Texas' large population, the state's employment level is one of the highest in the nation. But this fact makes it difficult to compare the number of jobs gained in Texas with the number of jobs gained in smaller states. Such states will have smaller monthly job gains, but employment could be rising at a faster pace than in Texas. In a sense, calculating growth rates levels the playing field between the states. Similarly, economists often compare a state's economy with that of the nation. By calculating growth rates, researchers can make comparisons between the national and regional economies—such as whether state employment is growing faster or slower than the national average.
The technical solution
The formula for calculating a growth rate is:
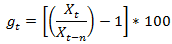
where gt is the growth rate in period t, X is the variable being examined and n is the time period of interest (see "Annualizing Data").
Real-world example
Employment levels fall in Texas and the U.S. in 2020
Let us now look at an example using levels, level changes and growth rates. Table 1 contains year-end employment levels for Texas and the United States for the years 2019 through 2023 and the level change for each year.
| Table 1 Year-end employment levels for Texas and the United States |
||||
| Date | Texas employment (in thousands) |
Change in Texas employment (in thousands) |
U.S. employment (in thousands) |
Change in U.S. employment (in thousands) |
| 2019 | 12,919.5 | 151,792 | ||
| 2020 | 12,349.9 | -569.6 | 142,518 | -9,274 |
| 2021 | 13,108.8 | 758.9 | 149,763 | 7,245 |
| 2022 | 13,685.2 | 576.3 | 154,291 | 4,528 |
| 2023 | 14046.2 | 360.0 | 157,304 | 3,013 |
Table 1 shows that the total number of jobs decreased in Texas and the United States in 2020, as both economies suffered from the initial wave of the pandemic. However, employment in Texas and the U.S. began to increase in 2021, and it continued this trend through 2023. This is the extent of the information that can be garnered from examining employment levels. Because U.S. employment is so much larger than that of Texas, limited information can be gained in trying to compare the changes in employment between the two entities. By calculating growth rates, however, we can compare Texas and the United States better.
Growth rates add information to the employment story
| Table 2 Rate of employment change for Texas and the United States |
||||
| Date | Texas employment (in thousands) |
Rate of Change in Texas Employment |
U.S. employment (in thousands) |
Rate of Change in U.S. Employment |
| 2019 | 12,919.5 | 151,792.0 | ||
| 2020 | 12,349.9 | -4.4 | 142,518.0 | -6.1 |
| 2021 | 13,108.8 | 6.1 | 149,763.0 | 5.1 |
| 2022 | 13,685.2 | 4.4 | 154,291.0 | 3.0 |
| 2023 | 14,046.1 | 2.6 | 157,304.0 | 2.0 |
The growth rates are calculated using the formula above where t is equal to the current year and t–1 is equal to the previous year. As an example, the 4.4 percent decline in the first column of Table 2 is calculated using the levels in Table 1 as follows:

The rates of change in Table 2 suggest that Texas fared better than the United States from 2019 through 2023. Table 2 indicates that both the United States and Texas saw declines in employment in 2019, but Texas employment declined at a slightly lower rate, as it lost 4.4 percent of jobs while the U.S. lost 6.1 percent. In 2021, Texas employment increased at a faster rate than U.S. employment, and employment increases in Texas continued to outpace increases in the U.S. through 2023.
Summary
The example above helps illustrate how economists use growth rates and levels. While levels provide good information, they are most useful when comparing things similar in size. Growth rates allow comparison of different sized entities, such as the nation and Texas. In addition, growth rates can easily be used to compare indicators over different time periods.
Glossary at a glance
- Growth rate:
- A percentage change calculation that tells how fast an economic variable is rising or falling over a certain time period.
- Level:
- The value of a certain variable at a given point in time.