
How much do movers move average wage growth?
Data from the Current Population Survey, a household survey used to compute the unemployment rate, do not include individuals who change residences. If it could include movers, our previous estimate of 2018 average individual wage growth would increase from 5.0 percent to 5.5 percent or higher.
This 5.5 percent wage growth implies that, on average, U.S. workers currently are receiving substantial real wage gains—possibly double what has been reported.
In a previous article, we suggested that it is better to view the linkage between labor market conditions and wage growth through the lens of average individual wage growth derived from the Census Bureau-produced Current Population Survey (CPS). An alternative measure—average hourly earnings (AHE) based on the Bureau of Labor Statistics (BLS) survey of establishments—consistently underestimates average individual wage growth.
As a survey of residences, CPS data can establish 12-month wage growth for an individual only if that person does not move. We argue that this omission lowers average individual wage growth calculations drawn from CPS data. Measuring individual wage growth for people changing addresses would necessitate a panel survey that follows individuals regardless of where they live. For this purpose, the Survey of Income and Program Participation (SIPP) from the Census Bureau fits the bill.
Using SIPP panel data to estimate wage growth
SIPP is a monthly survey of roughly 100,000 individuals who are followed for up to four years. Data from SIPP, as from CPS, allows a computation of 12-month wage growth for individuals. It also offers identification of mover status. SIPP respondents report their hourly wage if they are paid hourly and their monthly wage and usual weekly hours if they are salaried. For salaried workers, wages are estimated by dividing usual monthly earnings by 4.3 times their usual weekly hours.
Unfortunately, the most recently published SIPP data end in early 2014. However, SIPP data are still useful in understanding the impact of movers on measured wage growth in the CPS data.
An important consideration is that individuals who move are also more likely to change employers. In particular, movers in the SIPP data are twice as likely to change employers as nonmovers.
Average individual wage growth in the SIPP data, separated into job changers and non-job changers, shows that during economic expansions, job changers consistently have higher average wage growth than individuals remaining with their employer (Chart 1). During recessions and recoveries, however, job changers experience similar or lower average wage growth.
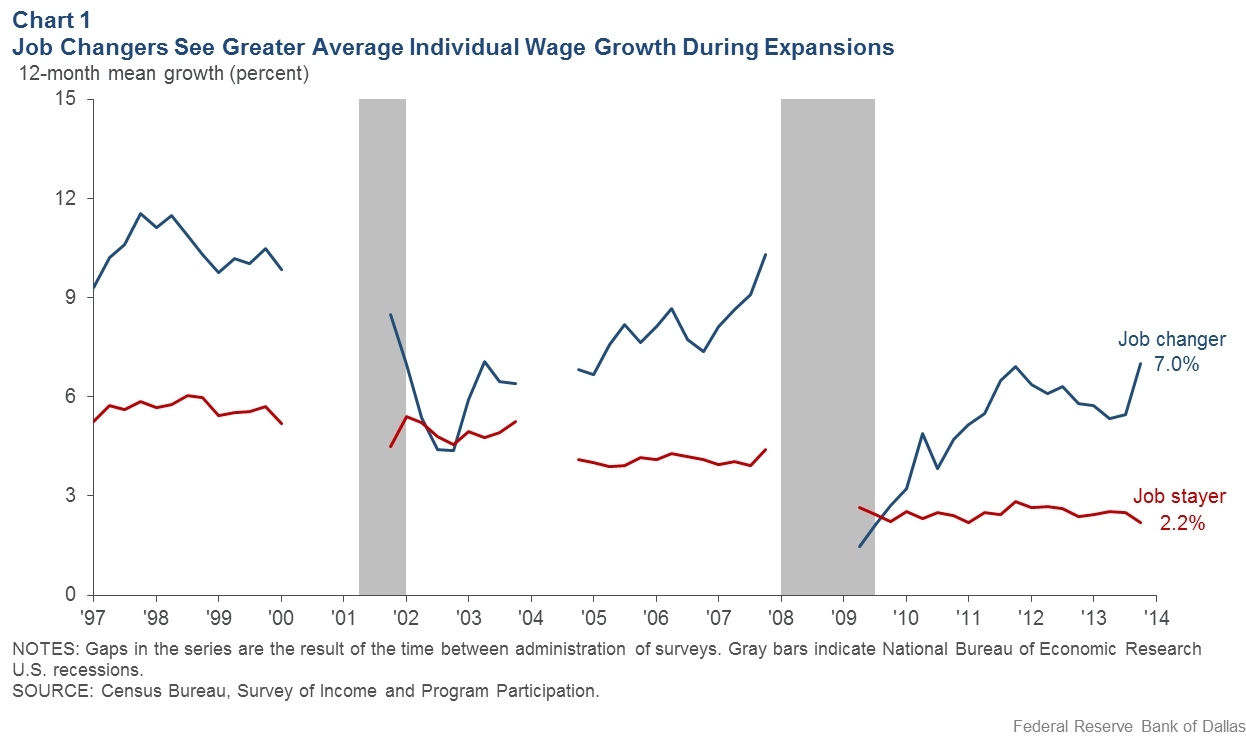
Business cycle affects nature of job changing
This wage pattern for job changers reflects the differential nature of employment over the business cycle. During an expansion, job changers include many individuals who quit and choose to change employers, whereas during recessionary and recovery periods, job changers include many individuals who lose their jobs and are required to change employers.
As an expansion continues and the unemployment rate declines, job changers obtain increasingly better wage growth compared with their non-job-changer counterparts. Before the last recession, this gap was 4 percentage points, and in early 2014, it was 5 percentage points.
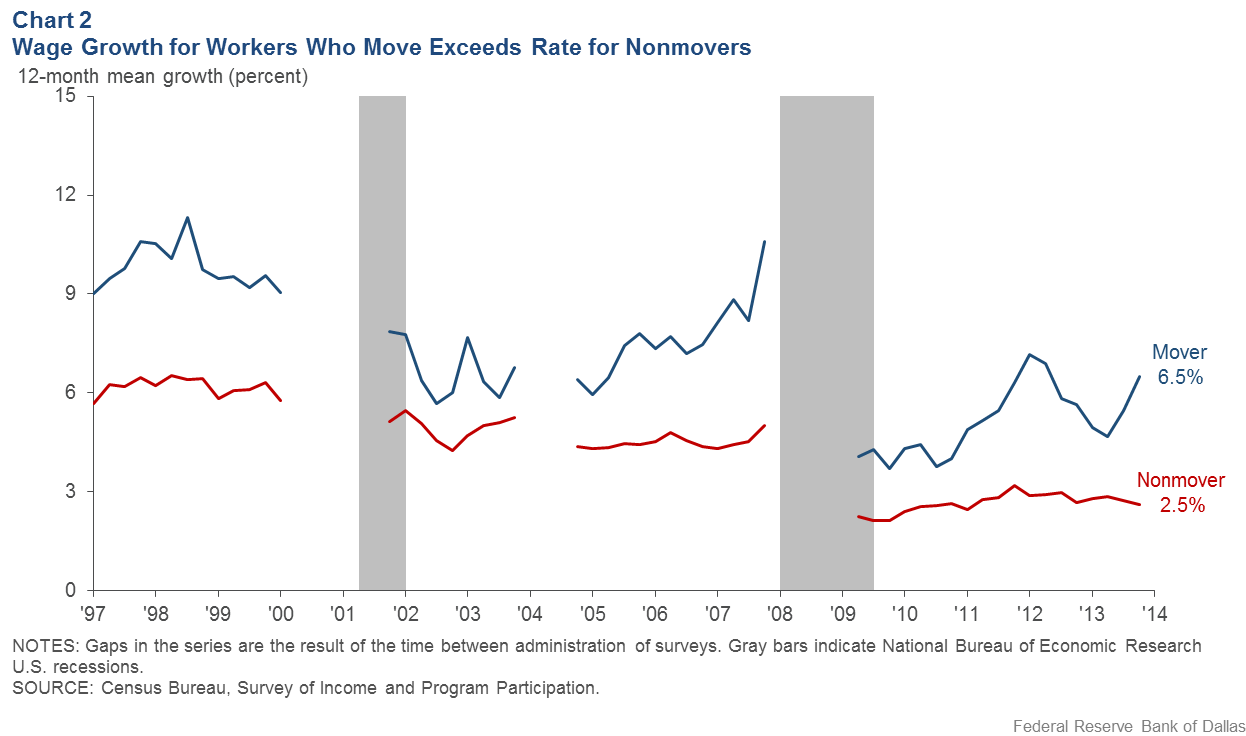
Given the significant gap between the average individual wage growth of job changers versus job stayers and the higher prevalence of job changers among those who move, it is not surprising that wage growth for movers exceeds that for nonmovers (Chart 2). The average difference is smaller than the previous difference observed for changing employers because not all movers change employers and not all nonmovers remain with their employer. In early 2014, movers’ wage growth was 4 percentage points higher than that for nonmovers.
Reduced mobility rate indicates workforce changes
The overall impact of excluding movers from the calculation of average individual wage growth also depends on how frequently individuals move. Chart 3 shows the fraction of individuals who move over a 12-month period.
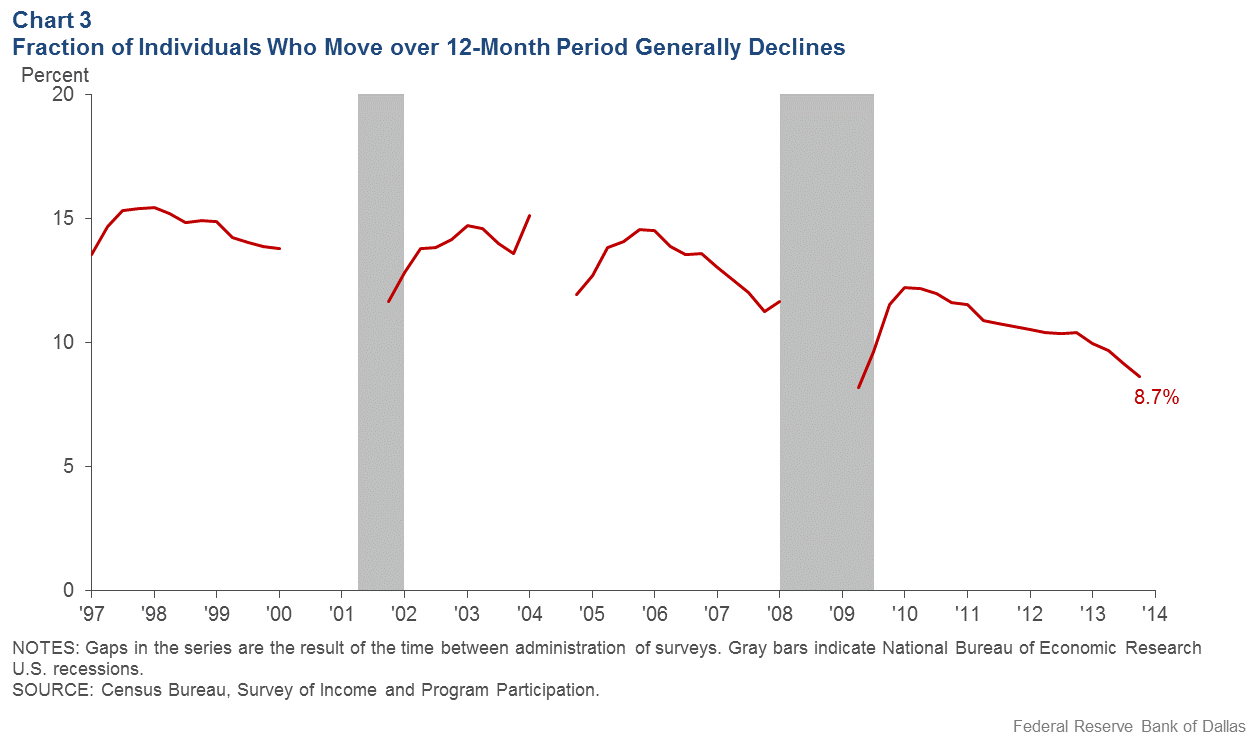
In the late 1990s, the mobility rate was around 15 percent. The likelihood of moving declines following recessions and tends to rebound rapidly as the economy recovers. However, there has been a pronounced downward trend in mobility over the past 20 years, and by early 2014, the mobility rate had slowed to just below 9 percent.
Some of the decline reflects aging; older households are less likely to move. However, economic incentives to move may also be diminishing because geographic wage differentials have narrowed over time. An implication of the decline in mobility is that the impact of excluding movers from the calculation of average individual wage growth may be waning.
Wage growth rises after accounting for worker movement
We now turn to answering the question posed in this article’s title—“How Much Do Movers Move Average Wage Growth?” Chart 4 shows average individual wage growth for all workers and for workers, excluding movers.
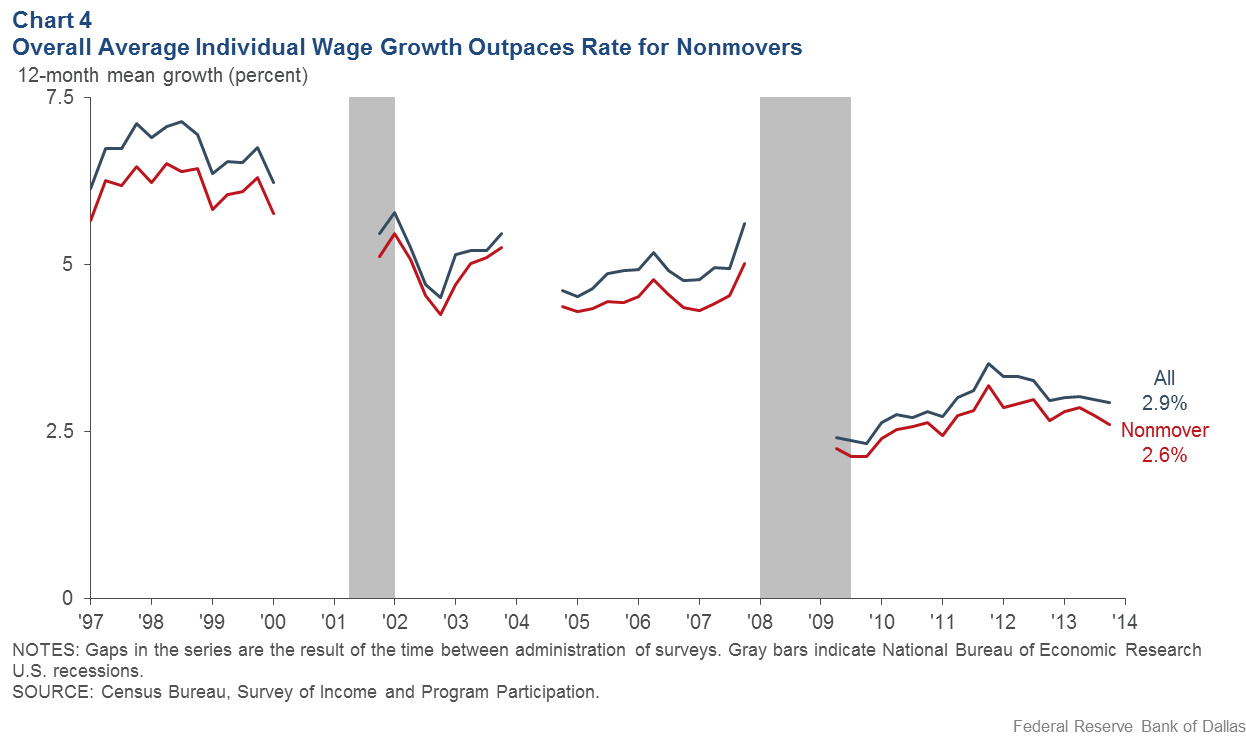
Average individual wage growth for all workers is consistently higher than average individual wage growth for nonmovers. The gap between the two measures of average wage growth was around 0.3 percentage points just before the Great Recession. The gap was similar in early 2014. Given that the labor market has tightened since then, additional statistical analysis (not shown here) indicates that the current gap has likely widened to 0.5 percentage points.
The results using SIPP data make clear that the exclusion of movers in the CPS data leads to underestimation of the average individual wage growth rate.
Our previous analysis of CPS data suggests that a smoothed 12-month wage growth for workers who do not change residences was 5.0 percent at year-end 2018 instead of the corresponding 2.9 percent for AHE growth. Adding the wage growth of movers would likely raise CPS average individual wage growth to 5.5 percent or higher.
Taken together, wage growth is faster than we think not only based on the BLS’ calculation of AHE, but also when measured with CPS data.
About the Authors

Michael Morris
Morris is a research assistant in the Research Department at the Federal Reserve Bank of Dallas.

Robert Rich
Rich is a senior economic and policy advisor in the Research Department at the Federal Reserve Bank of Cleveland.

Joseph Tracy
Tracy is executive vice president and senior advisor in the Research Department at the Federal Reserve Bank of Dallas.
The views expressed are those of the authors and should not be attributed to the Federal Reserve Bank of Dallas, the Federal Reserve Bank of Cleveland or the Federal Reserve System.