
Three macroeconomic factors to watch in equity markets
Machine learning has helped make music playlist recommendations, facilitated self-driving cars and even interpreted patients’ medical test results. Not surprisingly, it also can detect macroeconomic factors underlying U.S. corporate equity returns.
Principal component analysis (PCA) is one of the primary tools in machine learning used to extract key patterns in large datasets. The tool finds the major distinct directions of variation—called components or factors—in a dataset and can be a great way to ascertain its general characteristics.
This method is particularly apparent in image compression. When you load a webpage and the images appear in steps of ever-increasing detail, it is normally because of PCA—the data are being sent one component at a time. When all of the components arrive, the image is perfectly reconstituted. Sending only a handful of the pieces may provide enough of the variation across the image’s pixels to make it recognizable; thus, to save data, a website may choose to send only a subset of the image’s components.
Our recent research applies PCA to the daily equity returns of 524 U.S. firms from 1990 to 2017 to understand the broad drivers at play, without including additional information beyond the co-movement of these equities’ returns. The analysis identifies three significant tendencies—or factors—that together explain just under 30 percent of the changes in the firms’ returns.
These three factors mirror the behavior of (in order of importance) economic growth, inflation and commodity prices. The factors may be viewed like the web image loading, each successively adding greater detail about the firms’ returns.
Factor 1: Economic growth
The first factor extracted from the equity returns relates to economic growth in the aggregate U.S. economy, with booms and busts corresponding to higher and lower average equity returns. This common variation is typically associated with Eugene F. Fama and Kenneth R. French’s work on portfolio theory and the role of risk in the broad stock market.
Specifically, the market risk factor—the overall market’s influence on an individual stock price and whether the share price is more or less volatile than the overall market—is known as its market beta. A beta equal to 1 indicates a stock is as volatile as the broad stock market, below 1 indicates less volatility than the market, and greater than 1 suggests more volatility than the market.
Chart 1 shows annual changes in the first factor (blue line) relative to year-over-year industrial production growth (red line). Similar to the findings of Fama and French, risky stock assets rely on economic expansion to generate strong returns, and compress when the global economy is weak.
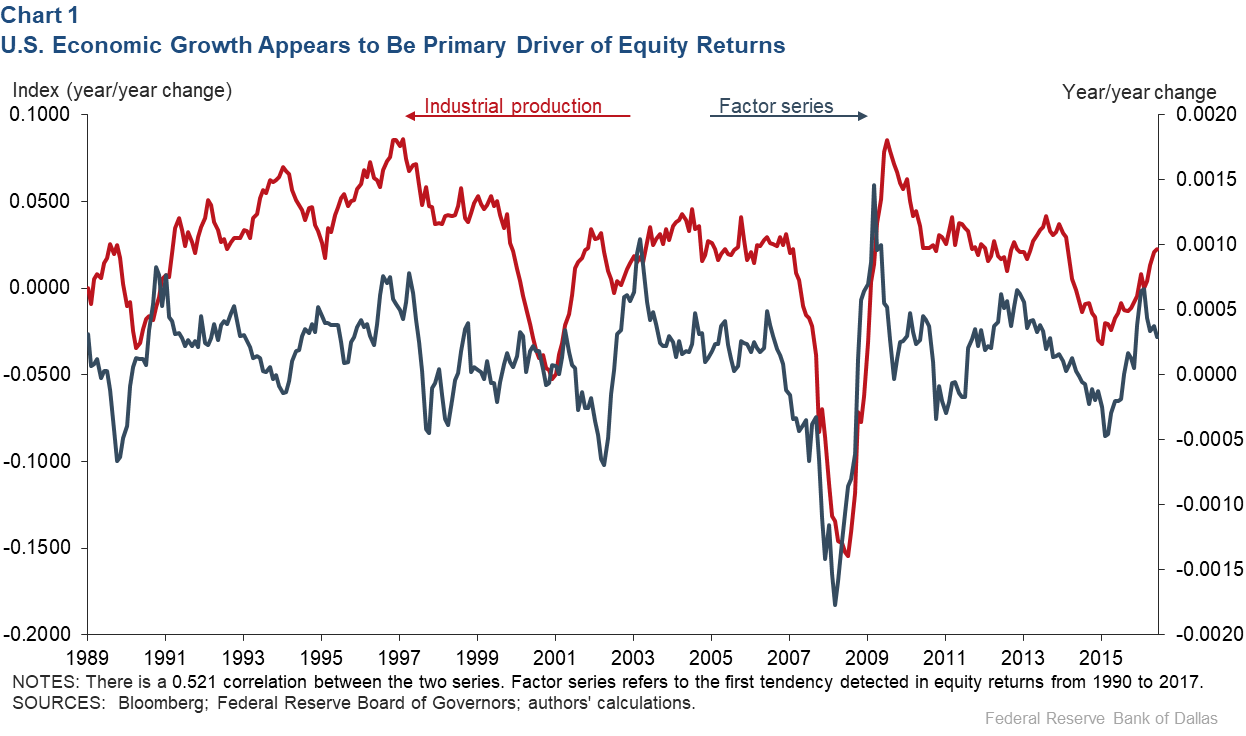
The firms most heavily influenced by the first factor are predominantly from the technology, consumer cyclical and financial sectors. Those with the lowest weights are royalty trusts, consumer noncyclicals and utility firms. This finding makes intuitive sense, as the former are procyclical sectors, while the latter are generally considered passive, dividend generating, acyclical investment sectors.
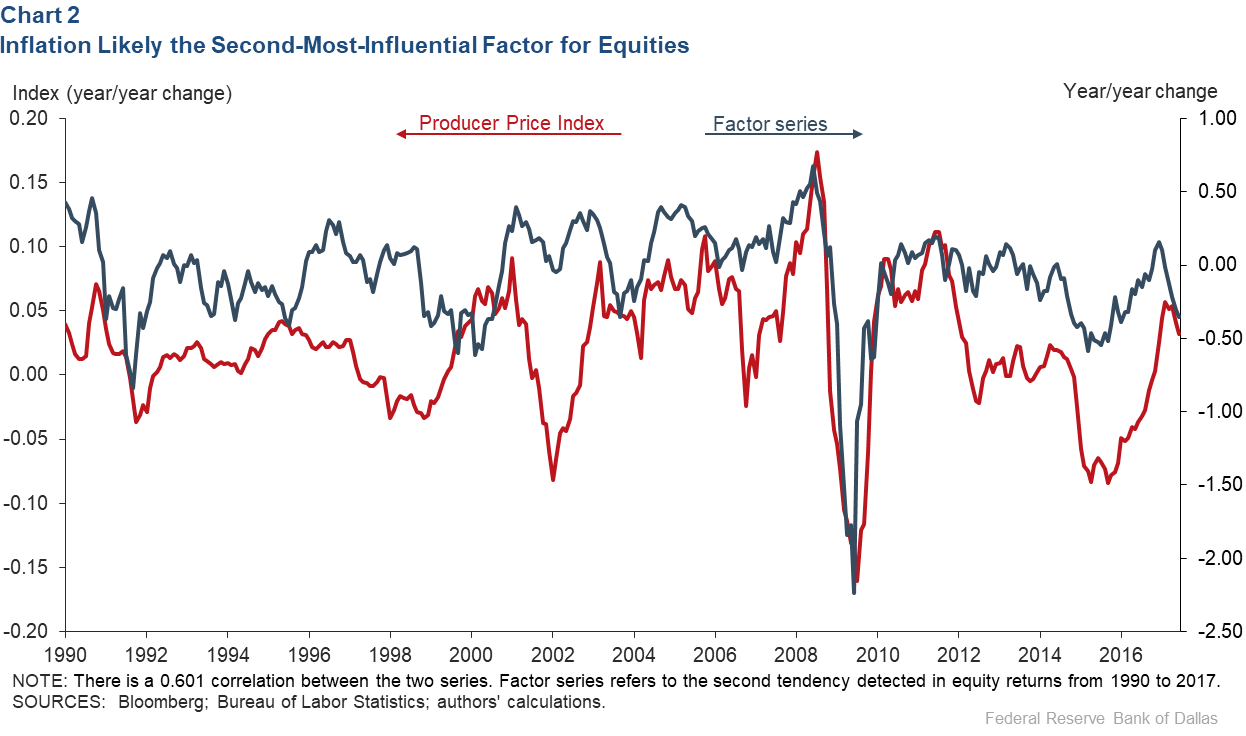
Factor 2: Inflation
The second factor extracted from equity returns is highly correlated with different inflation measures, such as the Producer Price Index (PPI), the Consumer Price Index and breakeven inflation (expected future inflation calculated based on the yield of Treasury Index-Protected Securities). The factor is also positively related to the price level as measured by the value of the dollar against other currencies.
Chart 2 compares year-over-year changes in the second equity return factor (blue line) with PPI inflation (red line). Increases in producer prices are positively correlated with equity prices for firms in the energy, financial, basic materials and utilities sectors. However, technology stocks tend to decline with higher PPI inflation.
Factor 3: Commodities
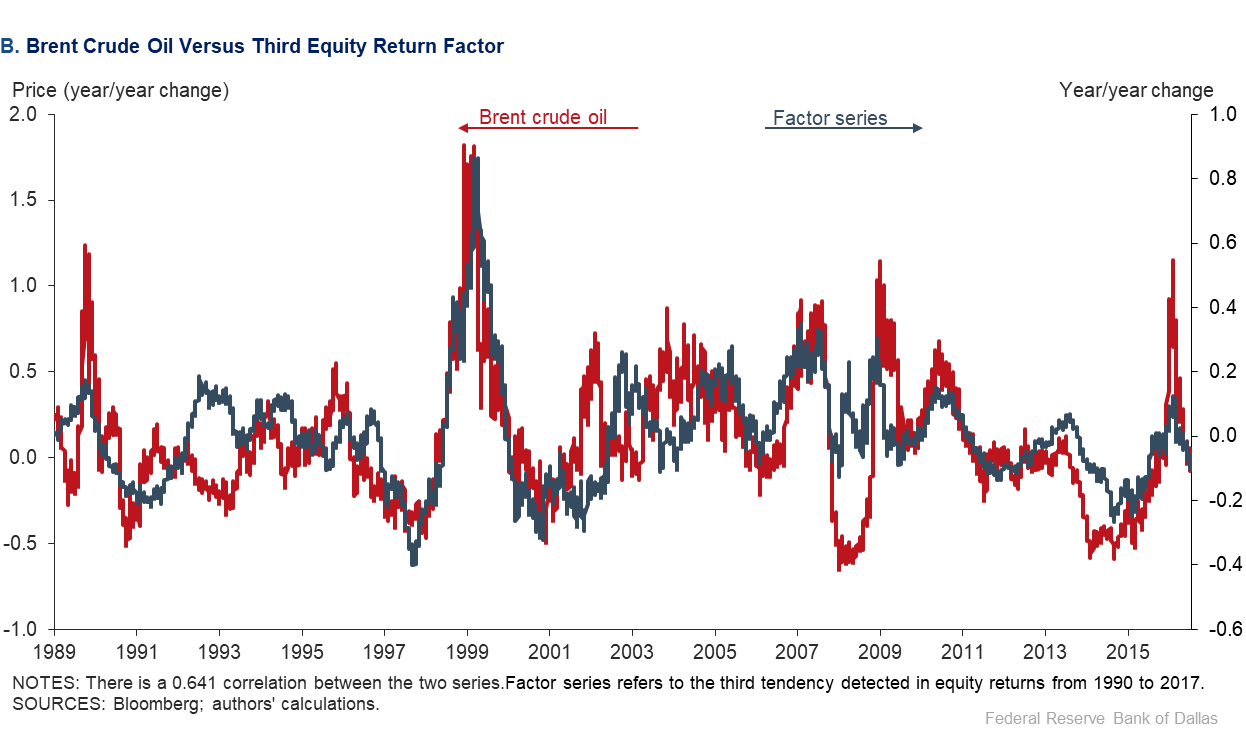
Year-over-year changes in the third factor extracted from equity returns (blue line, Chart 3A) closely align with annual changes in a commodity price index (red line). This relationship is particularly strong for petroleum-based commodities, such as Brent crude oil (red line, Chart 3B).
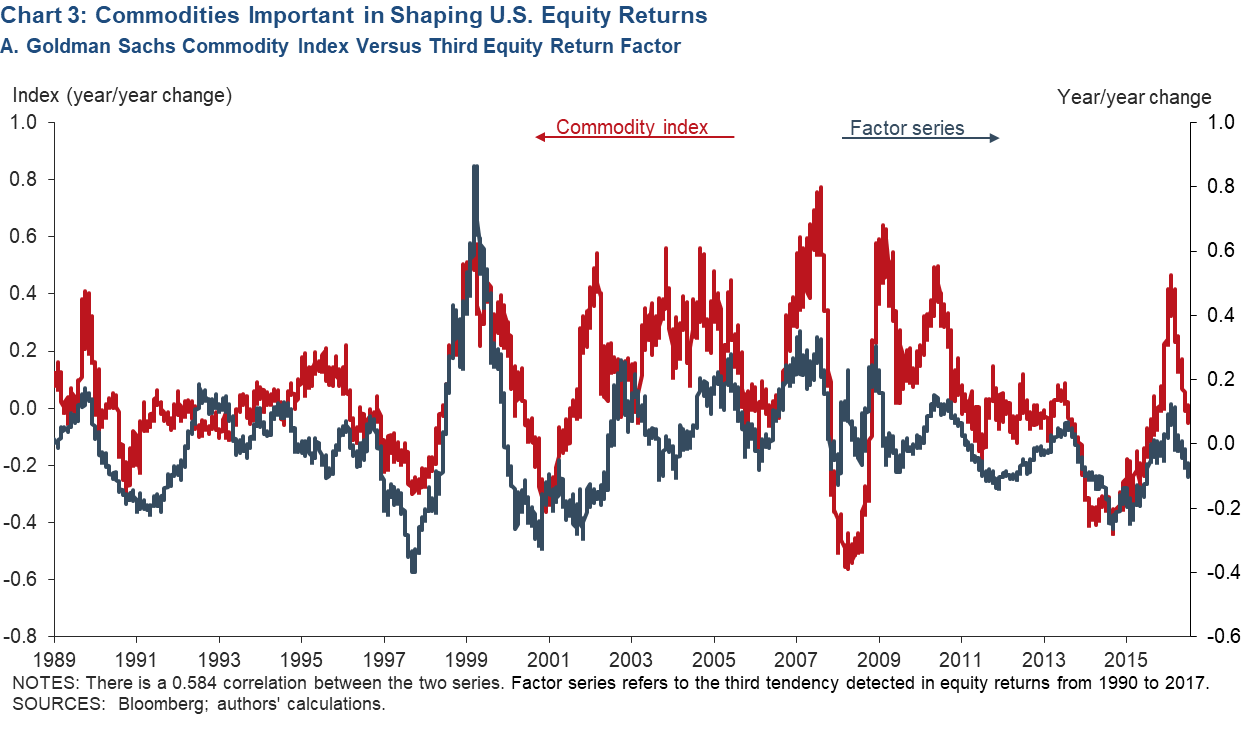
The economic rationale of the relationship follows from higher raw material and energy prices translating into higher production and transportation costs. Firms are not always able to directly pass increases in input costs on to consumers, narrowing profit margins. Conversely, higher commodity prices benefit certain companies, such as those in the energy and base materials sectors.
Much ‘idiosyncratic’ movement unexplained
The proportion of variance in equity returns accounted for by these three common factors increased from around 12 percent in the early 1990s to more than 35 percent in the mid-2010s. The variance share for the first factor, or market beta, in particular increased from 8.6 percent over the 1989–98 period to 31.2 percent in 2008–17, with the greatest increase occurring just after 2008.
These findings suggest a significant change in the importance of the broad market beta following the global financial crisis beginning in 2008, with potentially meaningful implications for understanding risk exposures. Greater individual firm equity exposure to common sources of risk—such as economic growth, inflation or commodity price movements—reduces the ability to diversify portfolios.
Around 2009, commodities went from the third- to the second-most-important common factor in subsample analyses—possibly due to a lower-inflation environment. At the same time, the economic growth and inflation tendencies became even more influential for firms within the financial sector, consistent with evidence on the centrality of U.S. financial firms in the global firm network.
While the top three equity return factors explain 27 percent of the common variation across firms in our full sample, more than 70 percent of equity return movements remain unexplained. This idiosyncratic or unexplained variation leaves plenty of scope for further analysis of other influences affecting publicly traded firms.
About the Authors

Everett Grant
Grant is a research economist in the Research Department at the Federal Reserve Bank of Dallas.

Julieta Yung
Yung is an assistant professor of economics at Bates College.
The views expressed are those of the authors and should not be attributed to the Federal Reserve Bank of Dallas or the Federal Reserve System.