
GDP gain realized in shale boom’s first 10 years
The U.S. shale boom—a product of technological advances in horizontal drilling and hydraulic fracturing that unlocked new stores of energy—has benefited the nation’s oil trade balance and oil-producing regions and led to unusually large employment and output gains.
While quantifying the boom’s benefits is difficult, we show in a working paper analyzing the shale boom during 2010–15 that the benefits extended to the overall economy, adding perhaps 1 percent to U.S. gross domestic product (GDP) during that time.
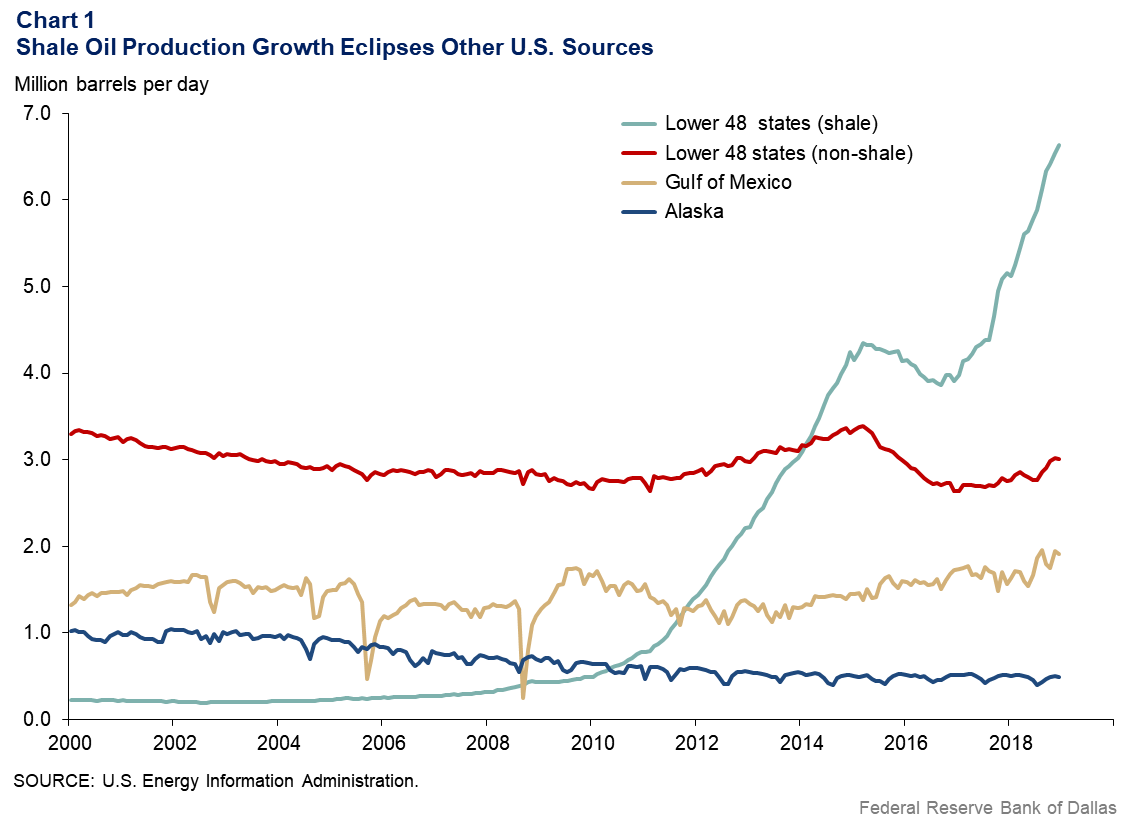
The widespread use of horizontal drilling and hydraulic fracking started in the mid-2000s with natural gas production in the Barnett Shale in North Central Texas. By the start of this decade, the technique had been applied to several shale oil formations—most notably, the Permian Basin in West Texas and New Mexico—with remarkable results.
U.S. shale oil production rose by more than 7 million barrels per day (mb/d) from 2010 to 2019 (Chart 1). Total U.S. oil production, which had declined to 4.4 mb/d in mid-2005, has since nearly tripled to 12.2 mb/d.
Handful of states experience boom
Two states account for the bulk of U.S. shale oil production: Texas and North Dakota. Since the beginning of 2010, North Dakota’s output has risen from 235,000 barrels per day to the current 1.4 mb/d. Texas’ crude oil output has climbed from 1.1 to 5.0 mb/d, with the state producing more than half of U.S. shale oil.
In the early years of the shale boom from 2011 to 2014, when oil prices averaged $95 per barrel, these two states experienced strong employment and GDP growth. North Dakota’s GDP expansion was 4.5 times that of the U.S., while Texas’ was 1.5 times the U.S. rate. Similarly, North Dakota’s employment growth averaged 5.3 percent and Texas’ averaged 3.0 percent, while U.S. employment expanded only 1.7 percent.
Surprising production overwhelms pipelines
The tremendous amount of oil coming from shale during 2010–15 depressed the benchmark West Texas Intermediate (WTI) crude oil price. The differential between domestic WTI and international benchmark Brent widened considerably, to a high of $27, in August 2011.
There were two reasons for the weakness in WTI prices relative to Brent. One was inadequate pipeline capacity in the Permian Basin, where much of the shale oil is produced. The other was the U.S. crude oil export ban. The ban, a holdover from the early 1970s following the OPEC oil embargo of 1973–74, was finally lifted at the end of 2015.
As oil production increased, the ban had become an effective constraint on prices from late 2013 until the restriction ended.
U.S. becomes major crude oil exporter
In 2006, before the shale boom, the U.S imported about twice the oil it produced. That share has declined to two-thirds of domestic production. As a result, the U.S. petroleum trade balance narrowed from negative $492 billion in 2005 to negative $136 billion in 2018.
U.S. exports of petroleum products have steadily risen, increasing fivefold to 5.0 mb/d since 2006. In recent years, the U.S. has also become a major exporter of crude oil, with exports rising from less than 0.5 mb/d in December 2015 to 3.0 mb/d in July 2019.
Model points to broader impacts
Our study, described in the working paper, models the shale oil boom explicitly and can assess the quantitative impact of the boom on the overall economy. Our analysis employs a two-country, multiperiod equilibrium model describing the decisions and interactions of households, oil producers, refiners and the nonoil production sector. It assesses the boom’s implications from 2010 to 2015 by comparing the shale boom’s effect on a model economy with what happens in the economy absent the boom.
We find that the shale boom caused both oil prices and oil product prices to fall. Although refiners amped up output by using a greater amount of their refining capacity, the sheer magnitude of crude production was so high that not all the oil could be absorbed, leading to a significant decline in imports. The decline in imports generated a major improvement in the trade balance for oil, amounting to about 1 percent of GDP.
Given that crude oil accounts for the bulk of the marginal cost of producing fuels—such as diesel and gasoline—the model shows that the shale boom led to 14 percent lower fuel prices in the U.S. and in the rest of the world. The magnitude of the decline in fuel prices was similar in the U.S. and the rest of the world because, unlike with crude oil, there had been free trade in refined products such as fuels.
Measuring the overall effect
How did the shale boom affect the rest of the economy? Our model indicates that cheaper fuel prices allowed households to consume about 3.6 percent more fuel. Households also increased their consumption of other goods because the decline in fuel prices increased their disposable income, leading to a 0.7 percent increase in overall consumption.
The decline in fuel prices increased firm fuel use in the energy sector and in non-oil sectors, according to the model. Our model shows that lower fuel prices led to higher output in non-oil sectors and higher U.S. aggregate investment. Altogether, these effects led to a GDP increase of 1 percent in 2015 relative to 2010.
Given that the actual increase in U.S. GDP was 10 percent over the period, the shale boom accounted for one-tenth of the overall increase. Although the oil sector makes up less than 1.5 percent of the economy, our results suggest that the shale boom generated significant positive spillovers.
About the Authors
The views expressed are those of the authors and should not be attributed to the Federal Reserve Bank of Dallas or the Federal Reserve System.