Energy Indicators

April 22, 2020
Note: The data in this report were released before the record-breaking plunge in U.S. crude prices occurred April 20. West Texas Intermediate prices in Cushing, Oklahoma, and other prices around the U.S. fell well below zero before recovering to positive territory on April 21. This will be more fully addressed in future reports.
Data have begun to roll in that underscore the scale of disruption caused by efforts to curtail and contain COVID-19. Petroleum products supplied in the U.S., particularly gasoline and jet fuel, were down sharply in April. Refinery and chemical plant utilization posted record or near-record declines. Along with these indicators of demand, equity and bond markets have not been kind to the industry so far this year.
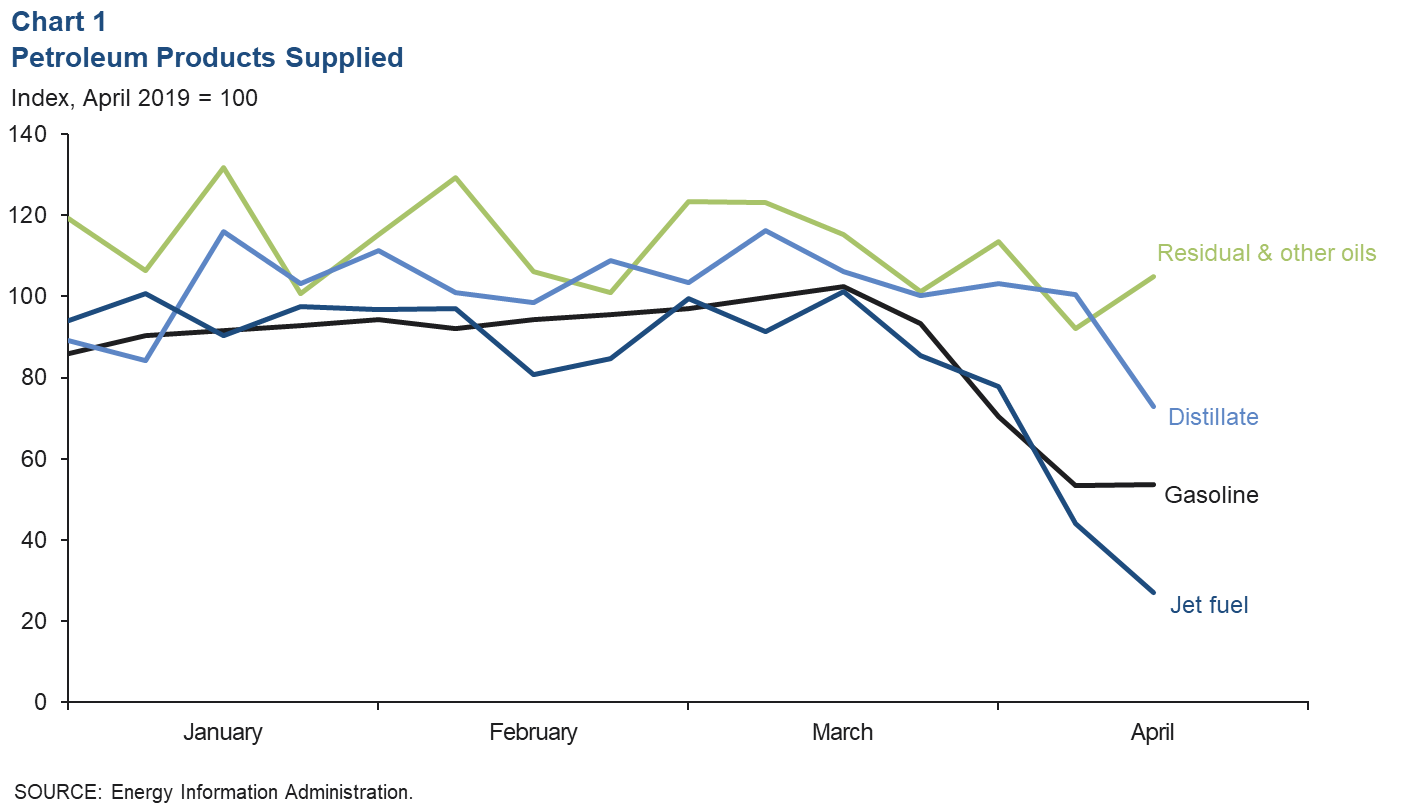
Products supplied in U.S.
Weekly data for petroleum products supplied in April—an estimate of consumption—show a sharp contraction from March (Chart 1). Finished motor gasoline was down 48 percent from mid-March, and jet fuel was down 73 percent. Distillate—for big trucks and construction equipment—was down 31 percent from mid-March. Together, the weekly data show petroleum product consumption is off by over a third.
Downstream activity
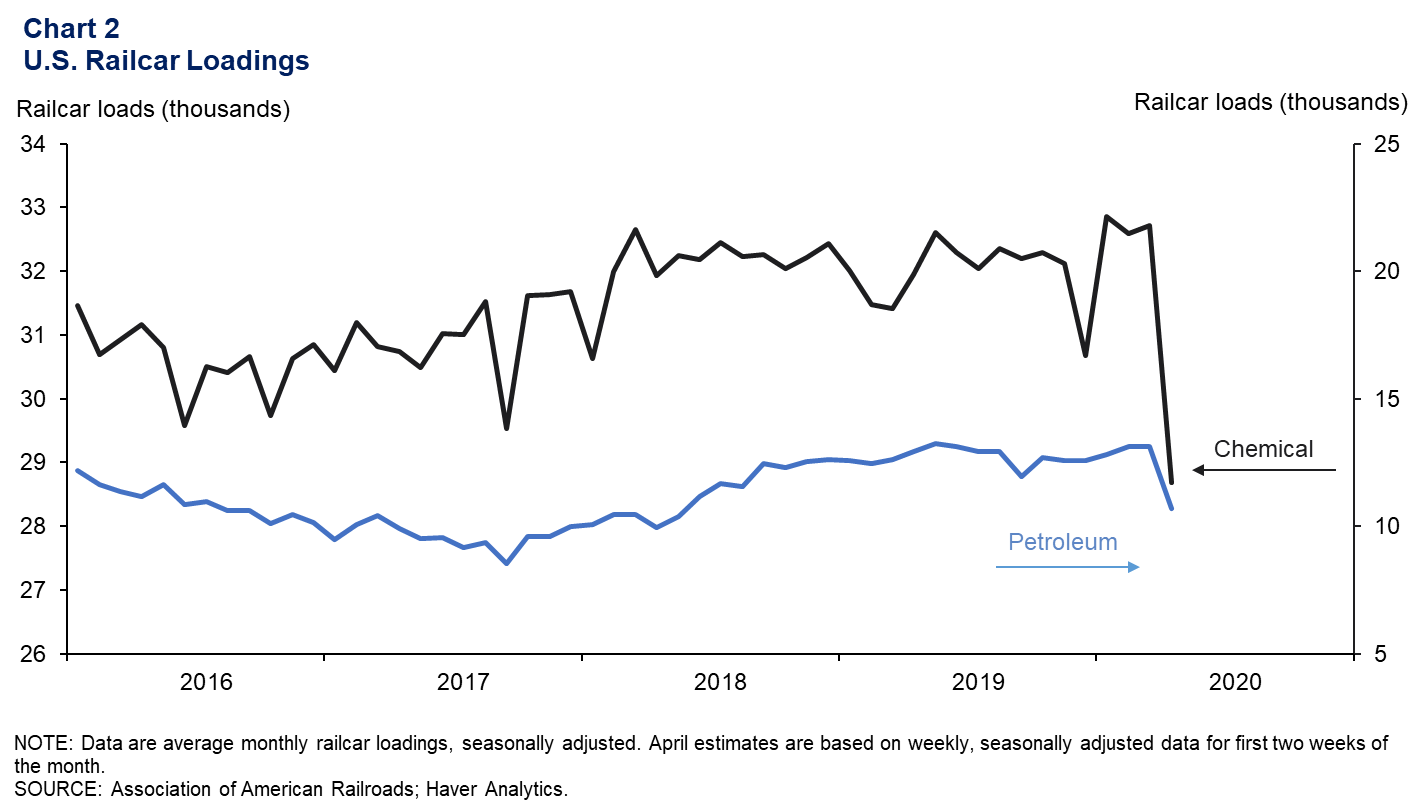
Railcar loadings plunge
One of the best real-time barometers of chemical production is railcar loadings of chemicals. Railcar loadings were down 12.3 percent in the first half of April. If representative of the rest of April, that would be the largest monthly percentage drop in activity on record, though hurricanes have caused steeper week-over-week declines in the past (Chart 2). Petroleum products—which include both fuels and crude oil—fell 18.4 percent. That is also the largest month-over-month percent change and level decline (-2,419 carloads) in the dataset. The data are consistent with reports of rising fuel and chemical product inventories and lower utilization rates in U.S. downstream facilities.
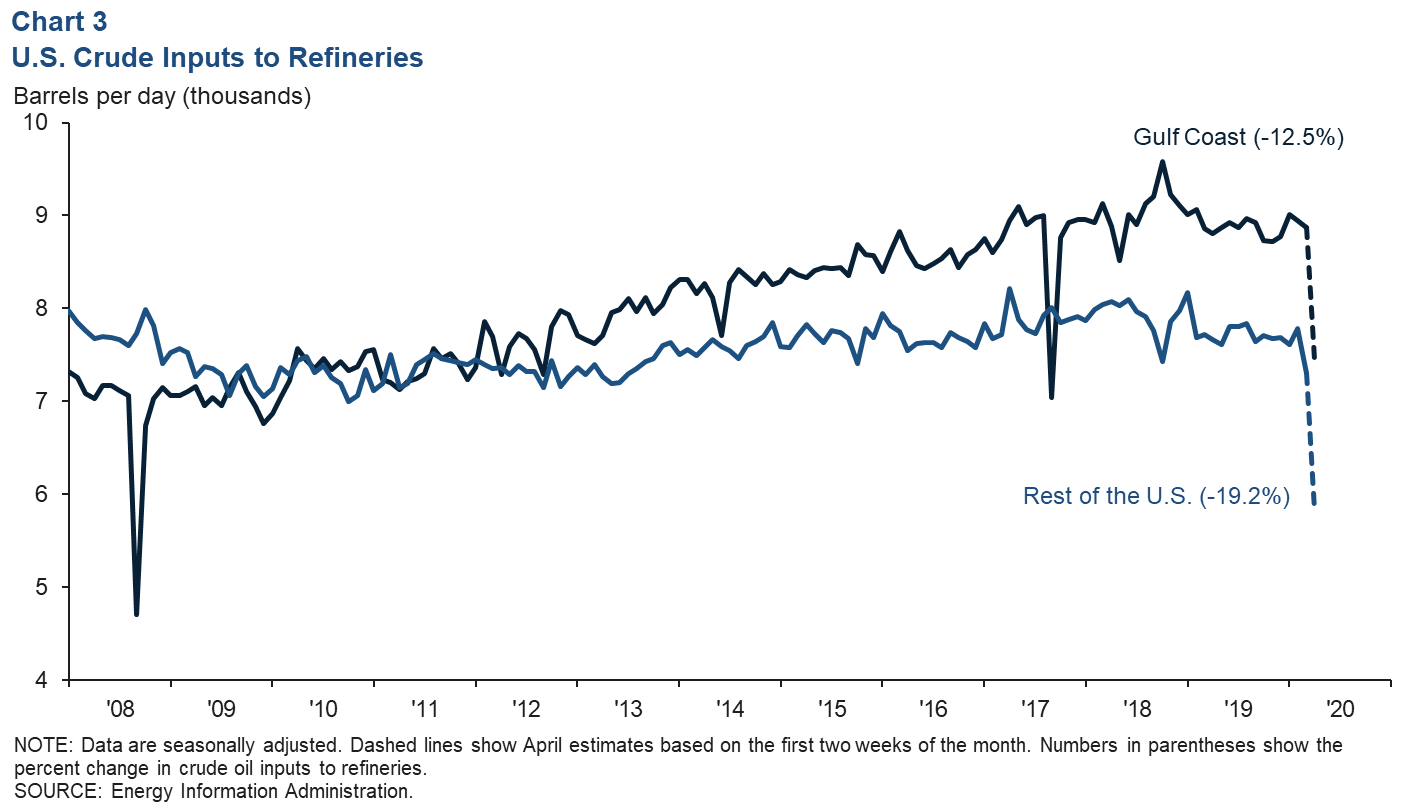
Refineries sharply reduce utilization
The amount of crude oil input into U.S. refineries fell in the first half of April by 18 percent, or -3.0 million barrels per day (mb/d) on a seasonally adjusted basis. That drop was split between the U.S. Gulf Coast (-1.4 mb/d) and the rest of the U.S. (-1.5 mb/d) (Chart 3). Combined, this brings the seasonally adjusted U.S. utilization rate down to an estimated 73.5 percent in the first half of April—well below the postrecession average rate of 89.8 percent for the month. That’s the lowest utilization rate for any month since Hurricane Ike struck the Gulf Coast in 2008.
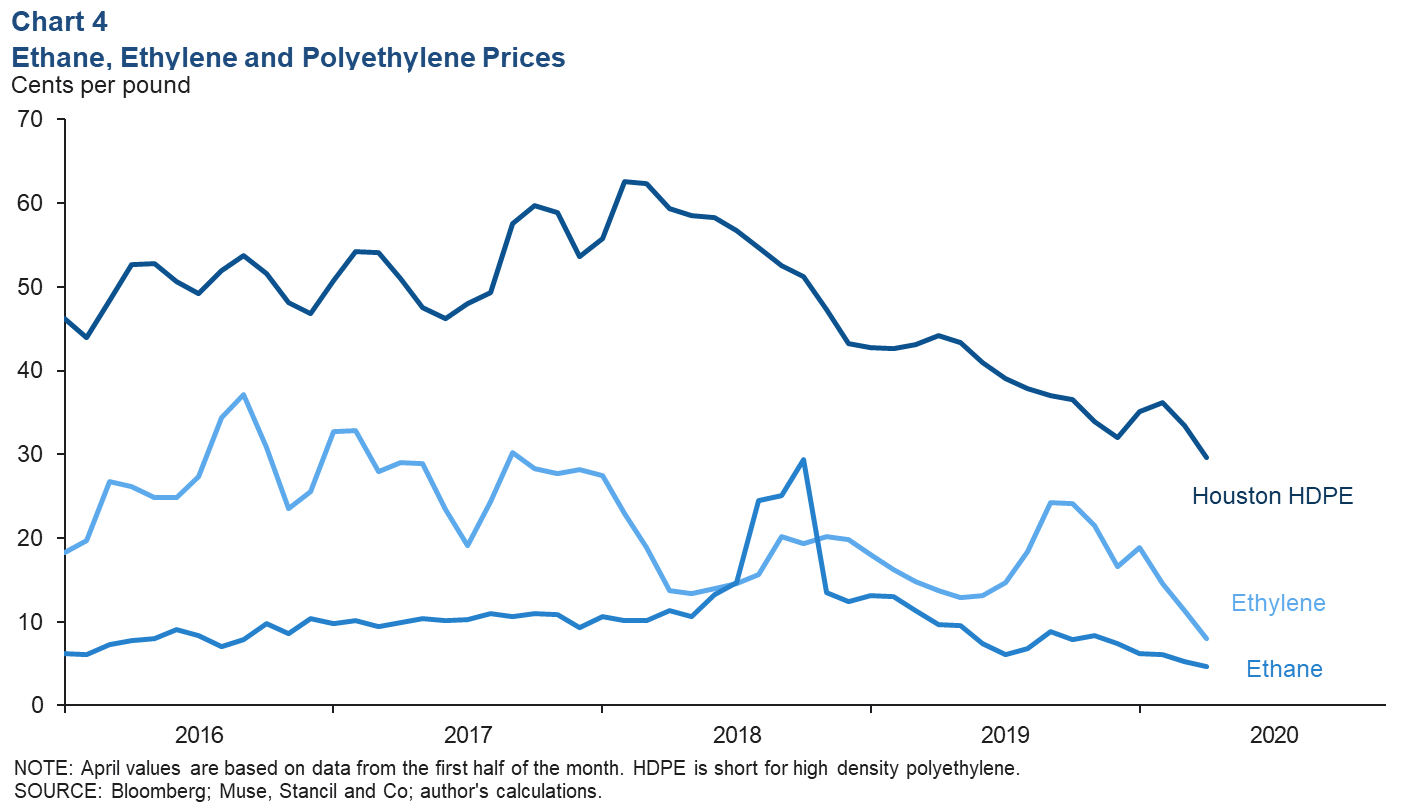
Petrochemical prices and margins squeezed
Polymer prices fell on the Gulf Coast in the first half of April. High-density polyethylene dropped to 29.6 cents per pound (Chart 4). Recent declines have been driven both by an erosion of demand due to efforts to curtail COVID-19 and by cheaper crude-oil-derived chemical feedstock used to produce the marginal supplies of intermediate substances like ethylene. Ethane feedstock fell to 4.5 cents per pound (10.5 cents per gallon). The chain margin (spread from feedstock to polymer) for polyethylene fell to 25.2 cents per pound, its lowest level since at least the 2007–09 Great Recession.
Financial markets
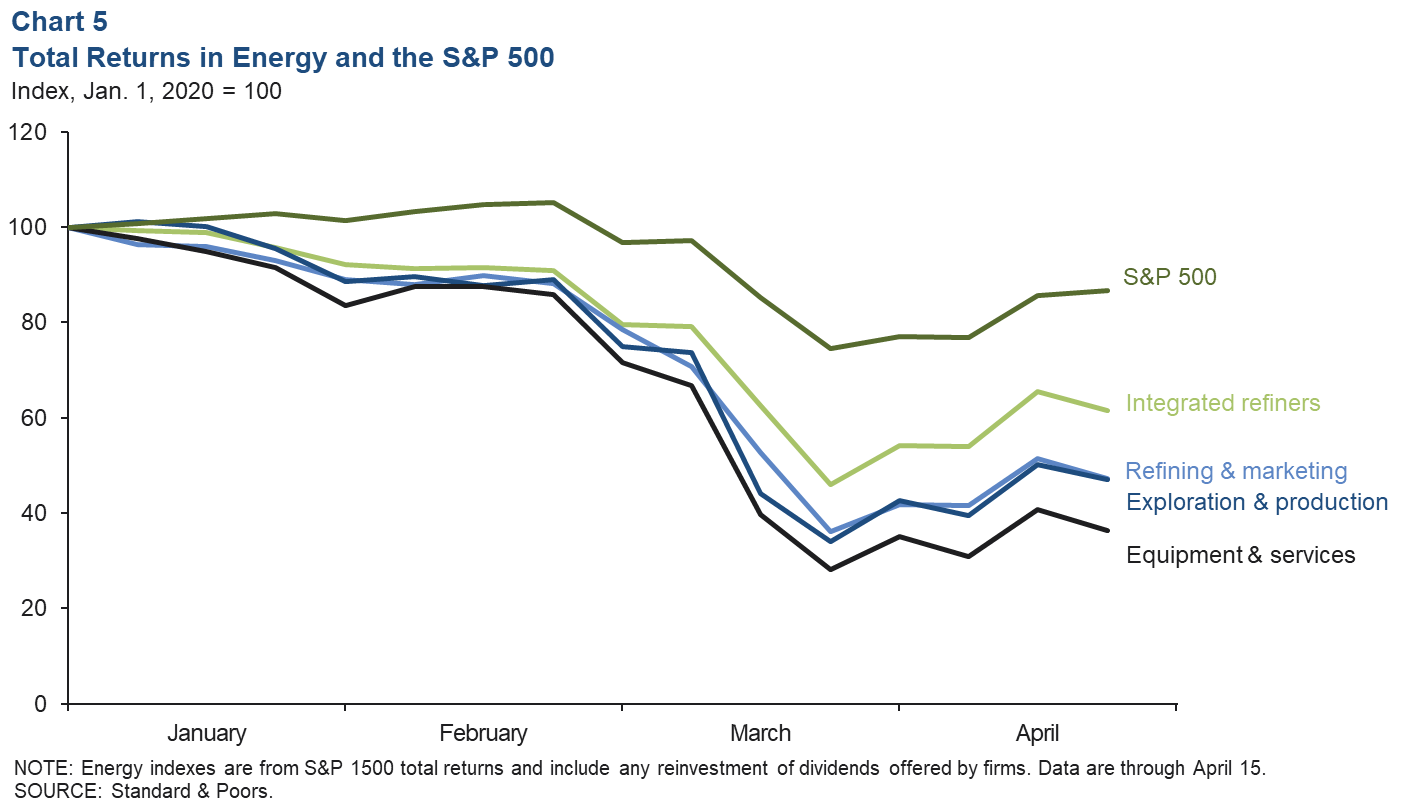
Energy equities hammered relative to S&P 500
Year to date, equities in the energy sector have continued to underperform the S&P 500, particularly since February, when COVID-19 began to significantly impact global oil demand (Chart 5). The equipment and services (oilfield services firms) group fared the worst, dropping nearly 64 percent. The best-performing subsector was integrated refiners (firms that are both oil producers and refiners, like Exxon), which collectively fell nearly 39 percent. For comparison, over this same period, the broader S&P 500 fell 13.3 percent.
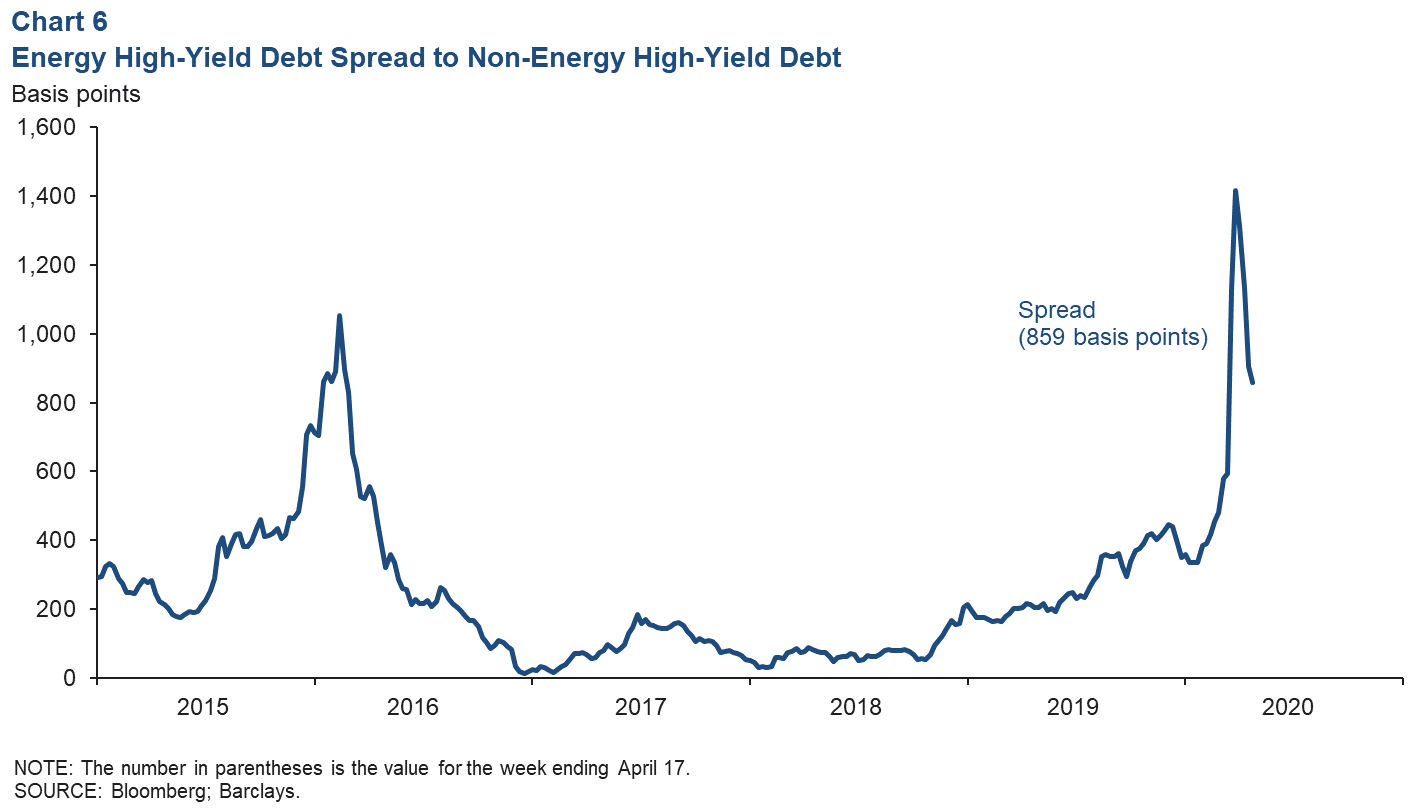
Hefty high-yield premium demanded of energy debt
The premium demanded of energy firms by high-yield bond investors relative to all other forms of corporate high-yield debt surged in late March as the coronavirus spread around the world. Energy firms were paying as much as 1,416 basis points (14.2 percentage points) above the average demanded of other industries in late March (Chart 6). This surpasses the highest levels seen during the 2015–16 oil bust.
About Energy Indicators
Questions can be addressed to Jesse Thompson at jesse.thompson@dal.frb.org. Energy Indicators is released monthly and can be received by signing up for an email alert. For additional energy-related research, please visit the Dallas Fed’s energy home page.