Energy Indicators

June 16, 2020
Energy industry payrolls plunged in April, and mining sector unemployment insurance claims continued to climb in May. Crude prices were higher, but drilling activity and oil and gas production declined. Inventories of crude and petroleum products reached a new record high as net imports surged to their highest level since 2018. Natural gas exports remain elevated but are projected to decline.
Employment
U.S. oil and gas jobs fall sharply in April
Support activities for oil and gas operations jobs (mostly oilfield services) fell at an annual rate of 43.3 percent (-32,800 jobs, not annualized) over the three months ending in April 2020, while oil and gas extraction (mostly exploration and production companies) fell at a 4.8 percent rate (-1,900) (Chart 1). Seventy percent of the combined mining sector losses were in Texas. Mining and oil and gas machinery manufacturing also declined an annualized 37.9 percent for the three months ending in April (-7,800).
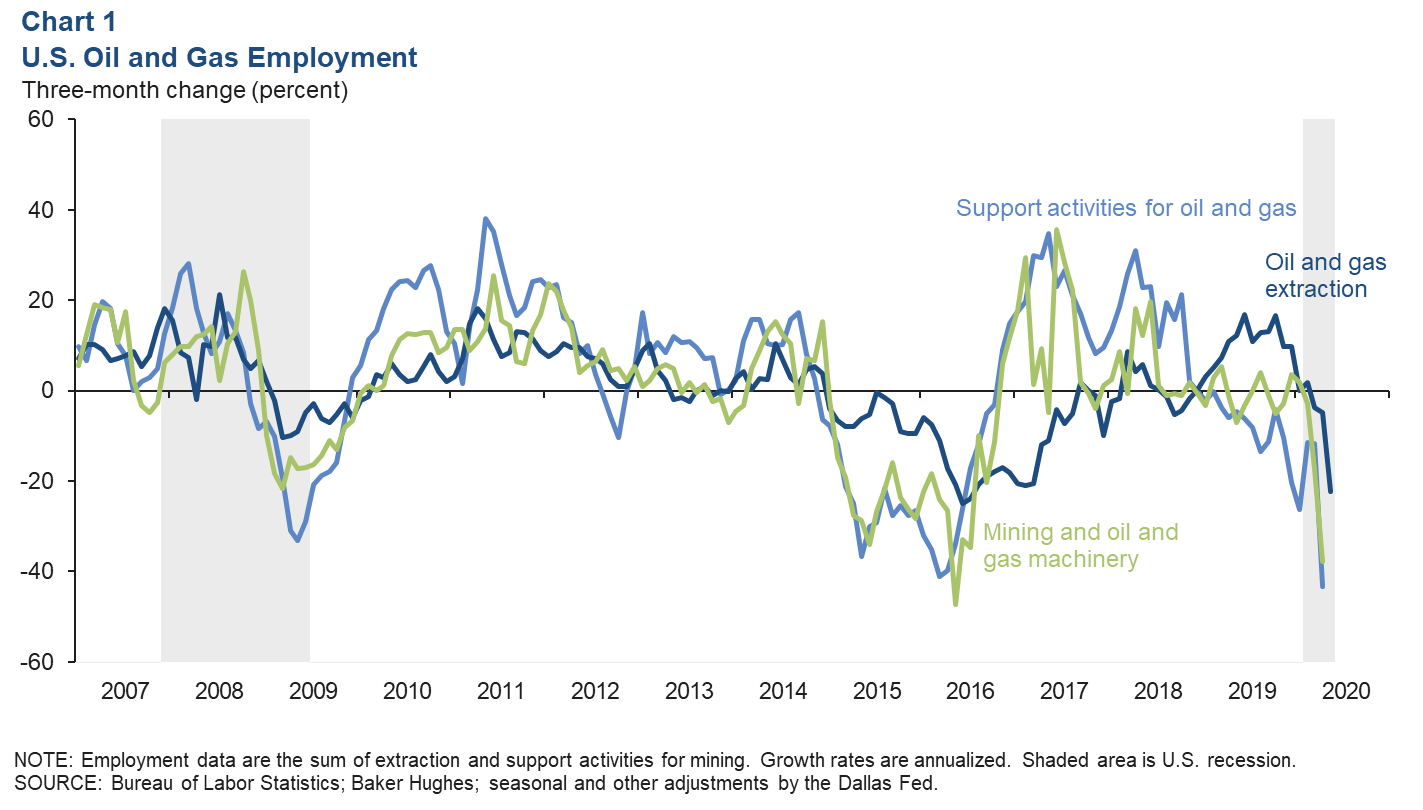
The pace of decline for U.S. extraction job counts in May accelerated to a three-month rate of 22.4 percent (-6,900). In the context of continued weekly claims for unemployment insurance in Texas’ mining sector, this strongly suggests deeper oil and gas job losses ahead for the state in May.
Roughly 22 percent of Texas mining employees filed for unemployment since February
Over 52,500 initial claims for unemployment benefits were filed by individuals in the mining industry (nearly all of which is oil and gas) from the week of March 7 through May 30 (Chart 2). That amounts to over 22 percent of all industry payroll jobs in February. The pace of new weekly mining-industry claims in Texas slowed toward the end of May, but the sector is continuing to rise in the ranks of the hardest-hit industries like arts, entertainment and recreation.
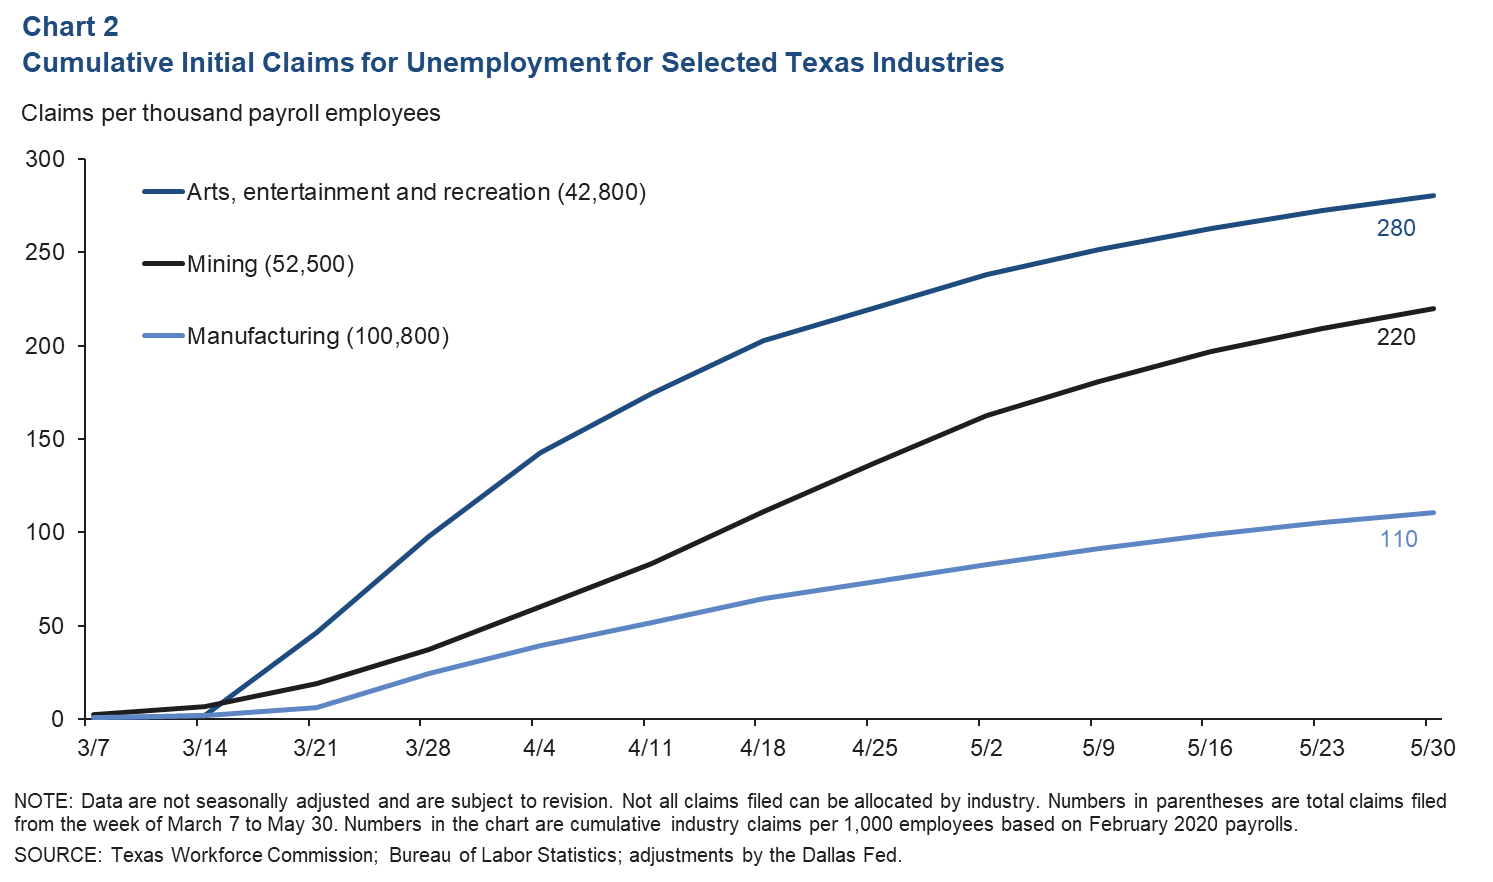
The energy industry supply chain has a large presence in Texas’ fabricated metals and machinery manufacturing sectors. The number of individuals from the manufacturing industry that filed for unemployment since early March amounted to over 11 percent of February payroll job counts.
Oil
Crude prices up modestly as production and drilling fall
The price of West Texas Intermediate (WTI) crude averaged $3 per barrel the last week of April after an extraordinary drop in consumption and a price war left the world dramatically oversupplied with crude (Chart 3). U.S. producers rapidly shut in existing wells as prices collapsed, deferring completing recently drilled wells and slashing capital spending plans. Monthly U.S. crude production fell to 12.1 million barrels per day (mb/d) in April as a result, and weekly estimates place U.S. crude production near 11.3 mb/d by the end of May. OPEC+ (the Organization for Petroleum Exporting Countries (OPEC), Russia and others) along with other energy producers around the world also cut output as market conditions worsened and crude inventory surged.
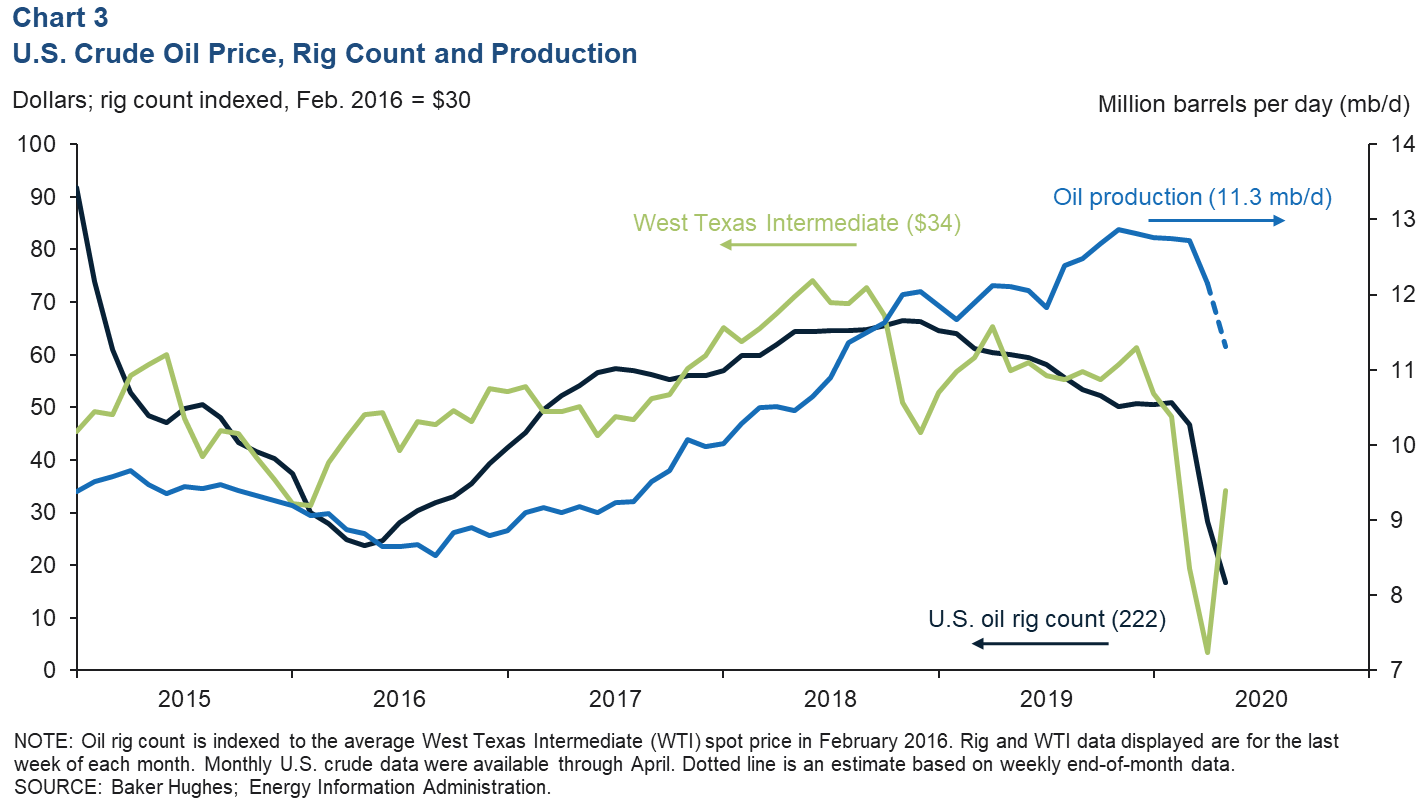
In addition to supply being cut, May saw high-frequency measures of mobility, economic activity, weekly fuel demand and spare oil storage capacity begin to either recover or stabilize, calming fears that global storage capacity would be exhausted. WTI recovered to $34 the last week of May.
In the 2015–16 oil bust, WTI hit bottom near $26 in mid-February 2016, but the rig count continued to fall until mid-May 2016 as oil prices stabilized near industry drilling breakevens. The end-of-May-2020 recovery of WTI into the mid-$30’s is enough to cover operating costs for existing wells and is supportive of restarting some shut-in crude production; however, it is not enough for oil companies to break even on new wells. The number of rigs drilling for oil fell to 222 the final week of May, and data for the first two weeks of June saw the number decline further to 199.
Crude and petroleum product net imports and inventories surge
U.S. inventories of crude oil and petroleum products surged the three months ending in May to 2,078 million barrels. This includes the Strategic Petroleum Reserve, which is allowing producers to rent storage space. Data for the week of June 5 showed a further increase to 2,090 million barrels (Chart 4).
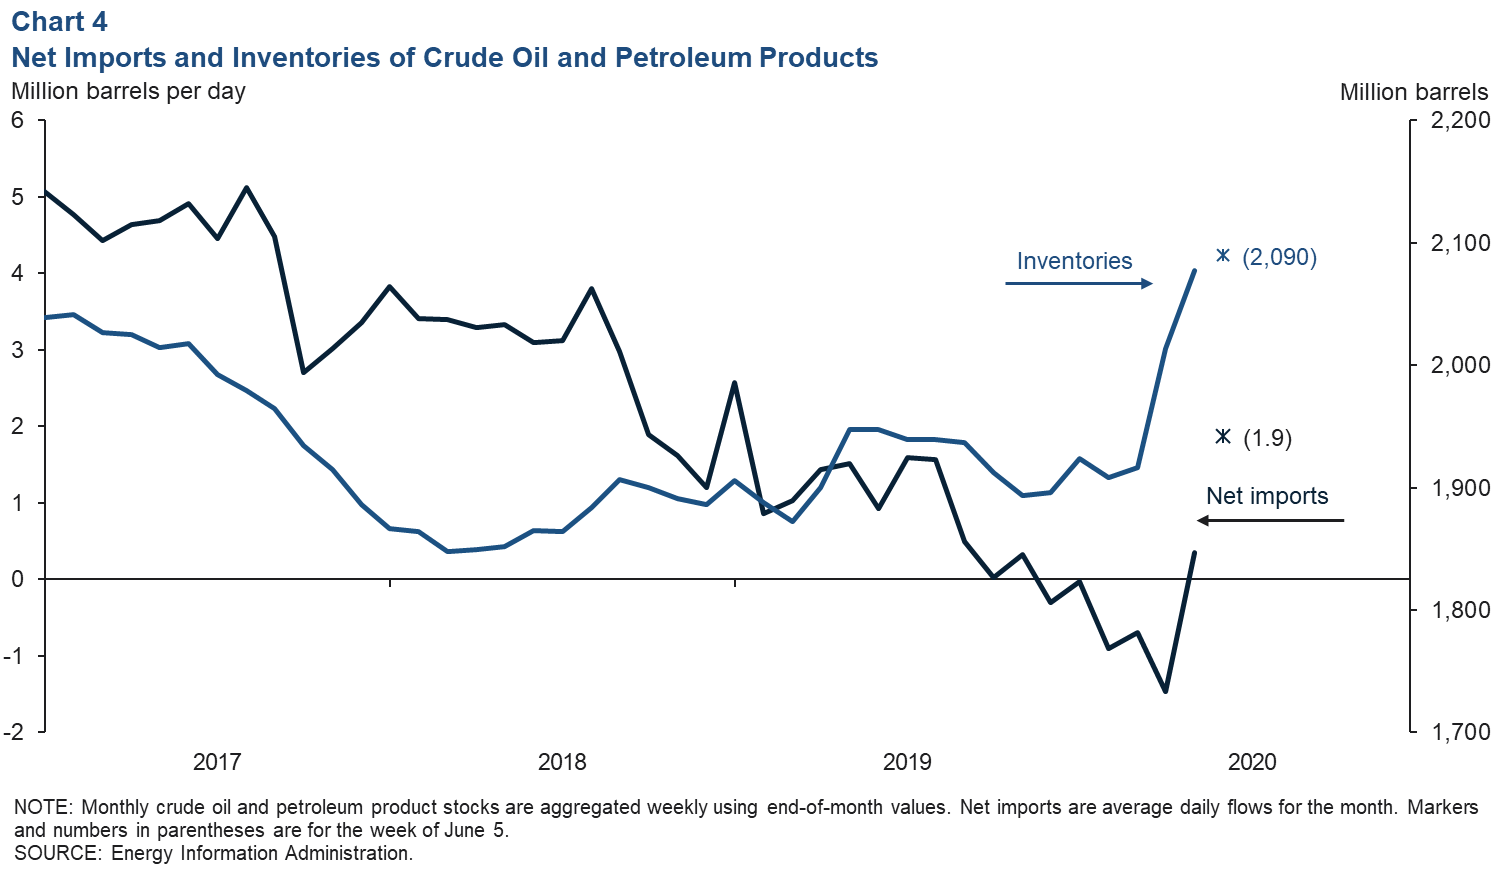
While the main driver of rising stocks since March has been weak consumer demand due to COVID-19 and efforts to contain it, data for the past few weeks point to rising net imports of crude and products. After five months as a net exporter of liquids, the U.S. imported 0.35 mb/d on average in May and 1.9 mb/d the week of June 5. The increase was mainly due to crude imports, mostly from Saudi Arabia. At the same time, U.S. crude exports have eroded amid falling domestic production and elevated global inventories.
Net exports of petroleum products were also soft in May, down about 1.3 mb/d from April. The move was driven more by a decline in exports (mostly from finished motor gasoline) than a rise in imports.
Natural gas
U.S. natural gas production and price ease in April and May
U.S. natural gas production was almost 115 billion cubic feet per day (bcf/d) in March 2020, down 1.7 bcf/d from its November 2019 high of 116.6 bcf/d (Chart 5). Over that same period, natural gas co-produced with oil from liquids-focused shale basins was buoyed by the Permian where oil production was still increasing. However, estimates for April indicate that dry-gas production in the Permian joined the Bakken and Eagle Ford in decline, falling a modest 0.2 bcf/d compared with March.
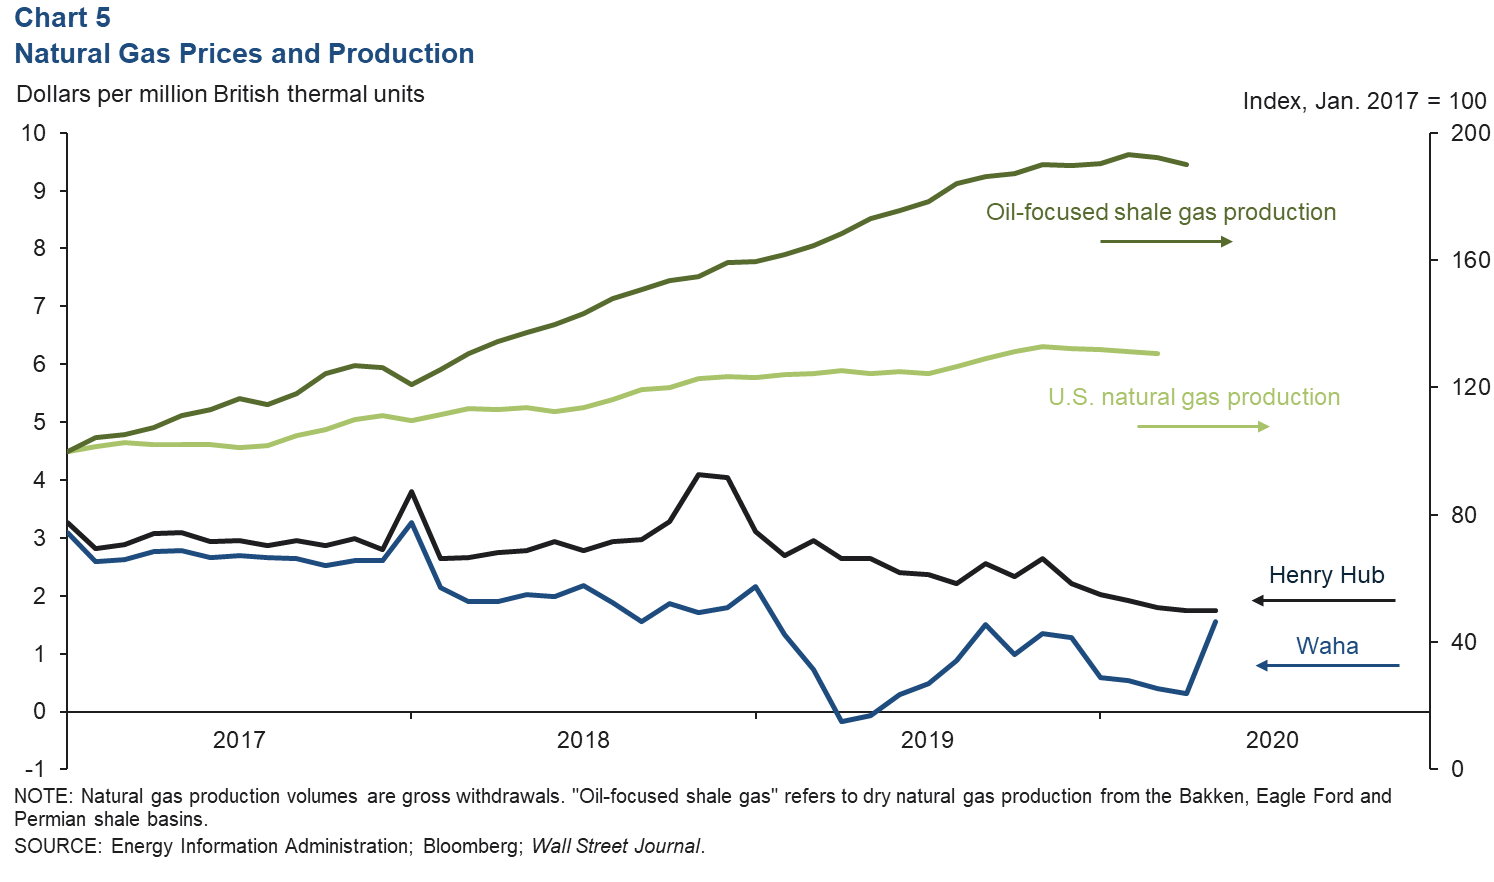
The average price of natural gas in West Texas (Waha) jumped from 32 cents per million British thermal units in April to $1.56 in May. The increase was likely driven by a fall in co-produced gas from oil wells. The price of natural gas at Henry Hub eroded to average $1.75 in May. U.S. natural gas consumption—though not hit as hard as motor fuels—has been seasonally weak as stay-at-home orders reduced commercial, industrial and utility demand for gas.
Natural gas export growth pauses, projected to decline amid high inventories
Seasonally adjusted pipeline exports of natural gas slowed in early 2020, mostly due to a dip in exports to Canada. March saw pipeline exports of 8.0 bcf/d, and recent projections from the Energy Information Administration suggest weaker pipeline exports in April and May (Chart 6). Liquefied natural gas (LNG) exports were 7.9 bcf/d in March. The global economic crisis and attendant drop in LNG prices relative to U.S. benchmark Henry Hub are contributing to projections of further slowing of LNG exports in the coming months.
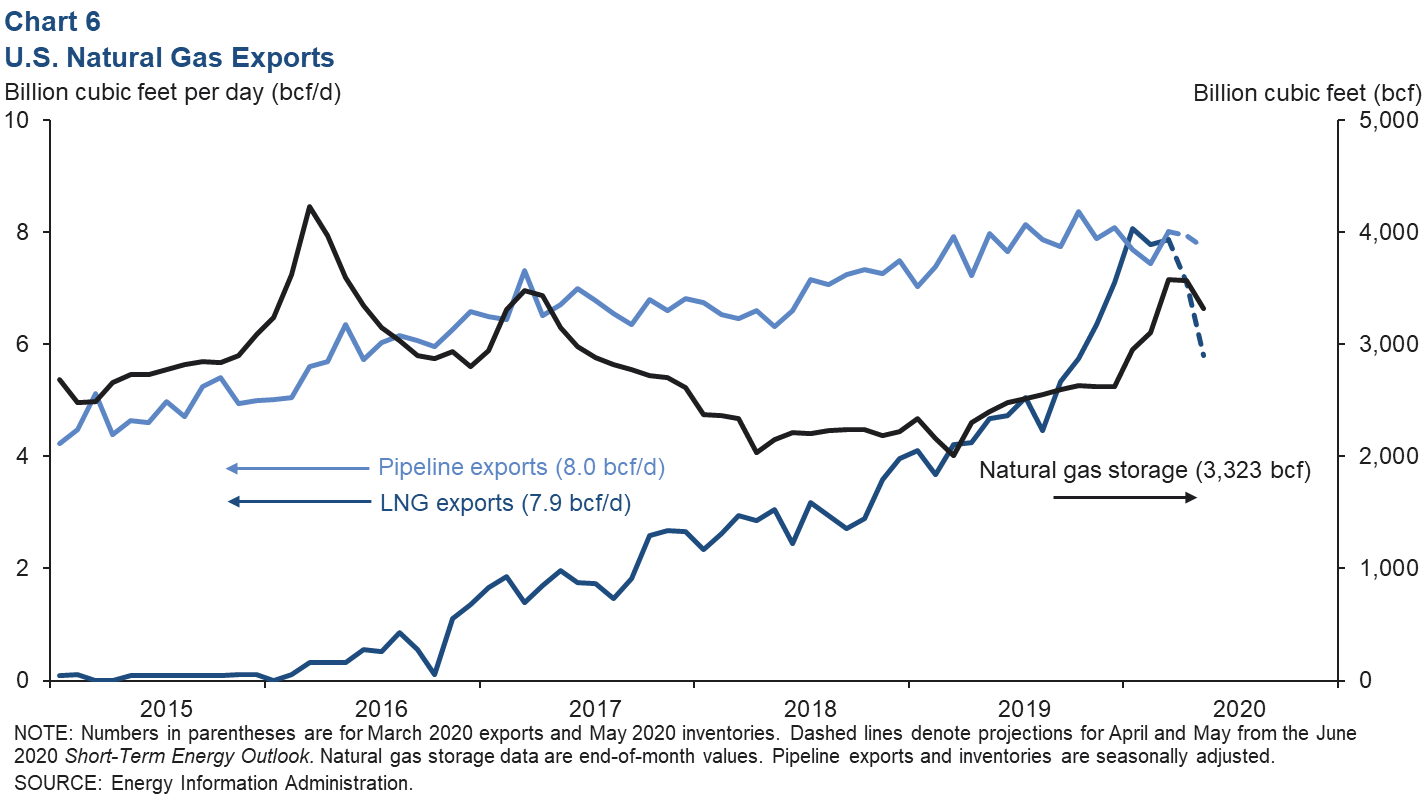
Seasonally adjusted month-end natural gas storage in the lower 48 states rose markedly throughout the 2019–20 winter months and peaked in March. Natural gas stocks at the end of May slipped by 249 billion cubic feet.
About Energy Indicators
Questions can be addressed to Jesse Thompson at jesse.thompson@dal.frb.org. Energy Indicators is released monthly and can be received by signing up for an email alert. For additional energy-related research, please visit the Dallas Fed’s energy home page.