Dallas Fed Mobility and Engagement Index gives insight into COVID-19’s economic impact
As the human and economic toll from the COVID-19 pandemic mounts, near-term forecasts of output and employment are crucial for assessing appropriate monetary, fiscal and health policy responses. An appropriate real-time index of mobility and engagement can provide valuable real-time insight into the economic impact.
Economic forecasts typically rely on recent monthly or quarterly data on economic activity. These data are usually available several weeks, or even months, after the period in question. Such delays are crippling. In mid-March, it became clear there was an acute need for real-time measurement of the rapid slowdown in economic activity.
A key driver of the slowdown was a decline in mobility as people limited trips outside their homes in order to mitigate the spread of COVID-19. Many businesses sharply curtailed, or even ceased, operations due to government-mandated closures, concern for the health of workers or a lack of business, as consumers avoided social interaction.
To gain insight into the economic impact of the pandemic, we developed an index of mobility and engagement, based on geolocation data collected from a large sample of mobile devices. Our Mobility and Engagement Index (MEI)—described in greater detail below—plummeted in mid-March, coinciding with a large drop in economic activity. Recently, the index has started to advance, even prior to the relaxation of stay-at-home orders. The uptick suggests economic activity may have bottomed out and could begin to improve.
Dallas Fed Mobility and Engagement Index
The firm SafeGraph, a geospatial data analysis firm, has provided several datasets to researchers to help society respond to COVID-19. Its Social Distancing Metric database contains aggregated, anonymized, privacy-safe data on a range of spatial behaviors of mobile devices. No single indicator in the SafeGraph dataset adequately captures all aspects of mobility and engagement, and each is noisy and subject to idiosyncrasies.
Our index therefore summarizes the information in seven different variables, each measured daily at the county level and relative to its weekday-specific average over January–February. The variables are:
- Fraction of devices leaving home in a day.
- Fraction of devices away from home for three to six hours at a fixed location.
- Fraction of devices away from home longer than six hours at a fixed location.
- An adjusted average of daytime hours spent at home.
- Fraction of devices taking trips longer than 16 kilometers (10 miles).
- Fraction of devices taking trips less than 2 kilometers (1.2 miles).
- Average time spent at locations far from home.
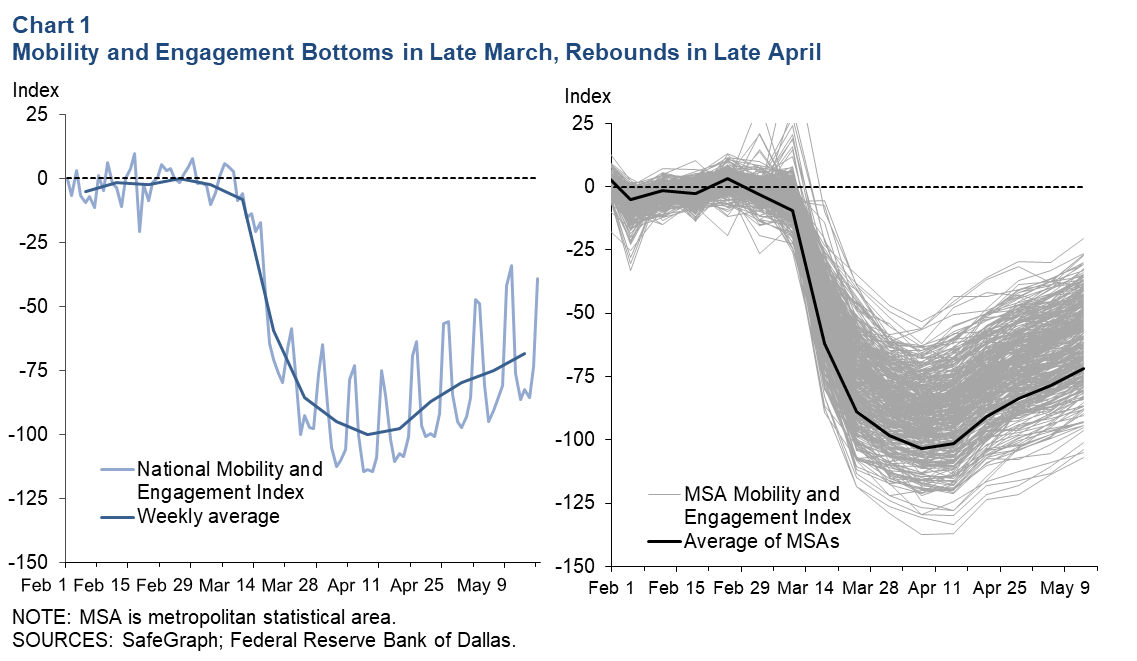
These variables are combined via principal component analysis, which extracts a weighted average of the seven-variable series that best explains their variation. The resulting combination is our county-level MEI. We then aggregate the county-level MEIs to the metropolitan statistical area (MSA) and state and national levels. The national MEI is plotted in the left panel of Chart 1, scaled so that January and February average zero, and the minimum of the weekly averages (the week ended April 11) is -100.

The MEI varied minimally in January through early March 2020, reflecting the regular spatial behavior of cellphone users before the pandemic. The index began to decrease beyond its normal range in the second week of March and fell sharply in the week ended March 21.
By the end of March, mobility slowed its decline, and over the first half of April, it moved sideways. In the second half of April, the index began to increase, as more Americans began leaving home and taking longer trips away from home. For the average of the week ended May 2, the index was 20 percentage points above the mid-April bottom.
Each gray line in the right panel of Chart 1 is the MEI for an MSA. The tightness of the range in these local MEIs indicates that most metro areas decreased their mobility and engagement at approximately the same time and by roughly the same amount, despite differences in the timing and scale of government interventions and the local pace of COVID-19 infections. A similar pattern holds for counties and states and suggests that stay-at-home orders only partially explain the limited mobility and engagement. This is corroborated by the MEI’s rise in the second half of April before stay-at-home orders were lifted, as well as by the findings of several academic studies.
The MEI is consistent with other mobility metrics that have become available since the start of the crisis. For example, our index is tightly correlated with the Google Covid-19 Mobility metrics for residential dwelling and travel for work, recreation or shopping purposes.
Relationship to economic activity
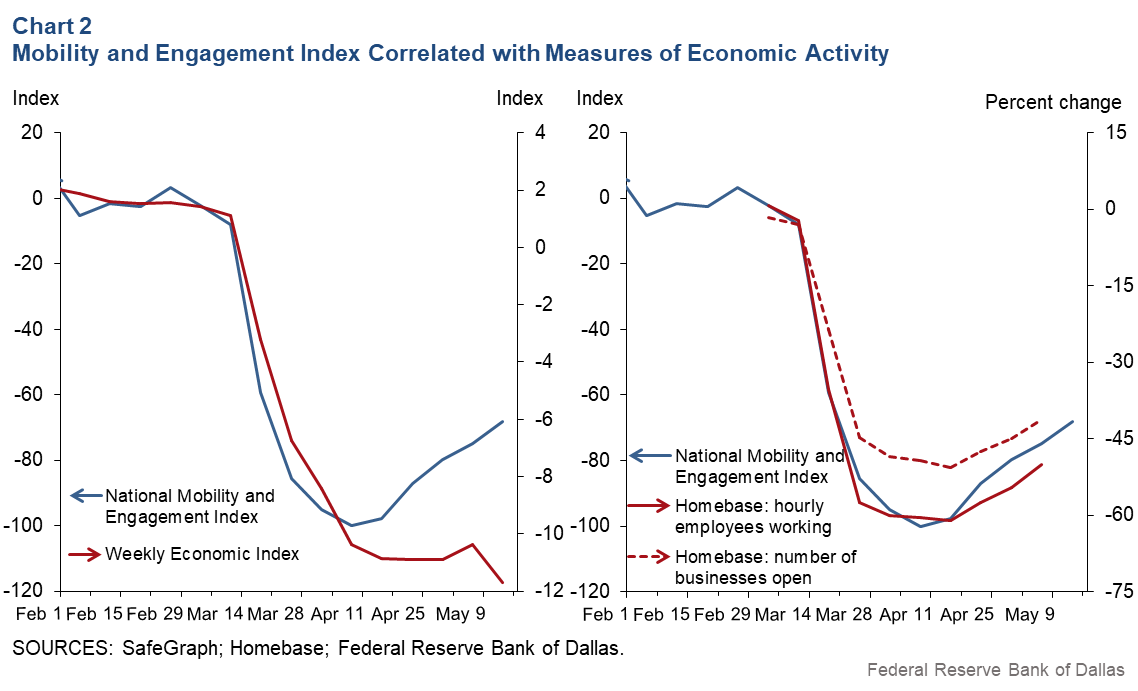
Without much doubt, diminished mobility and engagement was a major factor in the slowdown in economic activity and the sharp rise in unemployment. The left panel of Chart 2 plots the national MEI along with the Weekly Economic Index (WEI).

The WEI, developed by researchers at the Dallas and New York Feds and Harvard econometrician James Stock, is an aggregate of 10 daily and weekly indicators of economic activity that is highly correlated with output growth relative to a year prior.
The steep decrease in the MEI coincided with the large drop in the WEI over the weeks ended March 21 through April 11. In the second half of April, mobility and engagement began rising, while the WEI only slowed its decline. While it is too early tell, a continued drop in the WEI could indicate more conventional recessionary dynamics, as cautious consumers and businesses pull back from spending and hiring, amplifying the initial disruption caused by curbing mobility and engagement.
The right panel of Chart 2 plots the MEI along with indicators of small business activity from the scheduling software firm Homebase. Both the number of small establishments open for business as well as the number of hourly employees working at those establishments contracted sharply with the decline in the WEI. Recent weeks show signs of improvement in small business activity with an upturn in mobility and engagement.
The impact of diminished mobility and engagement on economic activity is also evident when looking across counties or MSAs. We find, for example, that at the April low of mobility and engagement, localities engaging in 10 percent greater limitations on such interaction relative to the national average saw an additional 0.6 percent of the population claiming unemployment insurance, an additional 2.8 percent reduction in small businesses employment and an additional 2.6 percent increase in small business closures.
Mobility, engagement and the economic outlook
The MEI captures what is arguably the primary driver of the large drop in economic activity and, therefore, is a key metric in forming our assessment of economic conditions and the outlook for future activity. We expect limits on mobility and engagement to decline further in the coming weeks and months as government restrictions ease.
However, we anticipate mobility and engagement to remain restrained as long as the threat of COVID-19 infection persists, regardless of official restrictions. As a result, economic activity is also expected to continue depressed, as the hardest-hit industries—such as leisure and travel—remain materially impacted. Of course, many uncertainties remain, chief among them the path of COVID-19 and the success or failure of efforts to develop treatments and vaccines.
The Dallas Fed Mobility and Engagement Index (formerly the “Social Distancing Index”) measures the deviation from normal mobility behaviors induced by COVID-19. The updated name recognizes that social distancing, or the limiting of close contact with others outside your household, can be practiced while mobility and engagement improve.
Along with revising the index’s name, we also changed the sign of the index to make it more intuitive as a measure of mobility and engagement.
