Energy Indicators

September 18, 2020
Oil prices recovered to the low-$40s over the summer before weakening in September due to declining confidence in the path of global demand. Job losses in the oil sector continued to mount, as did bankruptcies. While the worst may be behind the industry, more job losses and business failures are likely over the short to medium term.
Prices
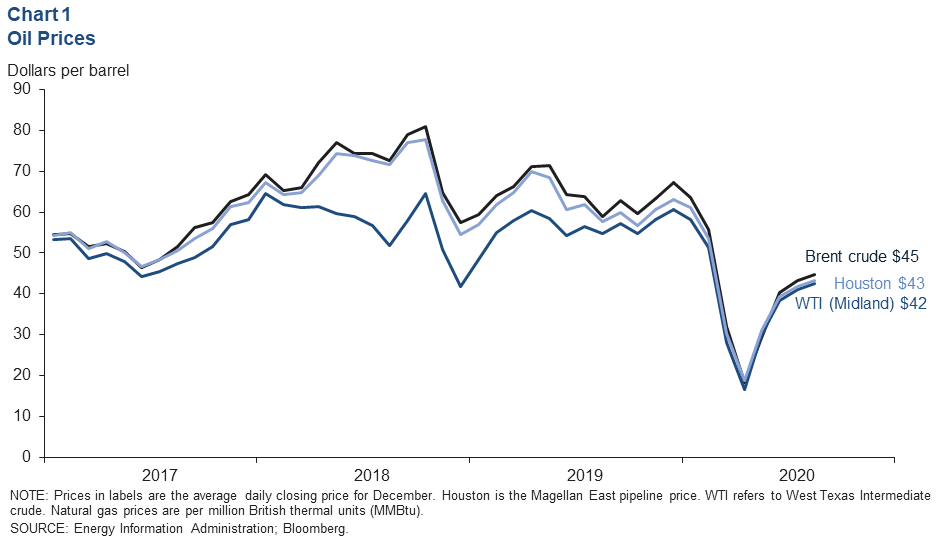
Oil prices steady over summer months
The price of oil held relatively stable in July and August. Brent crude averaged $45 per barrel in August, Houston was at $43 and West Texas Intermediate (WTI) crude priced in Midland, Texas, averaged $42 (Chart 1). OPEC countries, Russia and several other nations (OPEC-plus) held nearly 10 mb/d of production off the market in April to July while global demand recovered from efforts to contain the first wave of COVID-19 infections and shut-in production in the U.S. and elsewhere was brought back online.
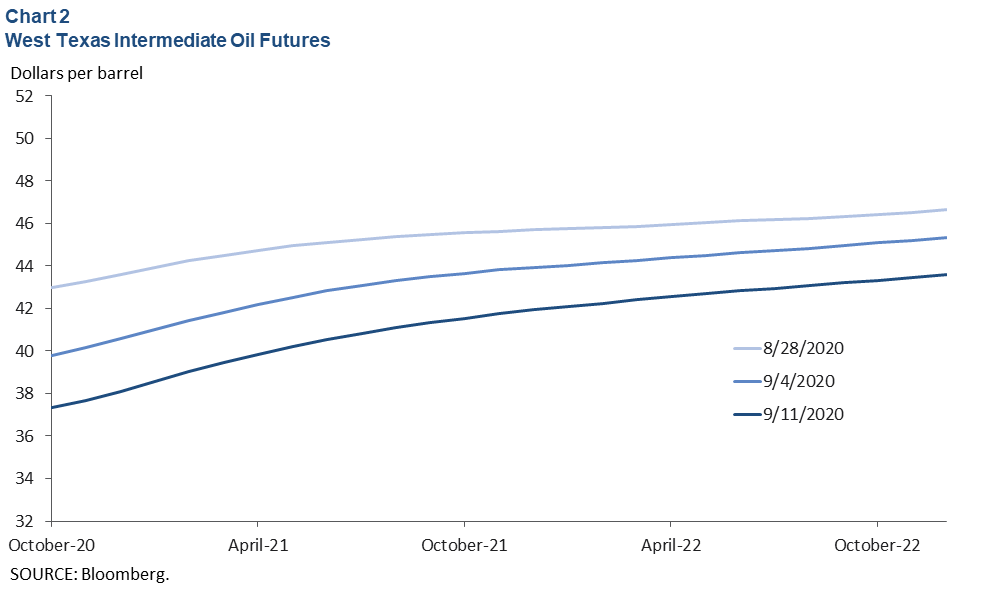
Price expectations turn down in early September
Futures contracts for WTI priced in Cushing, Oklahoma, dipped over the first few weeks of September as market confidence in the pace of demand recovery eroded (Chart 2). Factors contributing to the softening of crude futures include data pointing to a decline in Chinese crude imports, a decrease in official selling prices from Saudi Arabia and the United Arab Emirates, increases in COVID-19 cases (particularly in Europe, India and Latin America) and downward revisions to major agency forecasts for oil demand. Oil prices are famously difficult to forecast, but the forward curve suggests oil markets do not expect WTI to rise above early-2020 industry average breakeven prices for drilling new wells at any point though the end of 2022.
Consumption
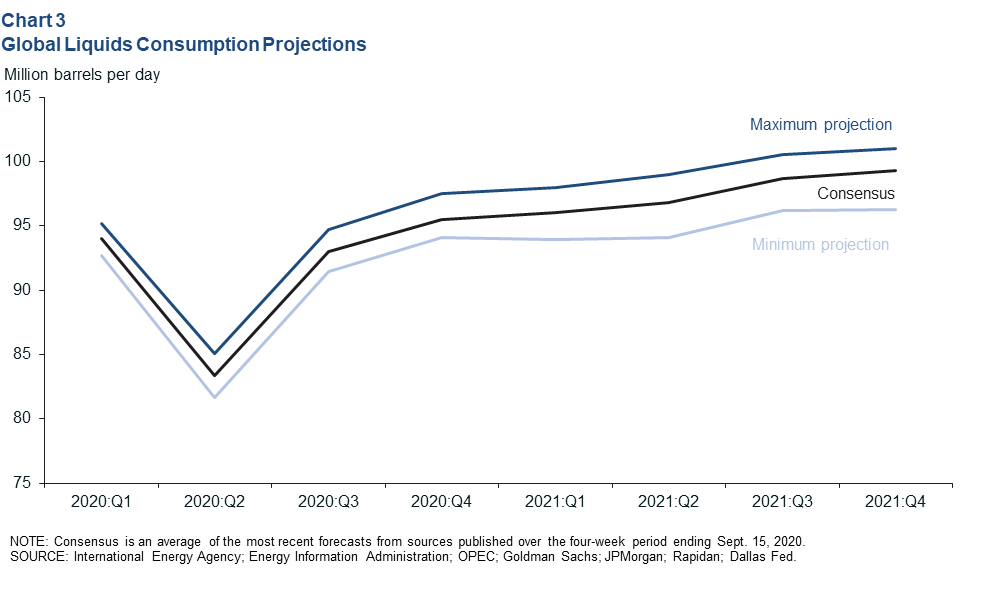
Global projections vary for path of demand recovery
Global consumption of oil (crude oil, condensates and natural gas liquids like propane) should be approaching 93 million barrels per day (mb/d) in third quarter 2020 based on a consensus of estimates from several entities the past few weeks (Chart 3). That is an increase of nearly 10 mb/d from the second quarter. Oil consumption is then projected to rise through 2021 to 96.3 mb/d at the low end and 101 mb/d at the high end of forecasts. The uncertainty in any of these projections is very high as the path of recovery will depend on the virus, how individuals and policymakers respond to it and whether medical treatments or vaccines are developed that will enable consumer behavior and energy consumption to normalize.
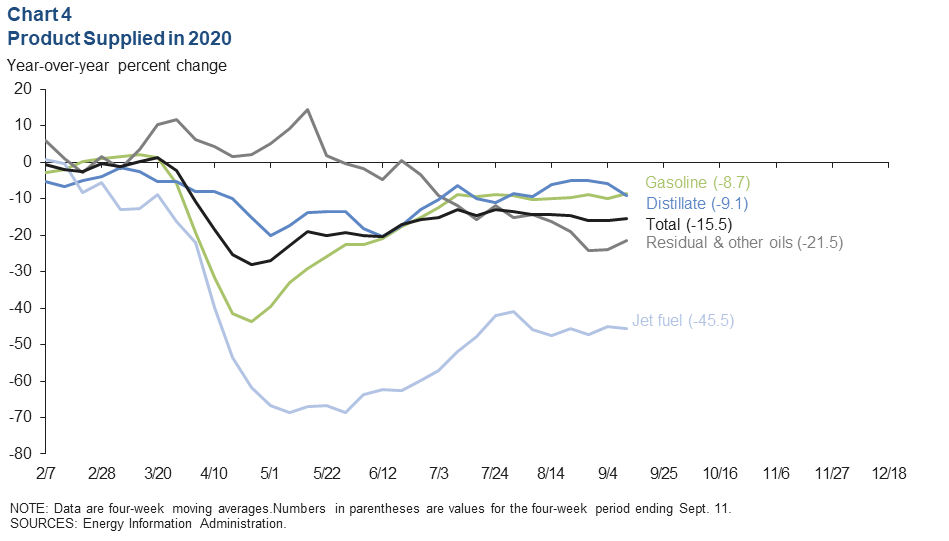
U.S. product supplied plateaus
Weekly estimates indicate that the recovery in U.S. product supplied, a proxy for consumption, stalled in July and August at roughly 15 percent below 2019 levels, owing mainly to weakness in “residual oils” (heavy oils like marine bunker fuels) and “other oils” (such as petrochemical feedstocks, asphalts, petroleum coke and engine lubricants) (Chart 4). Hurricane Laura likely impacted the latter as it forced the shutdown of refineries, petrochemical plants and shipping traffic.
Employment
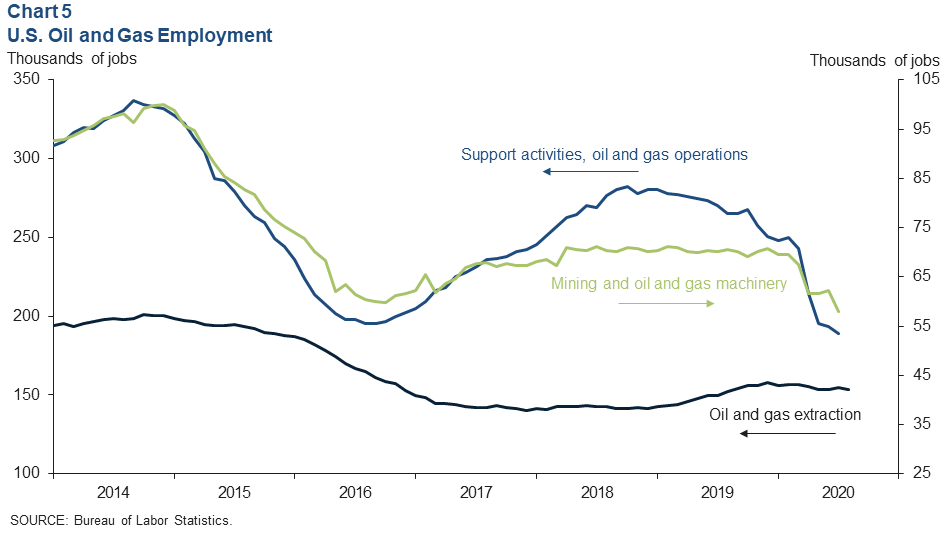
The number of U.S. oil and gas payroll jobs continued to fall in July and August, albeit at a slower pace than at the start of the pandemic. Most of the decline hit support activities for oil and gas operations (mostly oilfield services), which dropped by 60,700 jobs from February to July, and mining and oil and gas machinery manufacturing, which lost 11,700 over that same period (Chart 5). Oil and gas extraction jobs (mostly at exploration and production firms)—which tend to lag behind fluctuations in oilfield activity—dropped by 2,900 through August. Together, payrolls have dropped nearly 16 percent so far, with more losses likely on the way.
Bankruptcy activity
Firms continue to fail
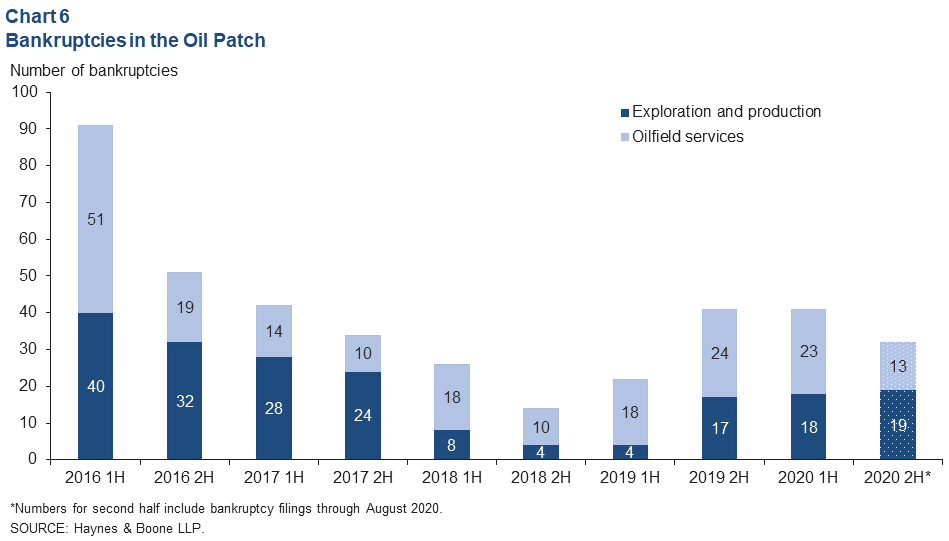
Nineteen exploration and production firms filed for bankruptcy in July and August, and 13 were filed by oilfield services firms (Chart 6). Those filings bring the year-to-date count to 73, on pace to be the worst year for bankruptcies since 2016. Many more bankruptcies are expected through the end of 2021, according to analyses by groups like Rystad and comments from industry contacts.
Improved credit spreads still point to distress
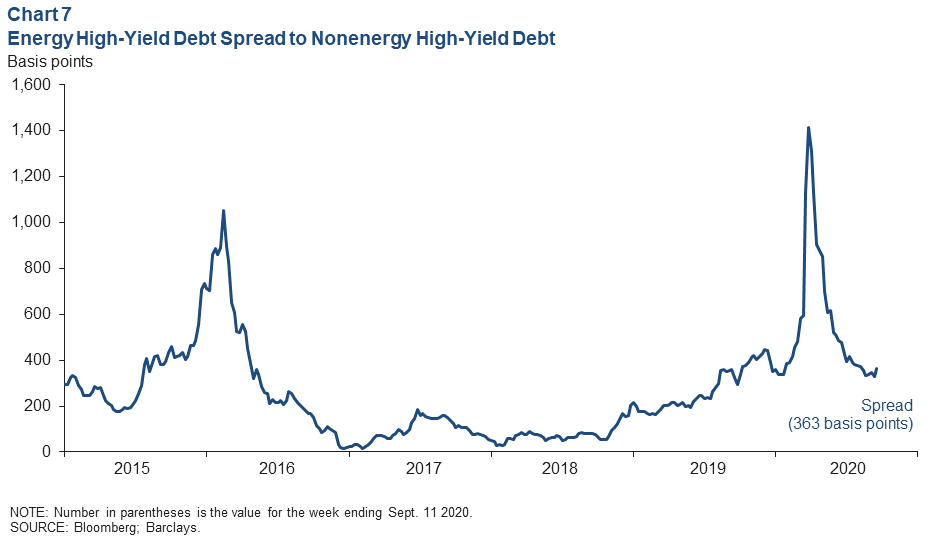
High-yield bond market investors have demanded smaller and smaller premiums from oil and gas firms over the summer relative to all other high-yield corporate bonds. After peaking near 1,416 basis points the week ending March 20, that premium fell as low as 330 basis points the week of Sept. 4. Spreads ticked up again to 363 basis points the following week as confidence in the global demand recovery faltered (Chart 7). While much improved, this is still suggestive of significant default risk and likely portends more bankruptcies ahead. For reference, from January 2013 through December 2014, the average weekly spread between energy high-yield corporate bonds and nonenergy high-yield bonds was just shy of 11 basis points.
About Energy Indicators
Questions can be addressed to Jesse Thompson at jesse.thompson@dal.frb.org. Energy Indicators is released monthly and can be received by signing up for an email alert. For additional energy-related research, please visit the Dallas Fed’s energy home page.