Energy Indicators

August 16, 2021
Energy sector stock market returns have outperformed the S&P 500 this year despite some easing over the summer. Refiner stocks lagged behind, but U.S. refiners have been processing more oil than at any point since the start of the pandemic amid recovering demand. Increases in U.S. and global consumption, rising oil prices and elevated regulatory costs pushed the retail price of motor fuel higher. Looking ahead, consumption growth of approximately 6.2 million barrels per day (mb/d) is expected over the six quarters ending in 2022, but there is significant uncertainty regarding the potential impact of the COVID-19 Delta variant on demand over the next few months.
S&P industry returns
Increases in drilling and completion activity have been relatively muted given the run-up in oil prices in 2021. Firms have prioritized investor returns, deleveraging, and merger and acquisition activity over production growth. This “capital discipline” on the heels of the pandemic oil bust and a pair of bankruptcy cycles from 2015 to 2016 and in 2020 have helped transform the energy sector from one of the worst performing in the S&P 500 this past decade into the best performing year to date in 2021.
Exploration and production firms in the S&P 1500 were up 83 percent year to date as of early August (Chart 1). Integrated refiners that own assets throughout all stages of the petroleum supply chain were up 59 percent. By comparison, the S&P 500 aggregate index increased 34 percent. Refining and marketing—up 30 percent—and equipment and services—up 22 percent—trailed the group.
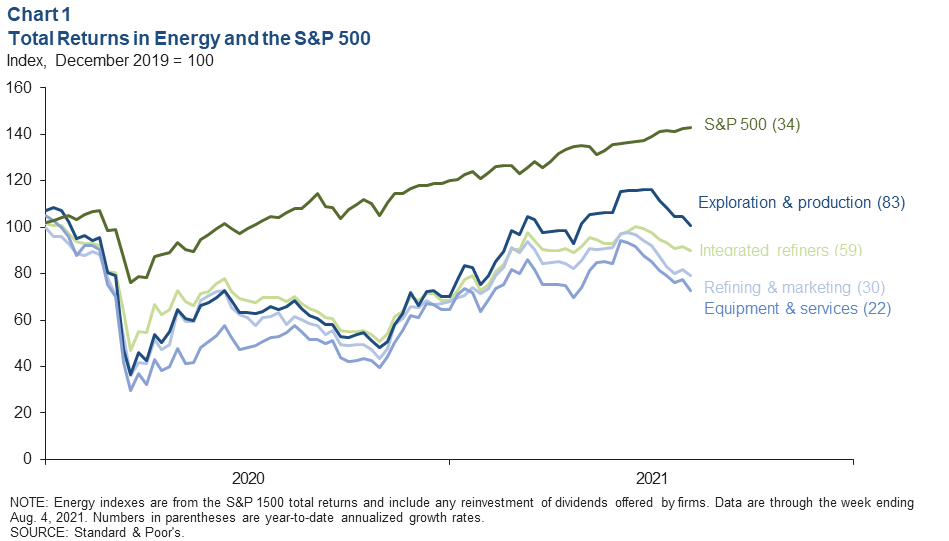
However, total returns for publicly traded energy companies eased in midsummer as rising global outbreaks of the Delta variant, a strengthening dollar and the promise of increasing OPEC+ production weighed on expectations for oil prices and sector earnings.
Refinery runs
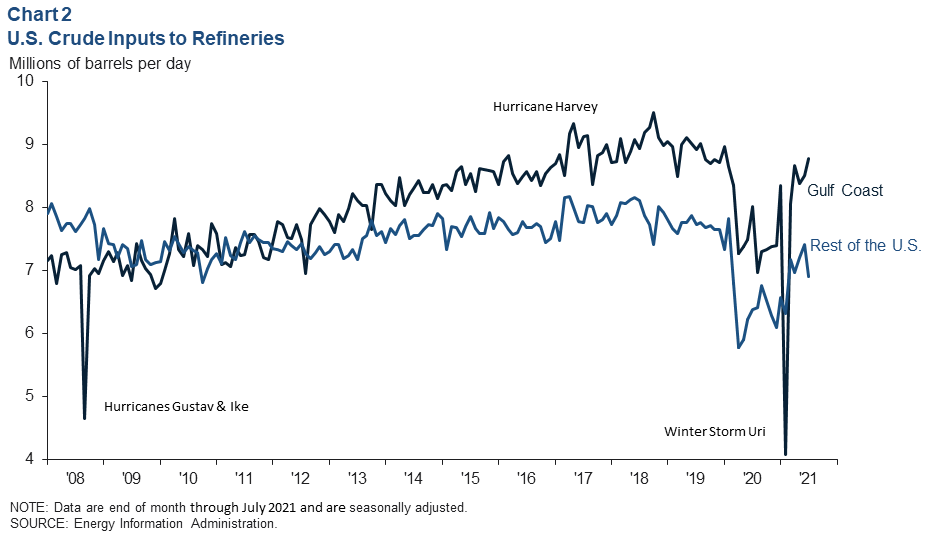
The volume of crude oil processed by Gulf Coast refiners recovered to an average of nearly 8.8 mb/d in July, or 98.3 percent of July 2019 levels. Refineries in the rest of the U.S. processed 6.9 mb/d, or 89.2 percent of July 2019 volumes (Chart 2).
U.S. consumption
Total petroleum product supplied—a proxy for U.S. consumption of refined products—was down 4.6 percent over the four weeks ending Aug. 6 when compared with the same period in 2019 (Chart 3). Distillate consumption was also off by 1.6 percent, while gasoline, residual and other oils fared slightly worse. Jet fuel consumption was off by 21 percent compared with 2019 levels, and it is expected to continue to lag behind the broader recovery in hydrocarbon consumption.
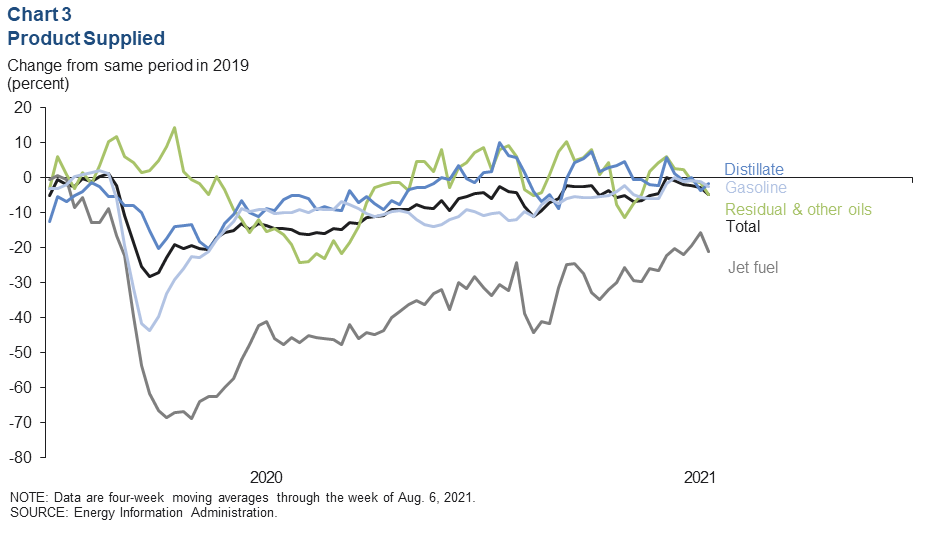
The number of travelers checked in by the Transportation Safety Administration in the U.S. over the seven days ending Aug. 9 was down 21 percent from the same week in 2019. Globally, the number of scheduled commercial flights has eased after climbing to 76 percent of 2019 levels for the first time since March 2020 based on a seven-day moving average. Both proxies for jet fuel demand struggled to improve further over the summer as outbreaks of the Delta variant worsened.
Retail fuel prices
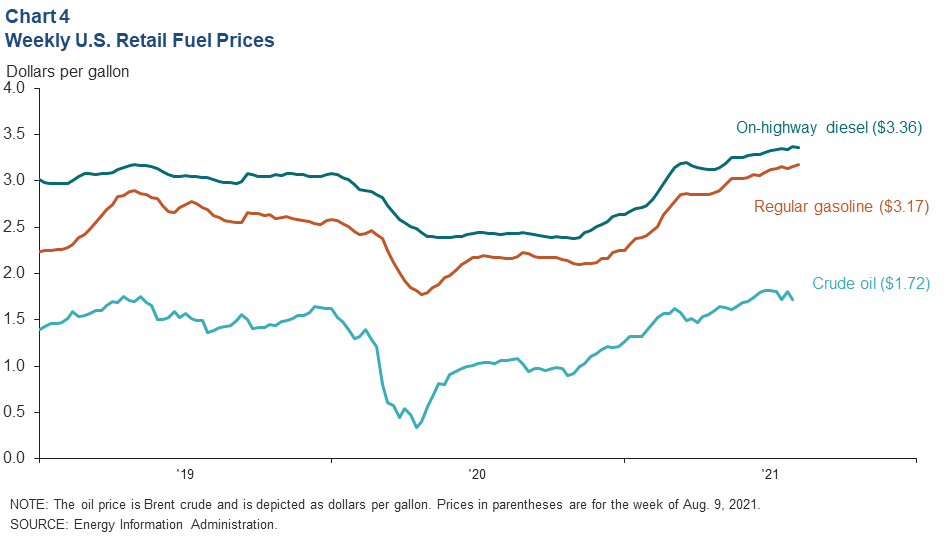
Average weekly retail fuel prices have increased steadily since May 17 amid higher crude costs, tightening inventories of products, recovering domestic demand and increased exports. On-highway diesel reached $3.36 per gallon the week of Aug. 9, and regular gasoline climbed to $3.17 (Chart 4).
Renewable identification numbers (RINs)
Another factor contributing to higher fuel prices has been the soaring cost of complying with biofuel mandates. The price of ethanol RINs rose to $1.67 per gallon on Aug. 6, down from a June high of $1.86 but still up 122.3 percent year to date (Chart 5). Biomass-based diesel RINs were $1.82 on Aug. 6, an increase of over 85 percent this year. This translates into nearly 20 cents extra per gallon of refined product—costs largely passed through to consumers.
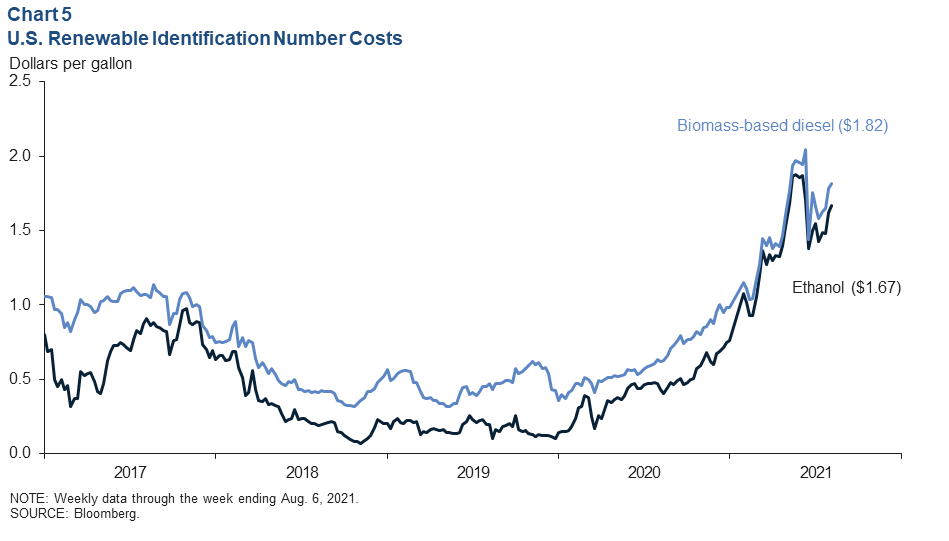
Volatility in RIN pricing over the summer has been driven largely by uncertainty regarding what biofuel mandates are going to be for this year and next. In July 2021, the Environmental Protection Agency was expected to announce new rules for 2021—seven months in—and for 2022. Separately, a pair of Supreme Court rulings resulted in several small refiners being granted exemptions from blending mandates and reinstated restrictions on blending E15—gasoline that is 15 percent ethanol—during the summer. These developments, coupled with a pickup in ethanol production, contributed to a drop in RIN prices from June to early July. However, on July 20, the promised new rules on blending mandates were again delayed to a future date.
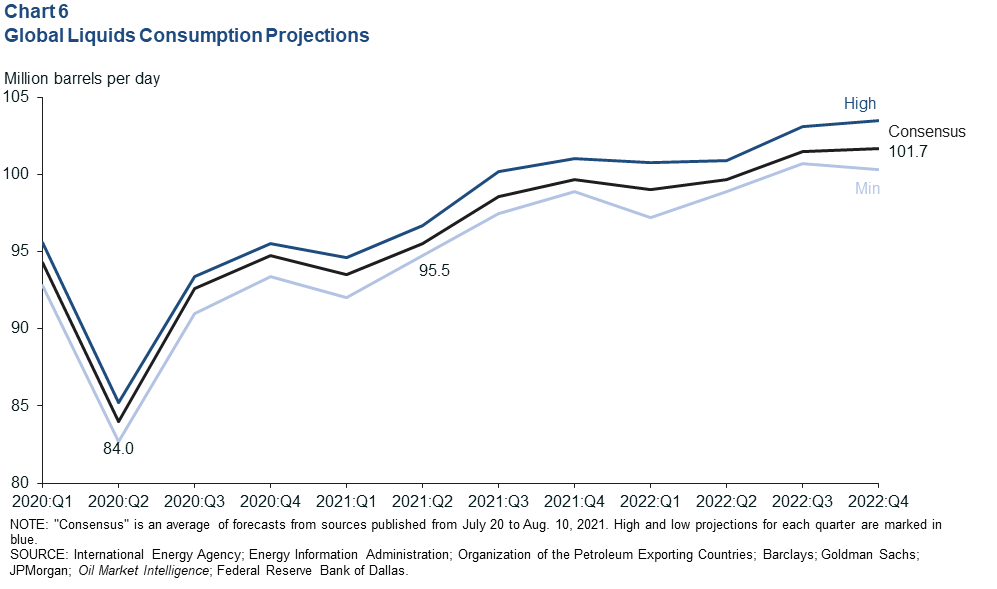
Global consumption
Third quarter 2021 global liquids consumption—crude oil, condensate and natural gas liquids—was projected to be roughly 98.5 mb/d based on an average of several private and agency forecasts from late July. For context, the International Energy Agency estimated in August that second quarter 2021 consumption was 95.5 mb/d. The consensus projection is for 6.2 mb/d of consumption growth by the end of 2022—individual forecasts range from roughly 5.4 mb/d to 7.4 mb/d (Chart 6). The more conservative forecasts in the sample tended to express concerns about the effect of coronavirus variants on the pace of demand recovery. This was particularly true for jet fuel and gasoline.
About Energy Indicators
Questions can be addressed to Jesse Thompson at jesse.thompson@dal.frb.org. Energy Indicators is released monthly and can be received by signing up for an email alert. For additional energy-related research, please visit the Dallas Fed’s energy home page.