Energy Indicators

September 20, 2021
U.S. oil and gas payrolls continued to increase in July. More comprehensive administrative data for March 2021 suggest that payrolls fell much further than initially estimated last year. Oil prices rose in response to recovering demand, limited supply growth and eroding inventories. Natural gas prices increased due to healthy domestic and export demand and disruptions related to Hurricane Ida.
Oil and gas jobs
The combined number of jobs in U.S. oil and gas extraction (mostly exploration and production firms) and support activities for oil and gas operations (mostly oilfield services) rose by 16,400 over the four months ending in July 2021, according to initial estimates (Chart 1). This was driven by support activities industries that are responsible for operating drilling rigs, hydraulic fracturing equipment and logistical services.
However, a preliminary estimate of revisions to national payroll data for March 2021—to be finalized in February 2022—indicates that payrolls in the mining and logging sector were overestimated by 12 percent, or 63,000 jobs. This would change the estimated decline in oil and gas payrolls in the February 2020 to March 2021 period from the initial estimate of 61,000 jobs to as much as 124,000, depending on how the losses are allocated across oil and gas, logging, coal, and other mineral extraction industries. Oil and gas extraction and support activities for oil and gas operations accounted for over half of U.S. mining and logging jobs in 2020.
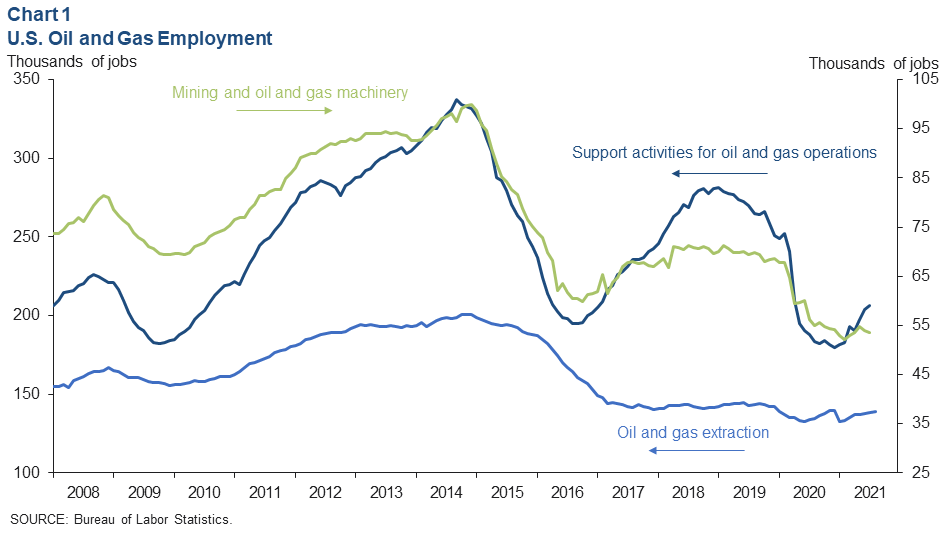
Separately, mining and oil and gas machinery manufacturing jobs have ticked up modestly in 2021 but may also see significant revisions in the coming year. Beset by an overabundance of idle equipment, new orders for drilling rigs, remanufacturing of equipment and other oilfield machinery have been limited. An exception to this has been energy-efficiency-enhancing and emissions-reducing purchases such as hydraulic fracturing equipment that is powered by electricity from the grid, according to Dallas Fed survey comments, Beige Book respondents and industry contacts.
Oil prices
Crude prices ticked up from August to the first half of September 2021. Brent crude averaged $73, while coastal Houston and West Texas Intermediate (WTI), priced in Midland, Texas, averaged $70 (Chart 2).
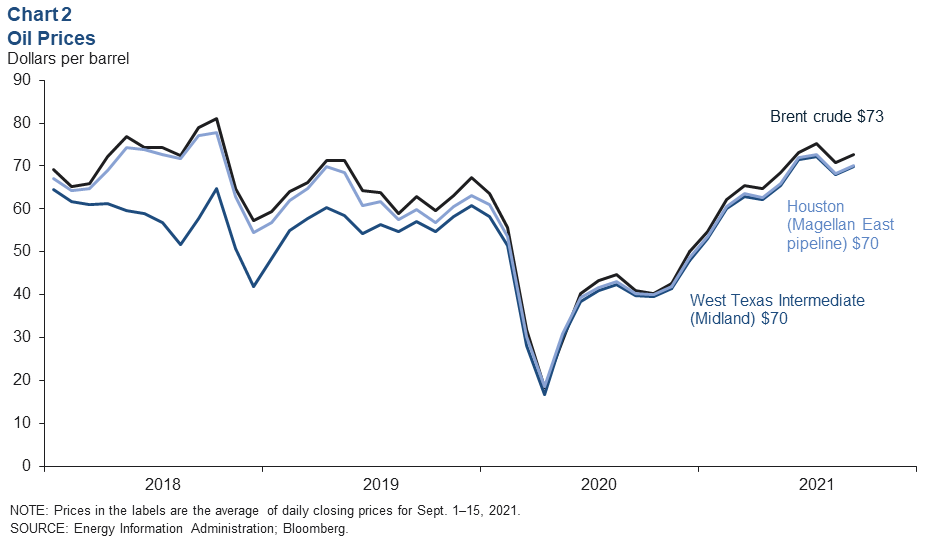
Hurricane Ida, which made landfall Near New Orleans, Louisiana, on Aug. 29, shut in as much as 1.8 million barrels per day (mb/d) of U.S. offshore crude oil production. However, similar volumes of crude oil demand from refineries were also shut down, and the U.S. government released volumes of comparable crude from the strategic petroleum reserve, muting the overall impact on prices. As of Sept. 16, 2021, the volumes of shut-in crude oil production due to the hurricane had fallen to less than 0.5 mb/d.
Days of supply
Seasonally adjusted days of supply—estimated commercial inventories divided by weekly consumption estimates—for distillate, gasoline and crude oil were below their five-year average levels at the end of August. Distillate had slipped to 33 days of supply after increasing the prior three months (Chart 3). Gasoline and crude supplies have been trending down since early 2021 and fell to 24.4 days and 26.5 days, respectively.
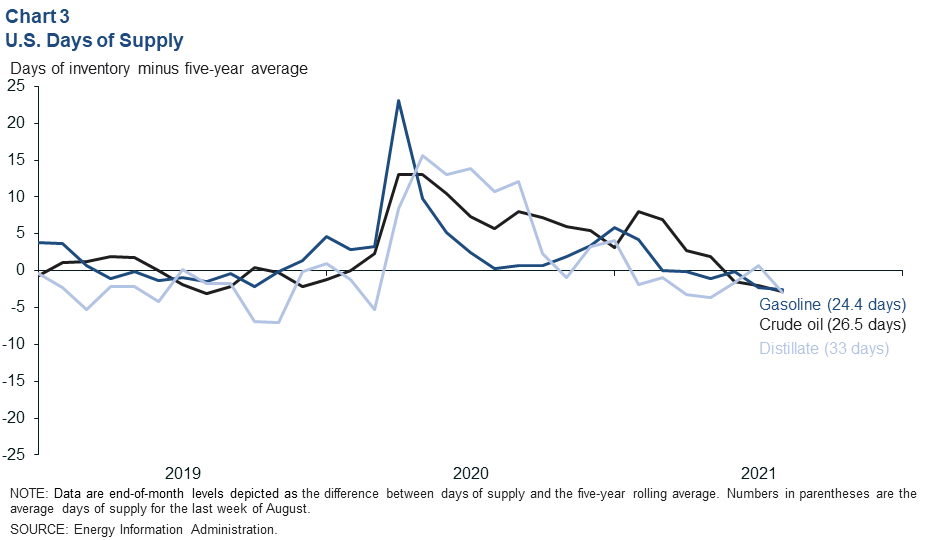
Over the first two weeks of September, gasoline stocks fell by nearly 9.1 million barrels (648 kb/d)—on par with changes associated with Hurricanes Laura and Harvey but less than half the impact of Winter Storm Uri earlier this year. Weekly distillate and crude inventories also logged further declines.
Natural gas prices
Benchmark natural gas priced at Henry Hub in Louisiana averaged $4.76 in the first half of September (Chart 4). At 2.9 trillion cubic feet, the volume of natural gas in storage as of Sept. 3 trailed normal seasonal increases—a three-year low on a seasonally adjusted basis. This is due to modest associated gas production from shale oil regions, infrastructure constraints in gas-rich Appalachian shale gas basins, and rising liquefied natural gas (LNG) exports.
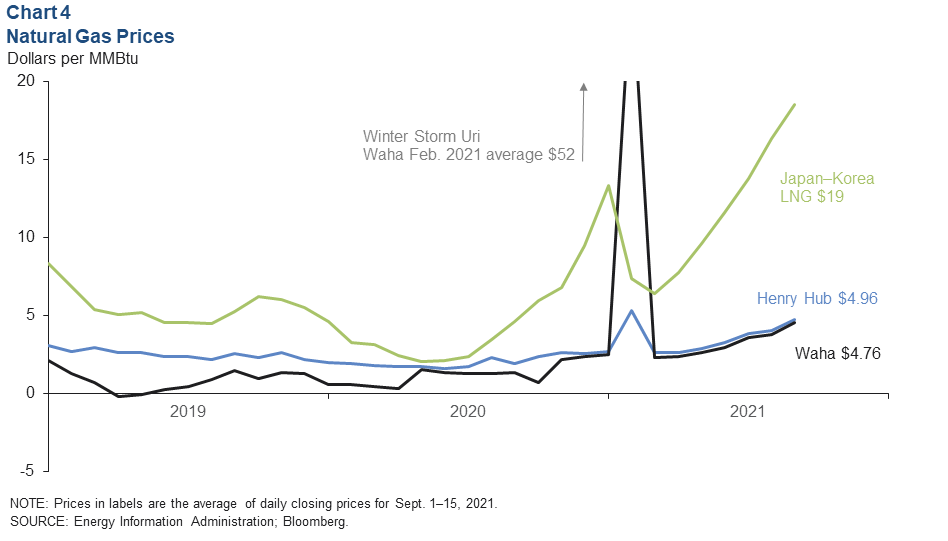
Production shut-ins of as much as 2.1 million cubic feet per day (MMcf/d) from Hurricane Ida tightened the market further. Natural gas prices closed at $5.40 on Sept. 15, and futures prices for January 2022 rose to $5.68. If realized, that would be the highest monthly natural gas price since February 2014. By Sept. 16, the daily production of natural gas that was shut in had fallen to less than 0.8 MMcf/d.
The Japan–Korea LNG marker averaged a stunning $18.54 in the first half of September—over $107 on a barrel-of-oil-equivalent basis to WTI. European benchmark Dutch TTF gas rose as high as $22.80 on Sept. 15—a 13-year high. Higher hub prices in Louisiana are contributing to the global price surge, but so are strong industrial and electric utility demand in Asia, Europe and Brazil and limited supply increases from Russia—pending the start of the Nord Stream 2 Pipeline between Russia and Germany.
About Energy Indicators
Questions can be addressed to Jesse Thompson at jesse.thompson@dal.frb.org. Energy Indicators is released monthly and can be received by signing up for an email alert. For additional energy-related research, please visit the Dallas Fed’s energy home page.