Energy Indicators

November 2, 2022
Oil prices have eased from summer highs but remained elevated in October. Rising oilfield costs, labor shortages and supply-chain delays are limiting the capacity to grow, and drilling activity has leveled off. Nonetheless, industry employment is rising. Taken together, a consensus of projections for U.S. oil production from major agencies, banks and consultancies compiled by the Dallas Fed predicts modest and steady production growth through 2023.
Oil prices rased but oilfield costs rising
West Texas Intermediate (WTI) has come down from $114 per barrel in June 2022 to $87 at the end of October. The industry is experiencing significant cost pressures from labor, steel tubing, sand and chemicals, and long lead times for new equipment and machinery. In the most recent Energy Survey from the Federal Reserve Bank of Dallas, finding and development costs for energy and production (E&P) companies logged an index score of 64.7, with lease operating expenses having a score of 70.2. Input cost pressures for oilfield services firms were more than double year-ago levels and prior historical highs. All measures imply that cost increases are being experienced broadly across the industry.
Industry contacts indicate that year-to-year cost inflation was over 20 percent in recent months. Similarly, the Producer Price Index for drilling and oilfield services—which had risen nearly continuously in 2022—was up 18.5 percent in September (Chart 1). That is much higher than the 12-month personal consumption expenditures inflation index growth of 6.2 percent in August, or the 8.2 percent Consumer Price Index growth in September. Taken together, this implies industry-wide breakevens have risen from the mid-to-low $50s in 2021 to the mid-to-high $60s in 2022.
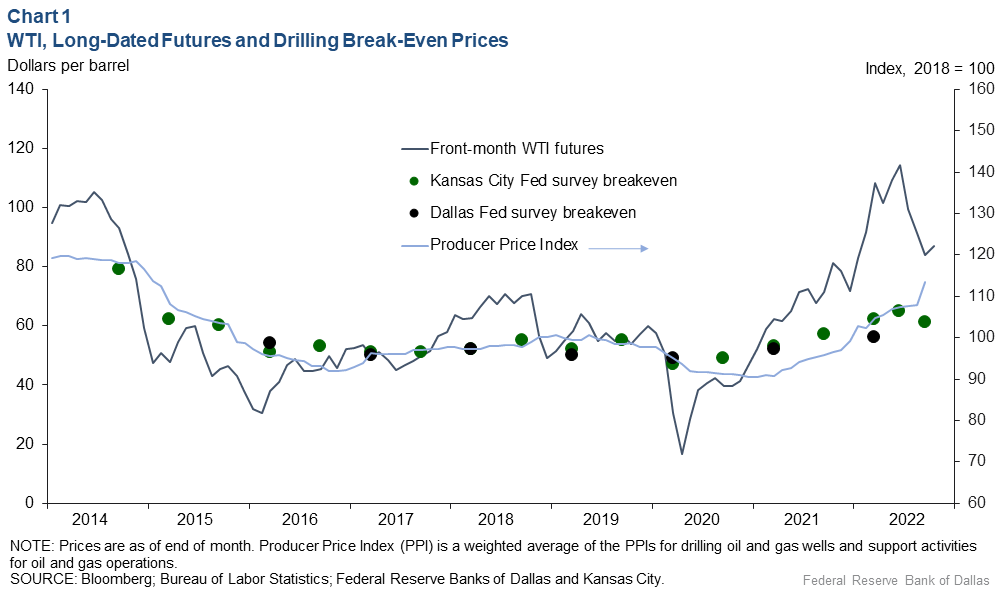
However, while survey measures of break-even costs from the Dallas Fed Energy Survey and the Kansas City Fed have trended up in 2022 as well, the cost inflation reported by the survey samples has been more muted. The October Kansas City Fed survey reported a $61 average break-even price across respondents, a 7 percent increase from the same period in 2021.
The discrepancies between these measures may be due in part to sampling issues and the timing of contract turnover, which can make realized industry cost inflation among firms lumpy and lagged. Most industry contacts view double-digit cost inflation as likely to extend into 2023. In any case, industry break-even costs have risen precipitously. This does not account for the push by firms to allocate larger shares of revenue to debt reduction and investor returns.
Oil and gas equities outperform in 2022
The emphasis placed on investor returns is paying off. Inflation-adjusted total returns to oil and gas segments of the S&P 1500 (which includes the reinvestment of dividends) have had outstanding growth in 2022 as high energy prices and constrained spending drove increased returns for much of the industry (Chart 2). Year to date, total real returns for integrated refiners (firms that both produce oil and refine it) were up 65 percent the week of Oct. 26, 2022. Independent E&P firms' returns were up 61 percent, and refining and marketing was up 59 percent. Oilfield equipment and services firms grew 48 percent. In stark contrast, the benchmark S&P 500 index was down 23 percent.
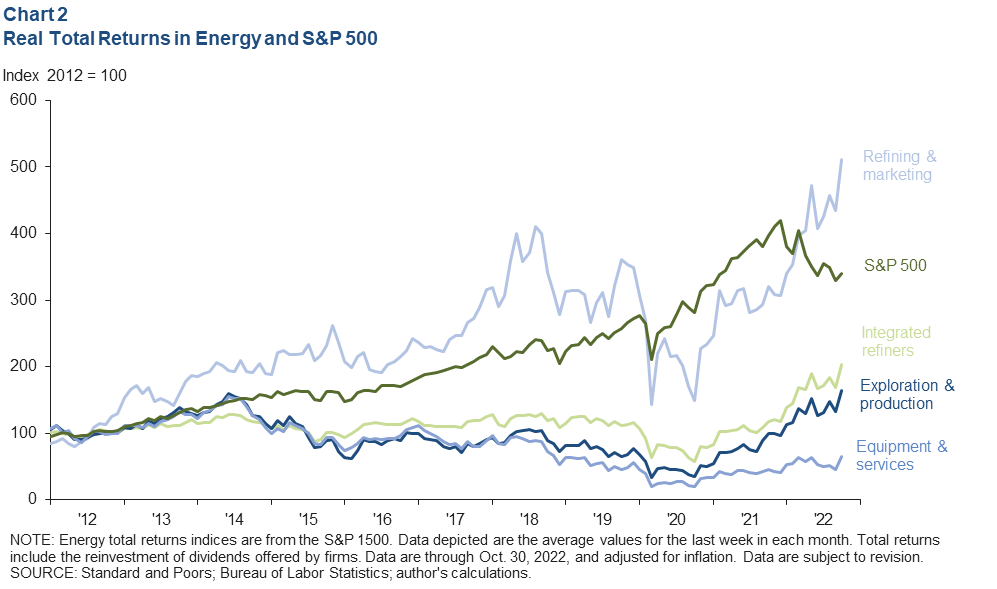
Even with stellar financial performance in 2022, among oil-and-gas-producing sectors, only the integrated refiners’ index has recovered from the 2015–16 oil bust with a real total return of 39.6 percent over that time. Real returns for E&Ps are still down 6 percent from prebust highs, while equipment and services total returns remain down 62 percent. An investor in the S&P 500 over the past eight years would have earned a real return of nearly 86 percent.
Global drilling recovering but still below prepandemic levels in much of world
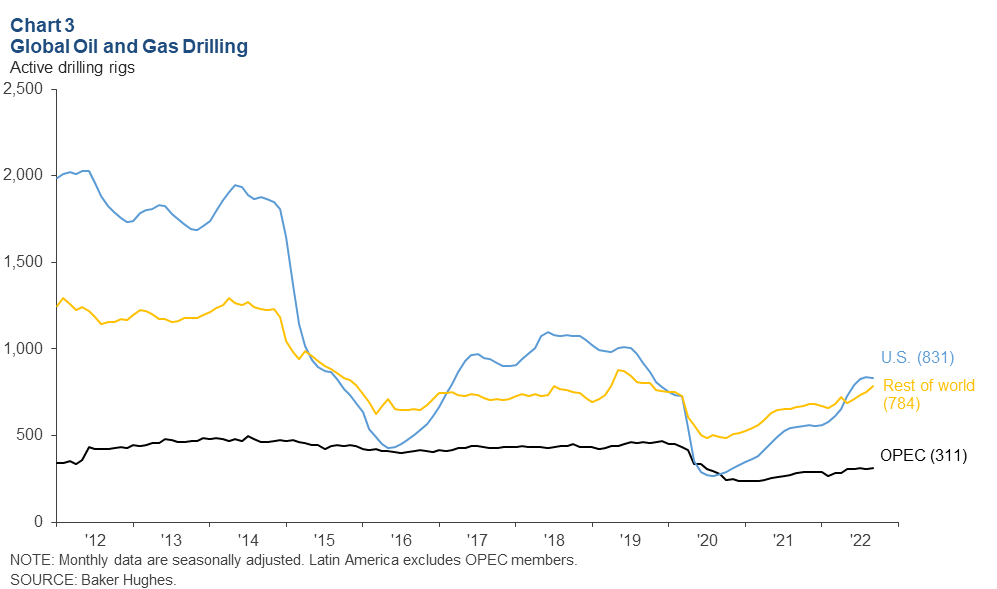
Seasonally adjusted monthly rig activity in the U.S. has risen by 274 this year to 831 rigs in September (Chart 3). That’s still 12 percent below the 2019 average. OPEC member countries saw rig counts rise by 21 to 311 rigs, 31 percent below 2019. Drilling activity in the rest of the world increased by a net 105 rigs to 784, on par with 2019. That increase was led by Canada, which added 78, and Latin America (excluding OPEC), which added 39 rigs.
U.S. industry payrolls expand; machinery manufacturing joins recovery
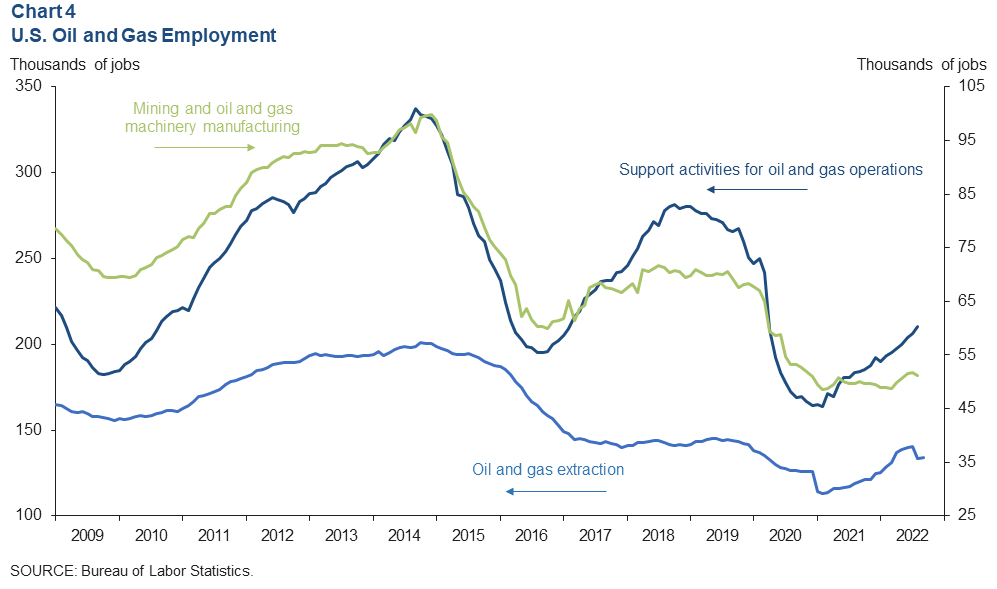
With the rise in activity, U.S. sector employment is growing. Support activities for the oil and gas operations (mostly oilfield services) sector added 18,000 jobs from December 2021 to August 2022—the most recent data available. Oil and gas extraction (mostly E&P companies) added 8,800 jobs (Chart 4). Combined, extraction and services employment were still 11 percent below prepandemic levels in August.
The pace of employment growth is likely to slow given that drilling has leveled off since the summer. However, firms still reported employment shortages and significant pressure to raise wages to attract talent in the recent Dallas Fed Texas Business Outlook and Energy surveys.
In the meantime, oilfield activity the past two years has chewed through the inventories of equipment that were left over from the collapse in drilling and completion during the pandemic. This has spurred the need for new orders such as rigs, frac fleets, parts and machine tools to produce new equipment. Mining and oil and gas machinery employment finally began recovering in earnest in April 2022, with the sector adding 1,600 jobs year to date. However, employment remains 24 percent below prepandemic levels. Lead times for new parts, equipment and machine-tool orders have increased to more than a year in many cases at nearly every stage of the oilfield supply chain.
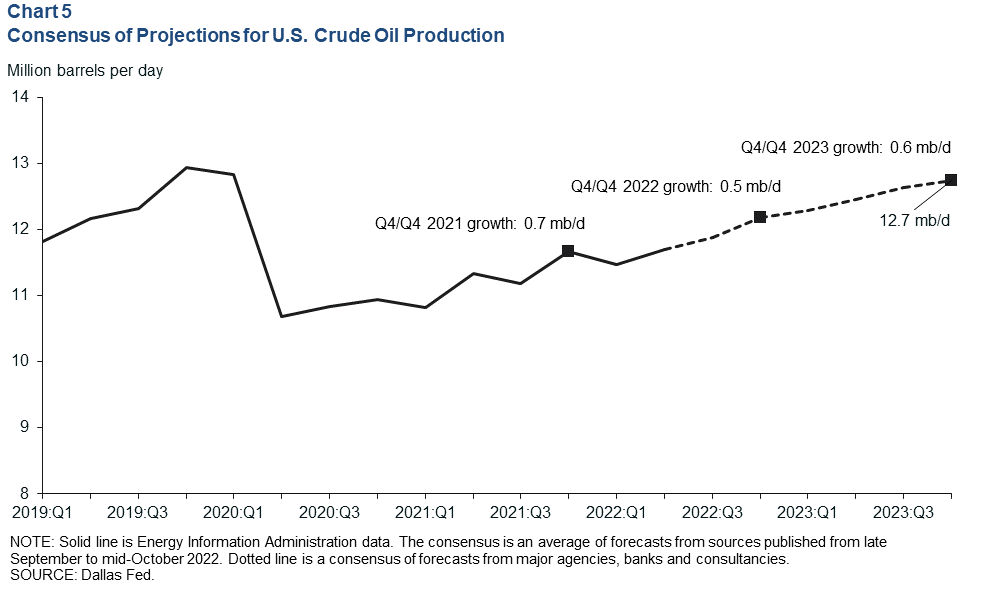
U.S. production to grow modestly through 2023
The consensus outlook for U.S. crude production growth in 2022 has changed little since the beginning of the year. Crude oil output is projected to rise 0.5 million barrels per day (mb/d) from fourth quarter 2021 to fourth quarter 2022, ending the year at 12.7 mb/d (Chart 5). The challenge of growing production amid tight labor markets, rising costs and extended lead times for new equipment orders was already becoming apparent, though not as acutely as now. Looking ahead to 2023, the consensus again sees nearly 0.6 mb/d of U.S. production growth from fourth quarter 2022 to fourth quarter 2023. The drop in oil prices over the past four months, the U.S. monetary tightening, softening economic data out of China and a likely recession in Europe have all soured expectations for what U.S. producers will be able to achieve over the next year.
About Energy Indicators
Questions can be addressed to Jesse Thompson at jesse.thompson@dal.frb.org. Energy Indicators is released monthly and can be received by signing up for an email alert. For additional energy-related research, please visit the Dallas Fed’s energy home page.