Energy Indicators

February 16, 2023
Natural gas prices have plunged since the start of the year. An unusually warm winter in both the United States and Europe kept demand low during the heating season, and European countries were able to import sufficient amounts of non-Russian gas to forestall a winter energy crisis. Natural gas storage levels in the bloc are now robust and prices have fallen dramatically.
European natural gas
Europe forced to look elsewhere for gas
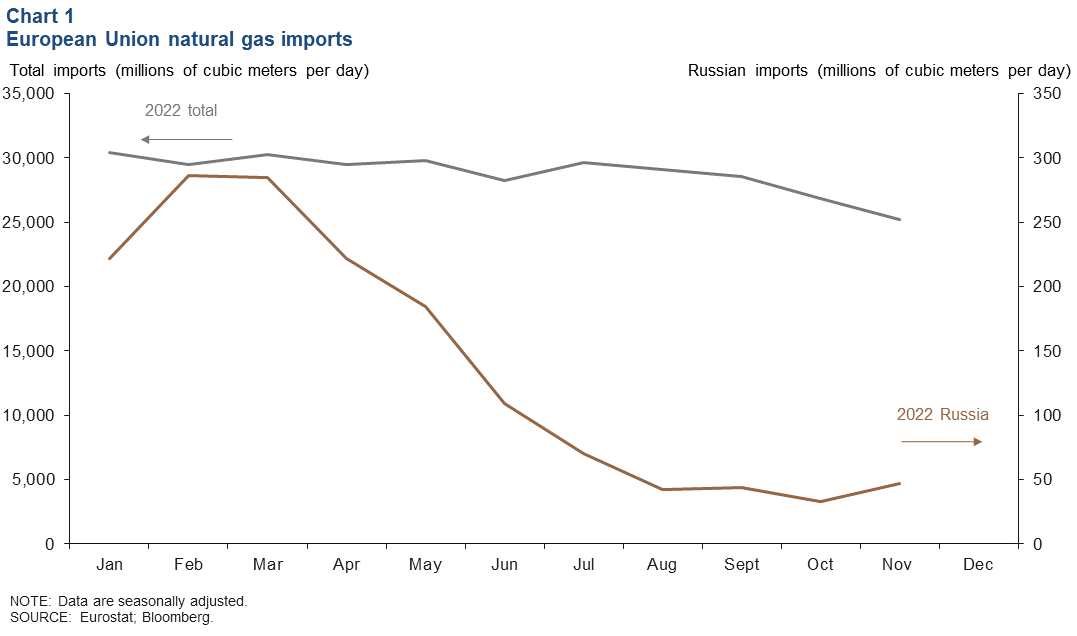
Imports of Russian natural gas to the European Union have plummeted from 97 percent of total natural gas imports in February 2022 to just 18 percent in November (Chart 1). Russia stopped supplying natural gas through the Nord Stream (via Germany) and Yamal (via Poland) pipelines after western leaders opposed its invasion of Ukraine.
Consequently, the European Union was forced to source natural gas at a premium from other places; between January and November 2022, 25 percent of flows came from Norway and 12 percent came from Algeria. Liquefied natural gas (LNG) from the United States, Qatar and Nigeria made up another 26 percent of natural gas imports. In 2019, LNG made up only 15 percent of European gas imports.
European inventories prove resilient amid mild winter
An unseasonably warm winter, a bump in LNG imports and curtailed industrial demand helped leave European gas inventories for the start of 2023 on par with levels over the same time in 2020—which is above the five-year average fill level. Headed into last winter, European countries were worried cold temperatures and China’s potential economic reopening would lead to shortages, but neither threat materialized. Total inventories reached 81 billion cubic meters (bcm), or 72 percent full, by Feb. 2 (Chart 2).
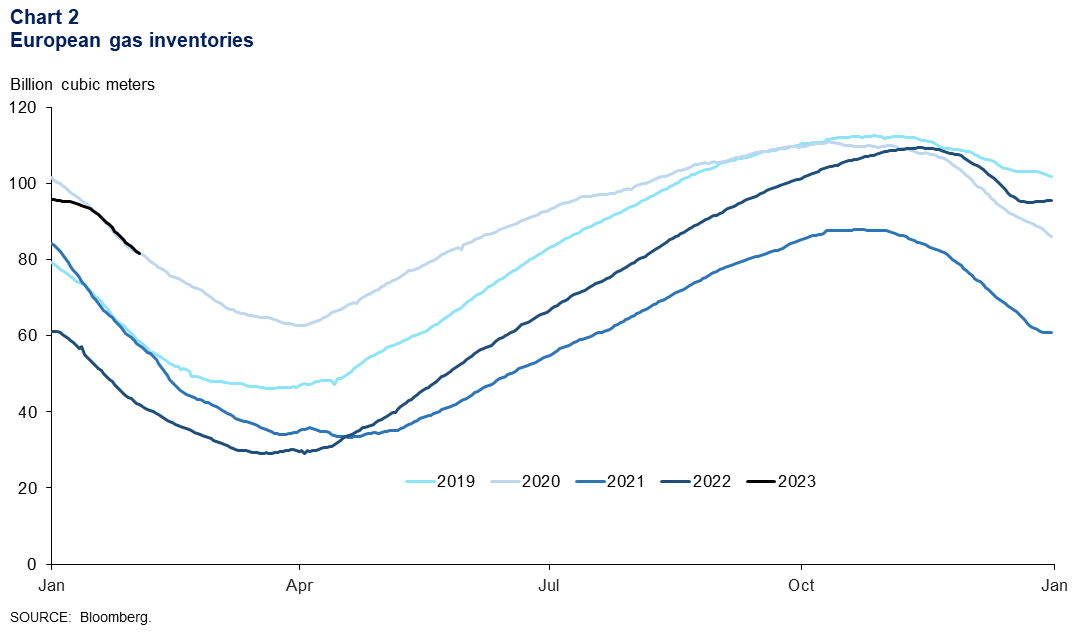
EU regulations stipulated that at least 80 percent of the bloc’s underground gas storage facilities had to be filled before the winter of 2022–23; the facilities ended October 2022 at 95 percent full. Regulations for winter 2023–24 will require the facility to be 90 percent full, a feat analysts predict won’t be easy without steps to further structurally reduce gas demand.
Europe’s amply filled storage facilities have spillover effects for the LNG market in the United States. U.S. LNG exporters could face a more competitive market in Europe as high storage levels dampen the EU’s urgent need for American supplies, putting downward pressure on prices.
Natural gas prices
Europe’s benchmark gas price fell 79 percent from its high in August, aided by warm weather, curtailed demand and resilient imports. The Asian LNG price has followed a trend similar to the European benchmark. The Japanese–Korean gas price is down 27 percent year over year and dropped 73 percent from its high in August (Chart 3).
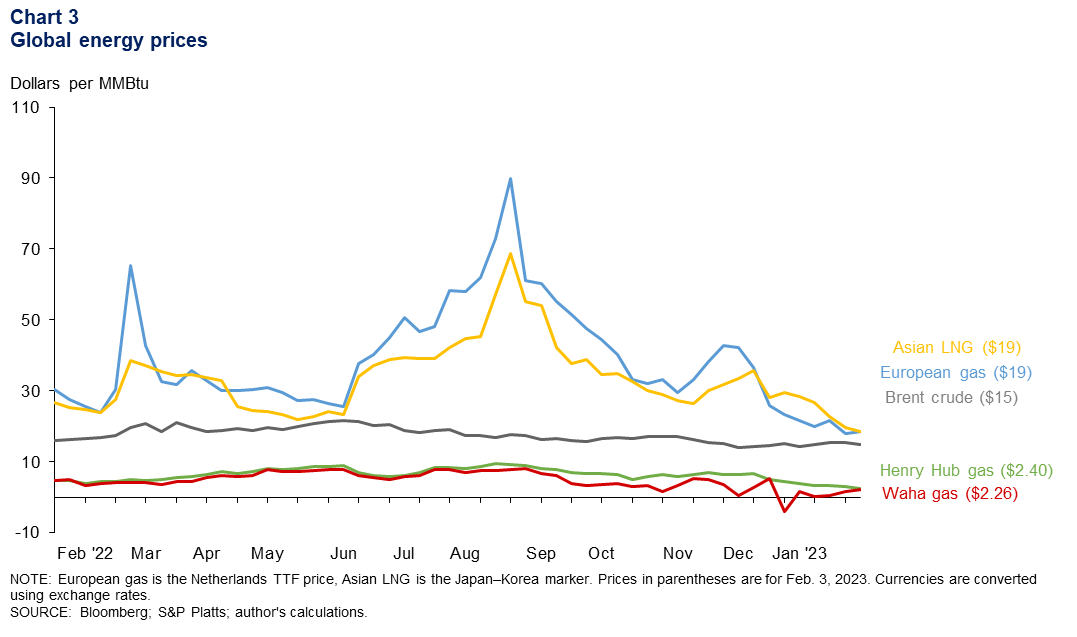
After an early freeze in Texas boosted local prices in late December, takeaway capacity constraints due to pipeline shortages pushed West Texas Waha natural gas, which is priced in the Permian Basin, down to negative $3.92 during the week ending Dec. 30, 2022. In contrast, the national benchmark Henry Hub, which is priced in Louisiana, was $4.48 that week. Waha rebounded to $2.26 for the week ending Feb. 3—still 5 percent below pre-Ukraine-war levels.
U.S. natural gas
Gas drilling stable, but future uncertain
Strong oil production in 2022 helped fuel robust output of associated natural gas (gas produced from oil wells), but the gas drilling outlook for 2023 may be hampered by falling natural gas prices. The rig count for Haynesville, Appalachia and other gas regions totaled 160 for January 2023, compared with 156 for December 2022 (Chart 4).
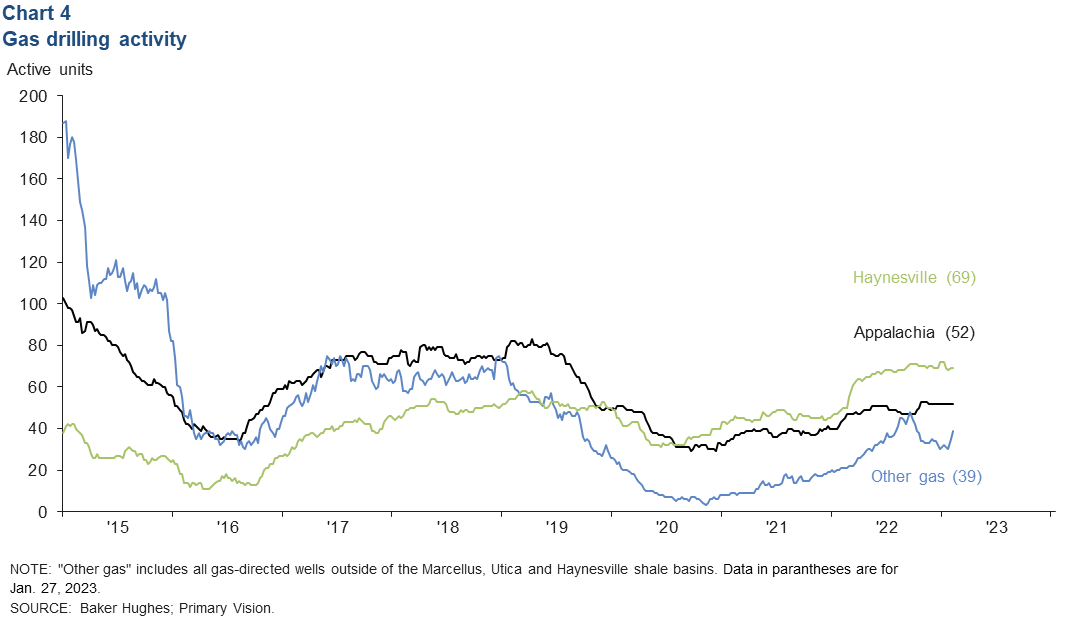
The rig counts for Appalachia and Haynesville have been steady at 52 and 69, respectively, since November. Further, the rig count for the two basins has been rising since mid-2020, going from 69 in June 2020 to 121 in January 2023 and rising 33 percent from the start of 2022.
In the fourth-quarter Dallas Fed Energy Survey, oil and gas firms reported that supply-chain issues and rig availability were still obstacles to increased production. In the Permian Basin, they noted that natural gas pipeline capacity limits may constrain oil production growth by year end.
Production sees strong growth in 2022
Gas production in the Appalachia and Haynesville basins together rose 2 percent year over year to 51.1 billion cubic feet per day (bcf/d) in November 2022 (Chart 5). That is 11 percent above prepandemic levels. The increase was due in part to high prices aided by robust export growth.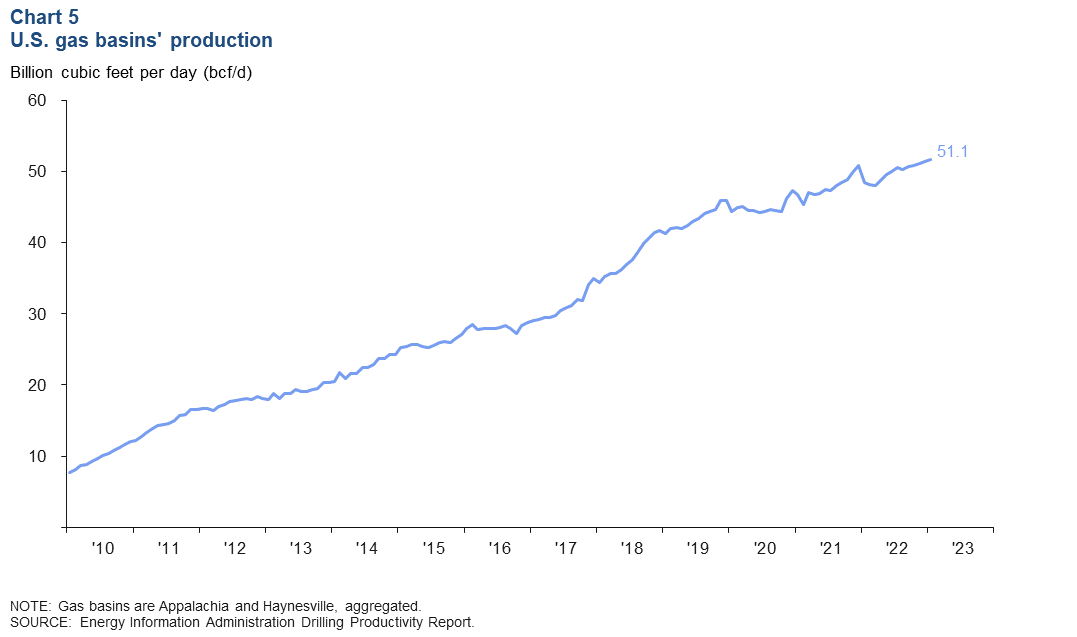
Total U.S. natural gas production was 110 bcf/d in November 2022, with the Appalachia basin accounting for 32 percent of the production and the Haynesville accounting for 15 percent.
Exploration and production firms are broadly expected to maintain current capital spending in the Appalachia basin but increase spending in the Haynesville Shale because the latter is not constrained for pipelines and has easy access to both LNG exporters and industrial consumers on the Gulf Coast. However, recent weakness in natural gas pricing may dampen those projections.
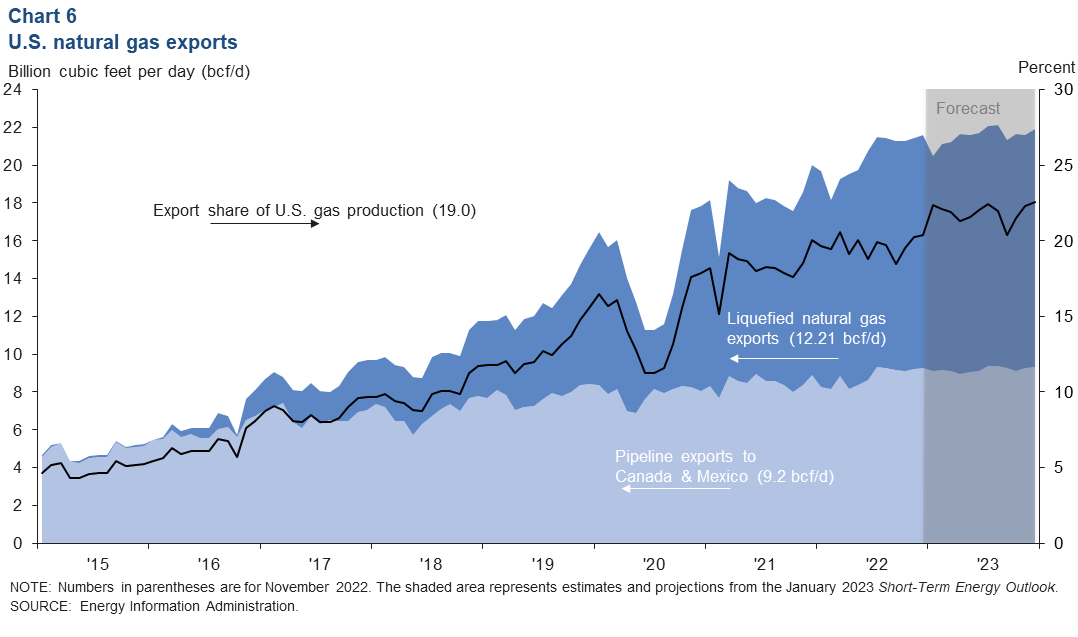
U.S. share of natural gas exports projected to rise slightly by year-end
Total marketed production of natural gas is projected by the Energy Information Administration (EIA) to be flat this year, with supplies increasing 0.2 percent (0.3 bcf/d) from November 2022 to December 2023. Seasonally adjusted LNG exports and pipeline exports stood at 12.21 bcf/d and 9.2 bcf/d, respectively, in November 2022. If the EIA’s projections are realized, the export share of U.S. supplies will rise from 19 percent in November 2022 to 20.4 percent in December 2023 (Chart 6).
As of November 2022, peak capacity for LNG exports in the U.S. was 14 bcf/d. That is expected to more than double over the next five years. European demand could further facilitate LNG capacity expansion in the U.S., but that would require commitments for long-term contracts, which may run afoul of the EU’s energy transition policies.
Last month, the U.S. Department of Energy approved permits for Sempra Energy, a major North American energy company, to send U.S. natural gas via pipeline to Mexico for re-exportation at LNG terminals. Sempra will now be allowed to export an additional 1.8 bcf per day.
About Energy Indicators
Questions can be addressed to Kenya Schott at kenya.schott@dal.frb.org. Energy Indicators is released monthly and can be received by signing up for an email alert. For additional energy-related research, please visit the Dallas Fed’s energy home page.