Energy Indicators

| Energy dashboard (January 2024) | |||
| WTI price avg. Jan. 22–Jan. 26 |
WTI price change from 4 weeks prior |
Henry Hub price avg. Jan. 22–Jan. 26 |
Henry Hub price change from 4 weeks prior |
| $76/barrel | +3.7% | $2.56/MMBtu | -0.1% |
The U.S. rig count declined in 2023, natural gas prices declined, and oil prices held relatively steady. Large oil and gas exploration and production (E&P) firms are turning their attention to acquiring assets in 2024, while small firms are aiming to grow production. An average of various forecasts shows U.S. crude oil production is expected to increase modestly during the next two years as global oil production and consumption balance in 2024, but the market becomes oversupplied in 2025.
Rigs
The U.S. oil rig count declined 19 percent from December 2022 to October 2023 and was flat from October to early January (Chart 1). Even within the prolific Permian Basin, the number of oil-directed drilling rigs fell 43 to 307 rigs, a 12 percent decline, from December 2022 to October 2023. From early October to January, the Permian only lost 1 rig, a 0.3 percent net decline.
The oil rig count in the Bakken declined 21 percent through October 2023, dropped 29 percent in the natural gas liquids-rich Eagle Ford and fell 31 percent in the rest of the U.S. These three regions saw more noticeable declines over the winter than the Permian experienced. From October to January, the Bakken oil rig count fell 6.3 percent, the Eagle Ford dropped 10.9 percent, and the rest of the U.S. fell 6.8 percent.
Even with steady declines in oil-directed drilling rigs over the year, U.S. oil production growth was robust, rising an estimated 0.99 million barrels per day (mb/d) from fourth quarter 2022 to fourth quarter 2023 according to the Energy Information Administration's Short Term Energy Outlook. Since then weekly estimates point to a decrease of about 0.4 mb/d by late January 2024. This was partly due to a severe winter storm in mid-January that cut production in North Dakota by around 600,000 to 650,000 barrels per day. Most of the net output growth in 2023 came from the Permian Basin, where production rose an estimated 0.4 mb/d.
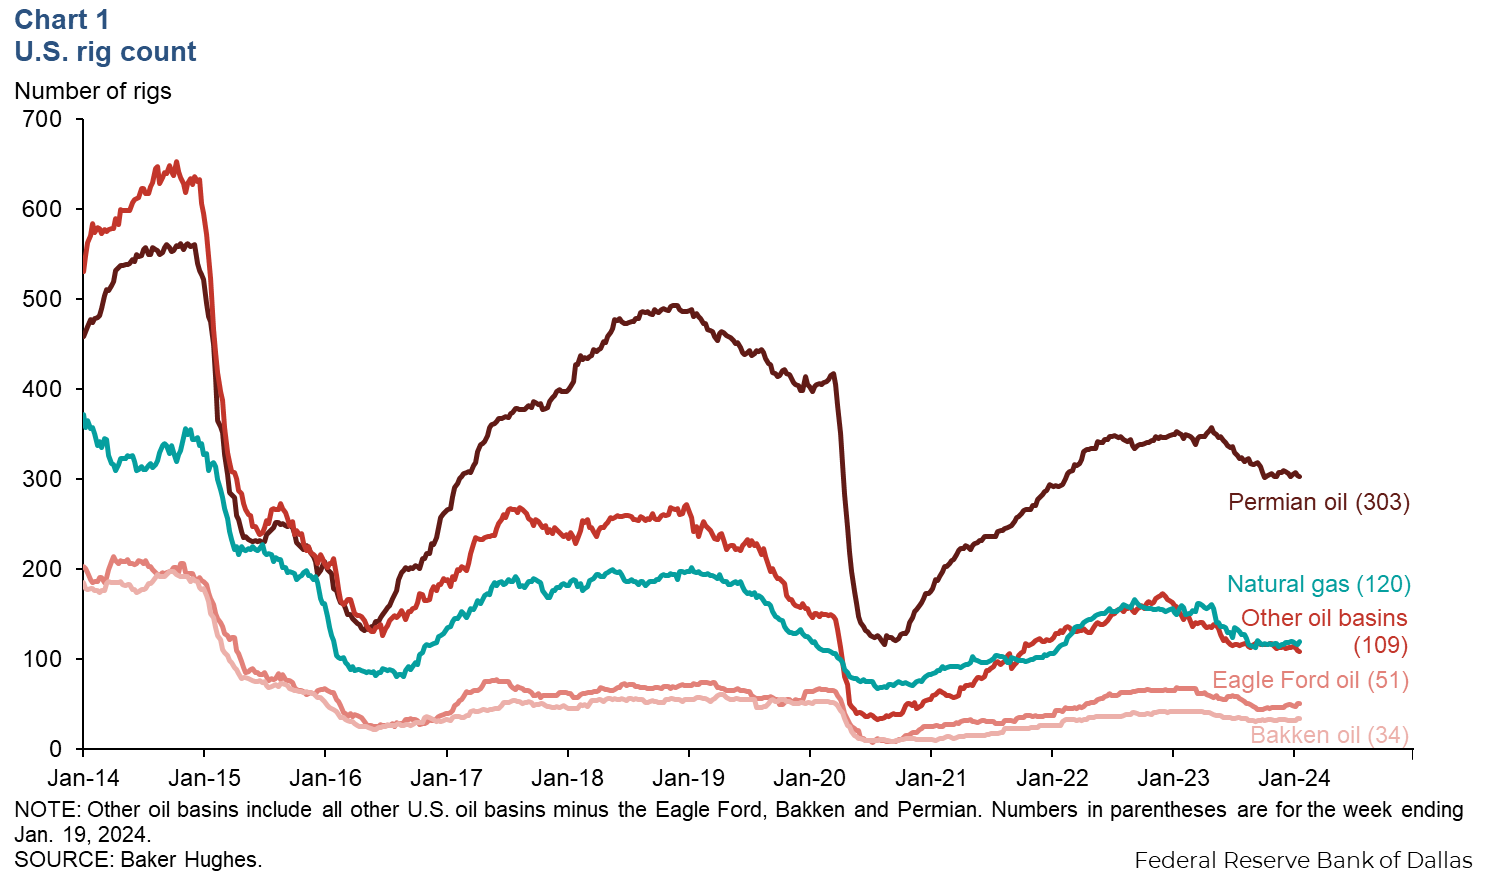
The U.S. natural gas rig count fell 25 percent. Natural gas rigs in the prolific Marcellus and Haynesville basins declined 47 rigs to 64, a 42 percent drop. Gas drilling in the rest of the U.S. increased 9 rigs, 20 percent. Production from the Haynesville and Marcellus basins grew a combined 1.7 billion cubic feet per day (bcf/d), a 7 percent increase from December 2022 to November 2023. Combined with robust associated gas production from oil wells, total U.S. natural gas withdrawals rose 6.9 bcf/d over that time frame.
Prices
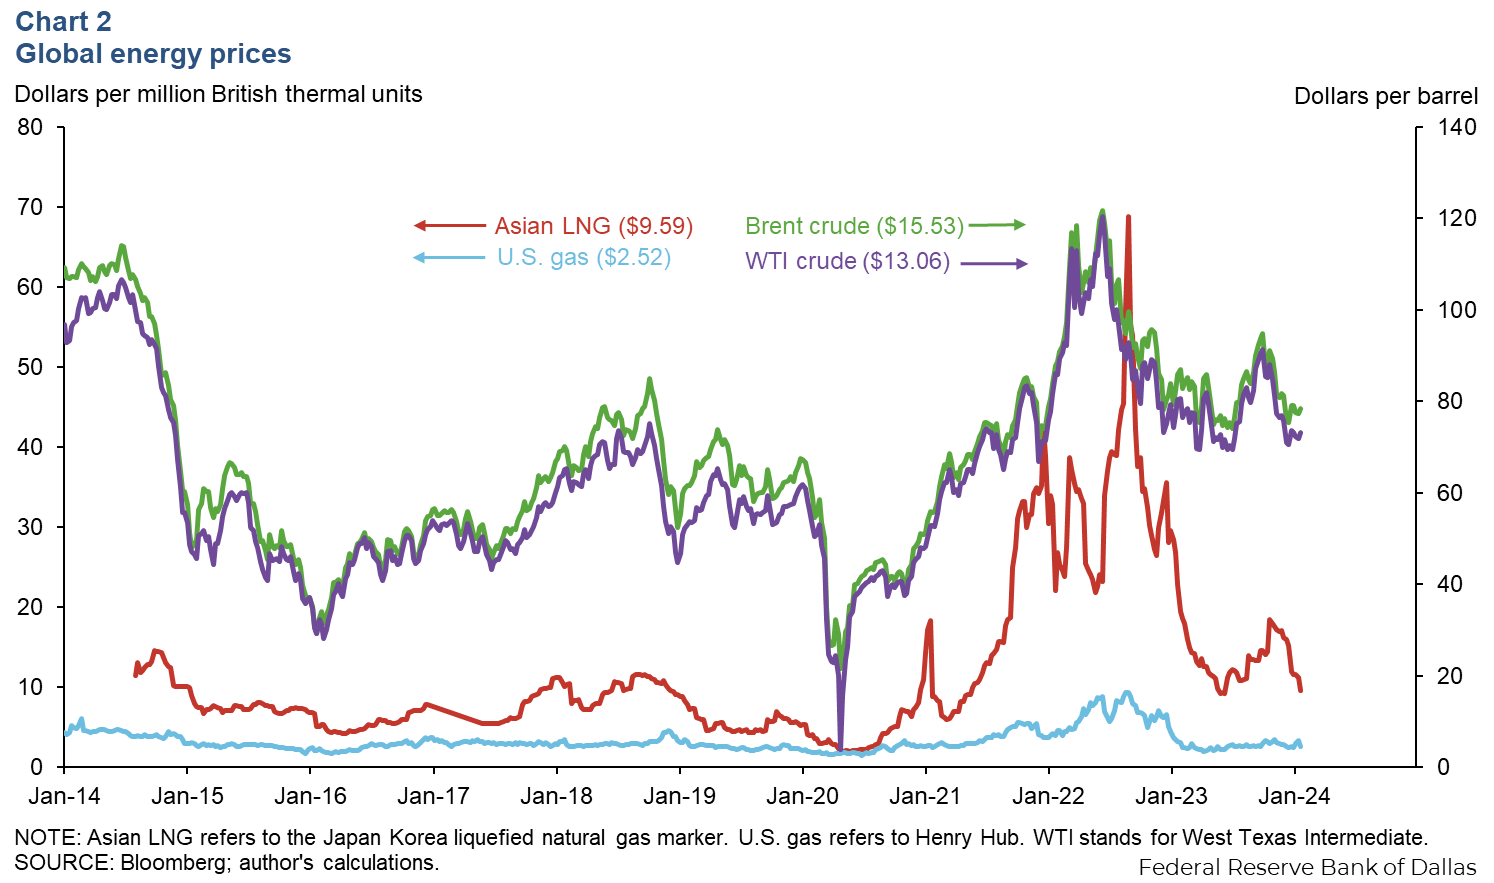
International natural gas prices have come down year over year, particularly in Asia where the Japan-Korea liquefied natural gas (LNG) marker fell 58 percent, hitting $9.59 per million British thermal units (MMBtu) for the week ending January 19. The U.S. gas benchmark fell 21 percent over the same time period. Henry Hub stood at $2.52 per MMBtu for the week ending January 19 (Chart 2).
Natural gas production outpaced consumption in 2023 as mild weather kept a lid on winter demand, leading to surging seasonal inventories and depressed prices. Inventories of U.S. working gas in storage hit 2.7 trillion cubic feet per day (Tcf/d), 10.7 percent above the five-year average for January. EU inventories were 2.8 Tcf, 41.4 percent above the five-year January average.
Brent and West Texas Intermediate (WTI) crude oil prices averaged $78 and $73 per barrel, respectively, the week ending Jan. 19, 2024. Adjusted for inflation to December 2023 dollars, front-month Brent contracts were down 11.6 percent from a year ago for the week ending January 19, and WTI front-month contracts were down 11.0 percent over the same time frame.
On average, participants in the Dallas Fed Energy Survey in December expect the price of WTI to end 2024 at $78 per barrel. Nearly half of the 143 respondents expect oil to end the year between $70 and $85; the balance of responses skewed slightly higher. At the time of the survey, WTI futures for December 2024 averaged $72 per barrel. One survey respondent noted the combination of volatility in commodity prices since the outbreak of the Russia-Ukraine war and high input prices make planning and budgeting difficult.
Energy Survey
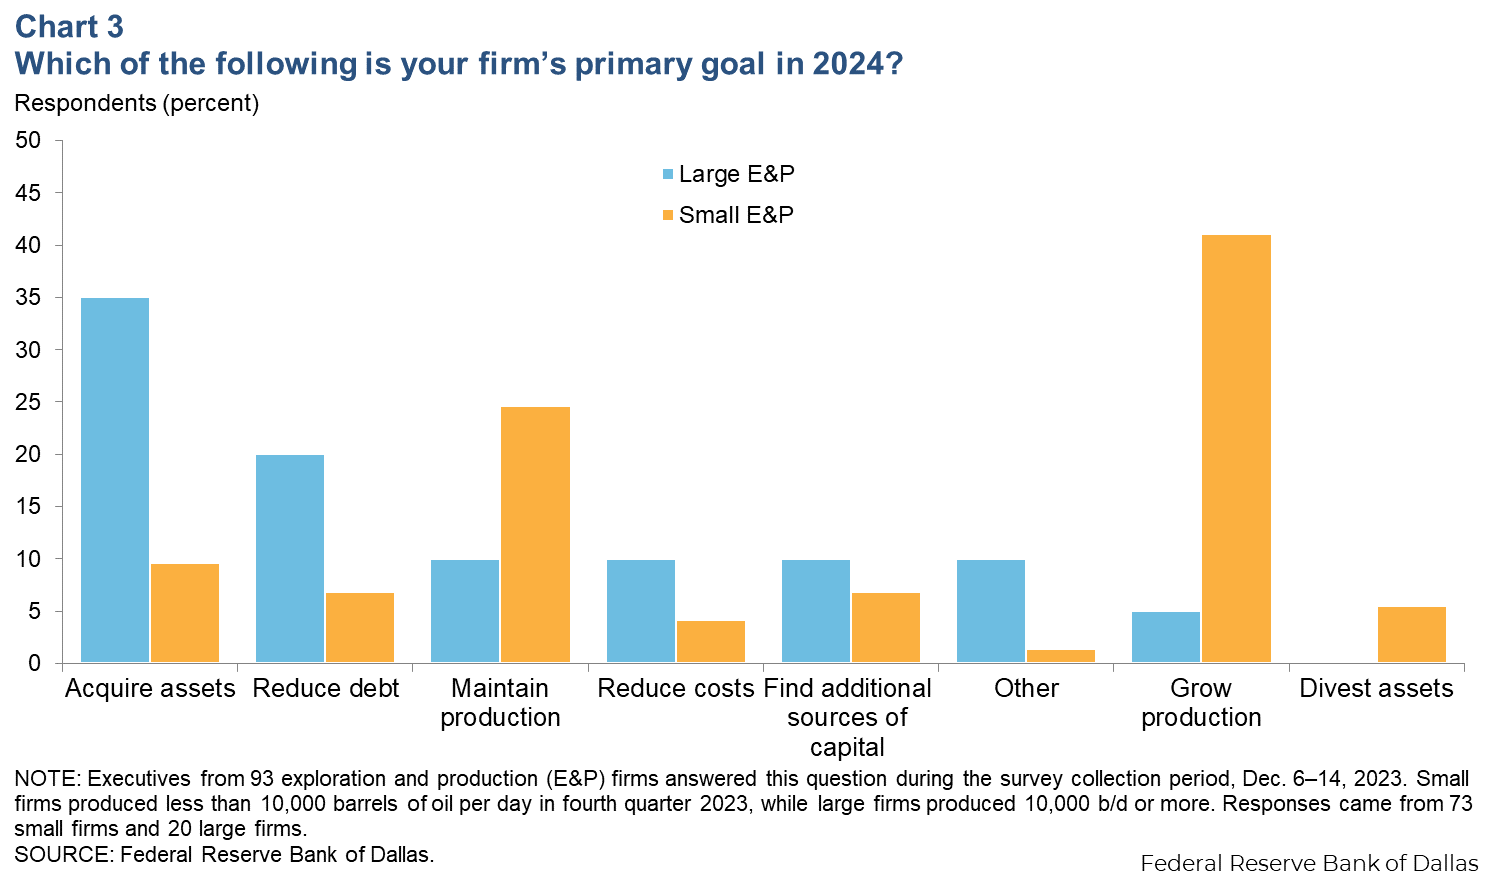
Of the small E&P firm respondents in the Dallas Fed Energy Survey Special Questions, 41 percent said production growth is their primary goal in 2024, while only 5 percent of large E&P firms said the same (Chart 3). Large firms instead are generally setting their sights on acquiring assets in 2024, with 35 percent answering the Dallas Fed Energy Survey this way.
With those priorities, average price expectations of $78 for WTI, and budgets planned for WTI of $71 (on average,) 59 percent of oil and gas executives say that their capital spending will either remain close to 2023 levels or increase slightly this year. The balance of other responses favored decreased spending.
Consensus projections
U.S. oil production growth to slow
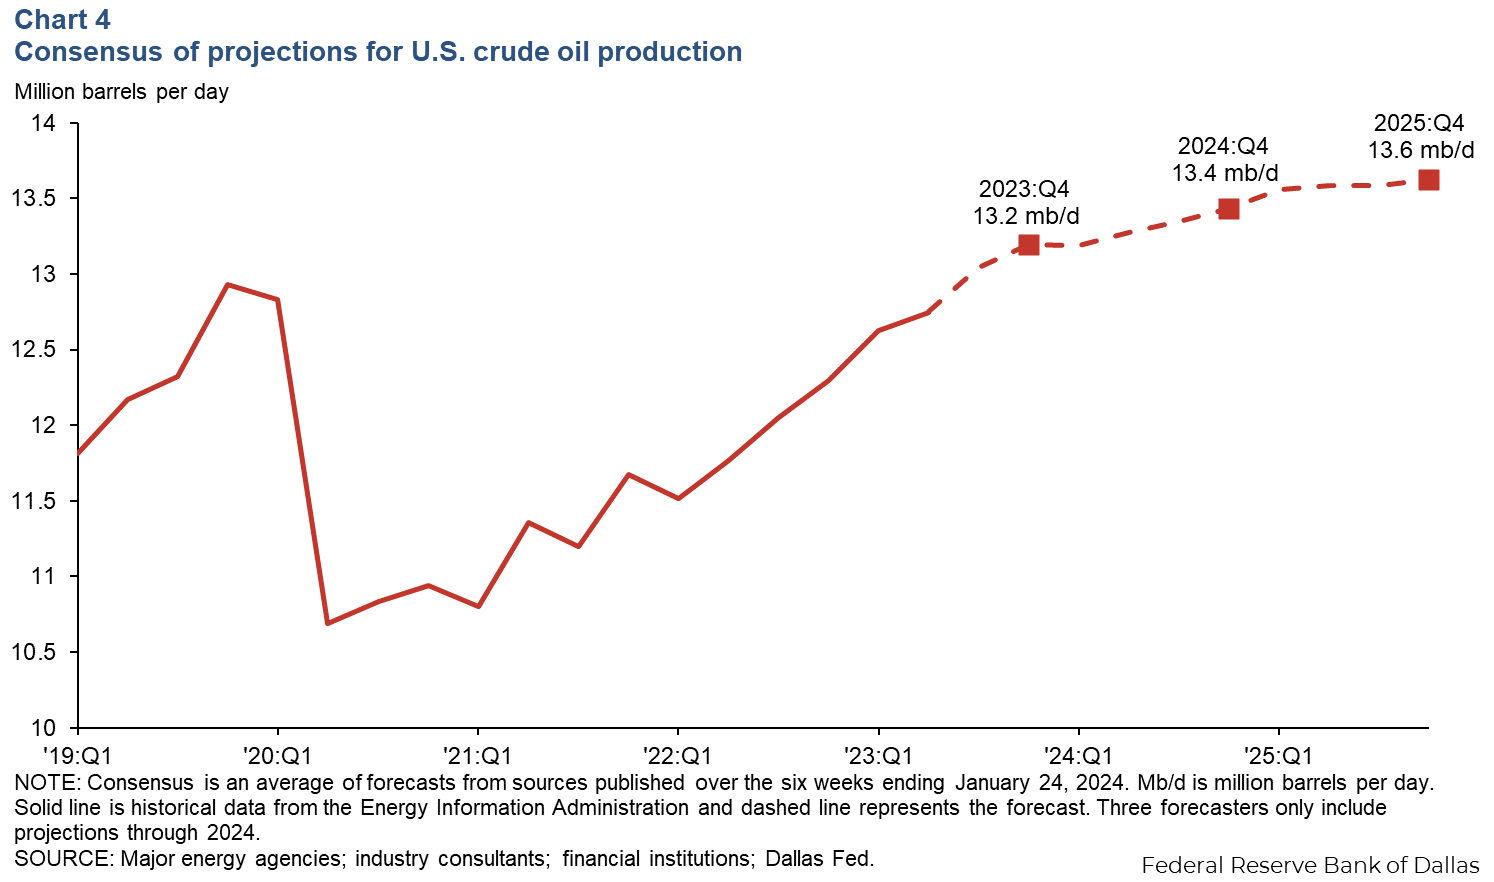
According to a consensus of projections, an average of several forecasts, U.S. crude oil production growth is set to slow this year. From fourth quarter 2022 to fourth quarter 2023, production grew an estimated 0.89 million barrels per day, ending the year at 13.2 mb/d. This year, production is expected to grow a more modest 0.24 mb/d (Chart 4). The pace of growth is expected to flatten further in 2025 to 0.19 mb/d.
Global oil consumption expected to grow
Global oil consumption is expected to grow 1.4 mb/d in 2024 and 0.9 mb/d in 2025 (Chart 5). Views on the magnitude of the demand increase in 2024 vary widely though, with projections ranging from 0.8 mb/d to 1.9 mb/d across the major agencies, private forecasters and investment banks.
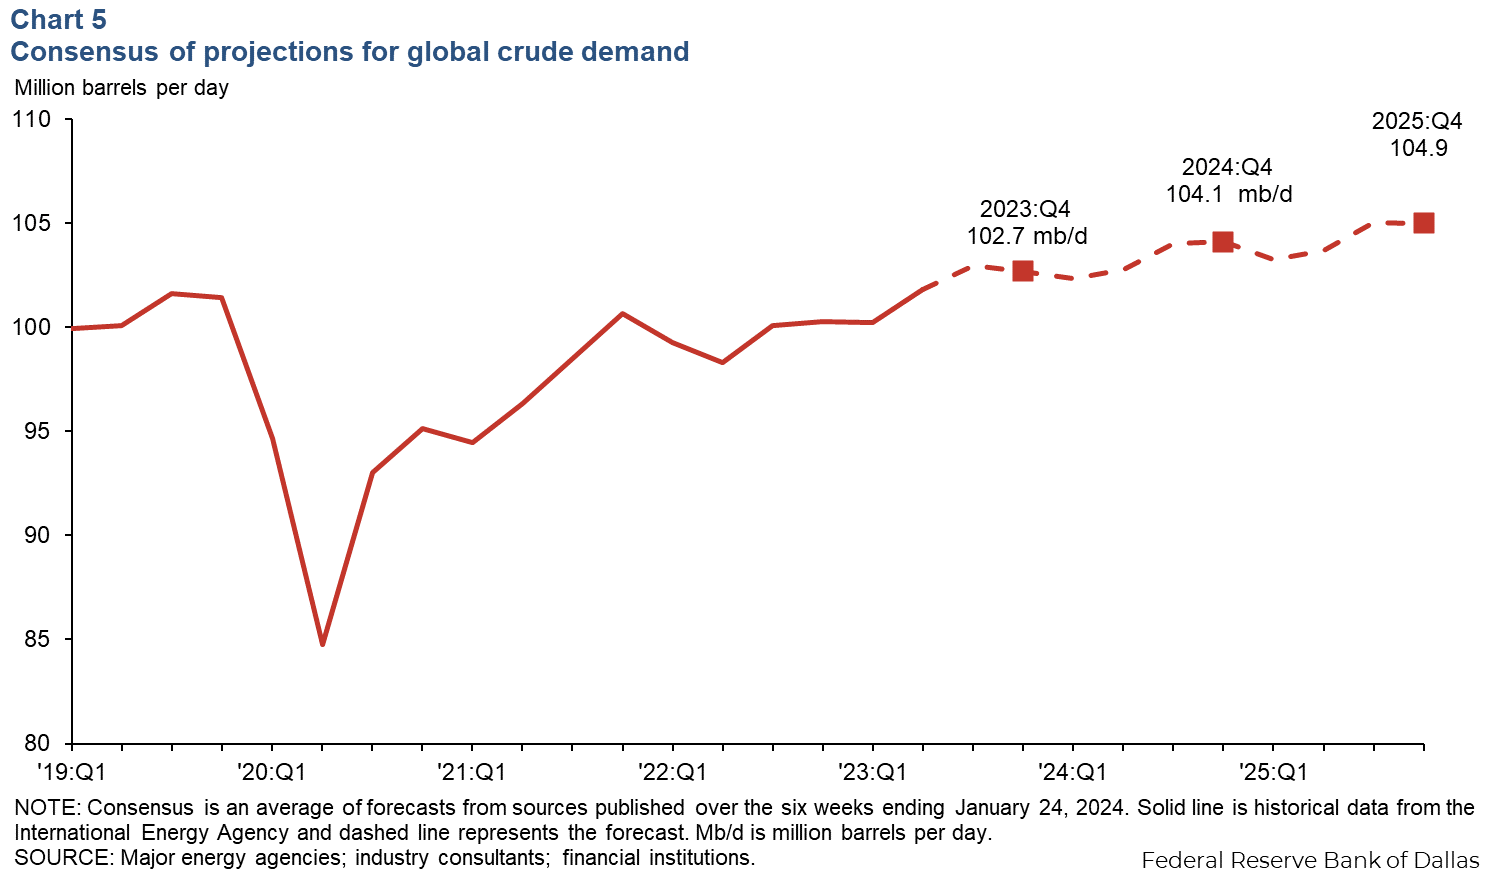
Slower global economic growth projections for 2024, the end of the postpandemic demand recovery, and improvements in the fuel efficiency of the transportation sector are contributing to the slower oil consumption growth outlook.
Balanced crude stocks in 2024
According to major energy agencies, consultancies and investment banks, in 2024 global crude oil consumption is expected to be roughly in line with production, causing global crude stocks to rise a meager 0.3 mb/d on average (Chart 6). Such a modest inventory build (if realized) would mean fundamentals likely won’t contribute to large price swings, and the build would be conducive to U.S. producer’s goals in 2024. However, other factors such as OPEC+ policies and geopolitics might add volatility and uncertainty to the market.
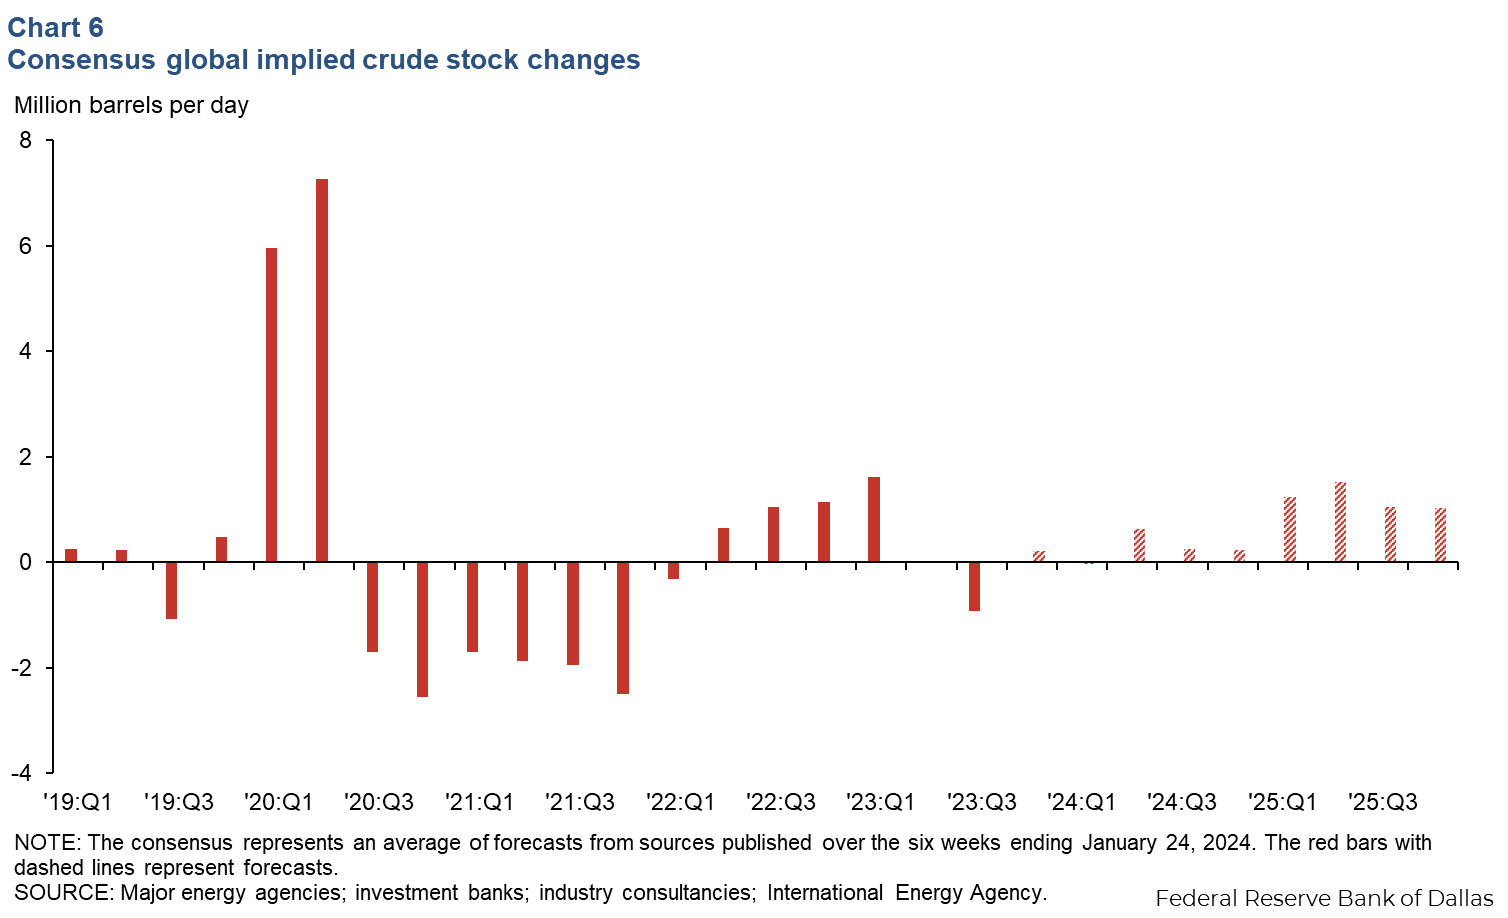
Forecasts of crude stock balances vary widely for 2024, with the projections ranging from negative 0.4 mb/d to 1.6 mb/d. That dispersion increases further in 2025, with the minimum projection nearly balanced at 0.3 mb/d and the maximum all the way up to 2.9 mb/d.
About Energy Indicators
Questions can be addressed to Kenya Schott at kenya.schott@dal.frb.org. Energy Indicators is released monthly and can be received by signing up for an email alert. For additional energy-related research, please visit the Dallas Fed’s energy home page.