Energy Indicators

| Energy dashboard (November 2024) | |||
| WTI price avg. Nov. 18–22 |
WTI price change from 4 weeks prior |
Henry Hub price avg. Nov. 18–22 |
Henry Hub price change from 4 weeks prior |
| $70.11/barrel | -2.1% | $2.35/MMBtu | 25.9% |
The capital expenditures index from the Dallas Fed Energy Survey as well as business investment in mining were nearly flat in third quarter 2024. Increases in the development cost index for Exploration and Production (E&P) firms are increasing at a faster rate than input costs for oil and gas (O&G) support service firms. On balance, this has left break-even prices flat, while oil prices have fallen. Tracking this, real total returns among publicly traded firms have declined in recent months after outpacing the S&P 500 from mid-2020 to 2023.
Investment
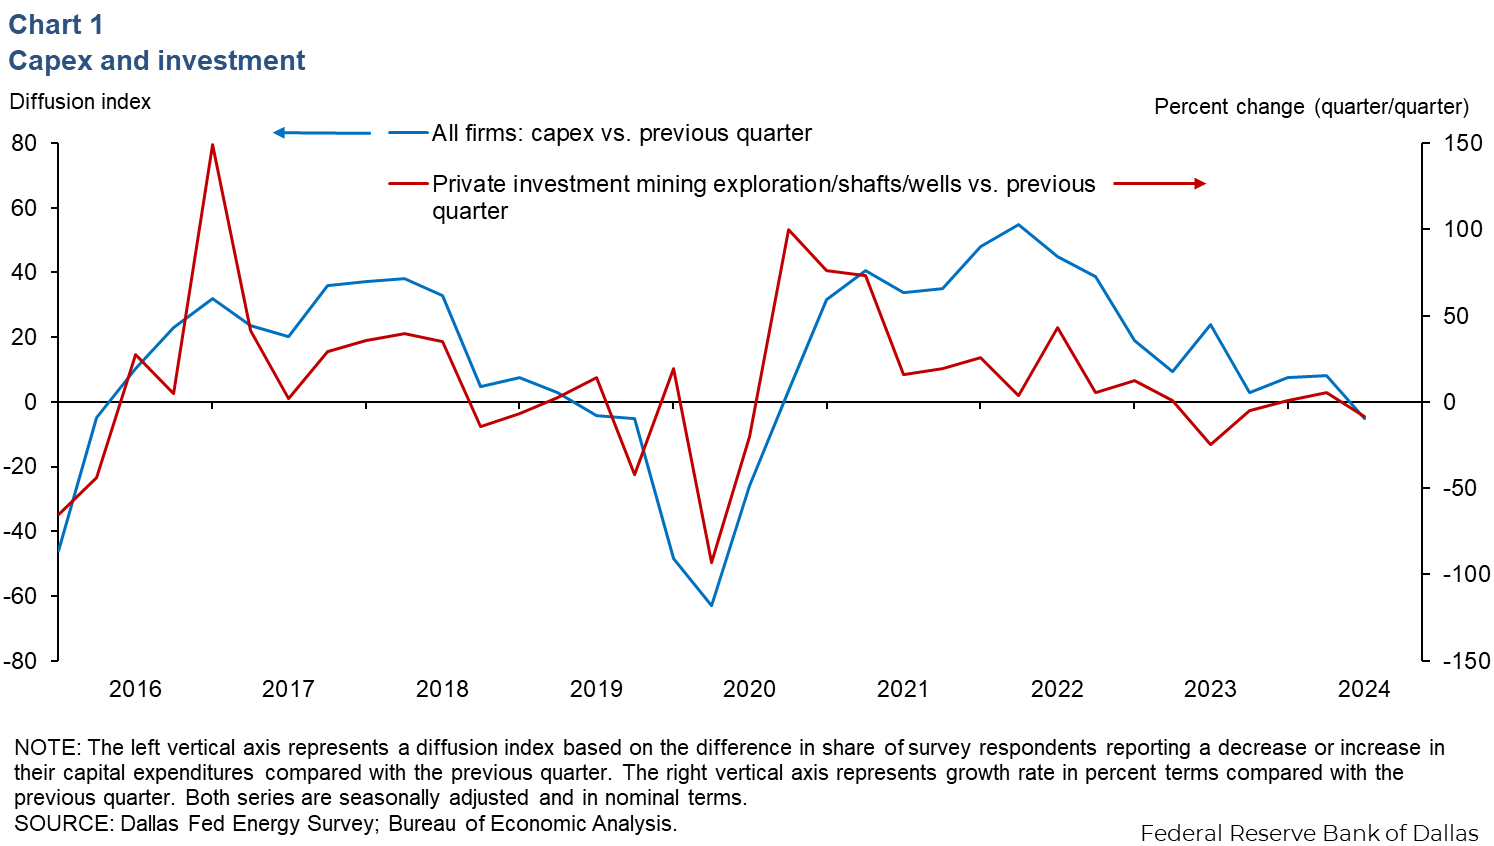
The Dallas Fed’s Energy Survey in the third quarter indicated that the capital expenditures (capex) diffusion index shifted down, consistent with the growth rate for private investment of mining exploration, shafts and wells, which has decreased quarter over quarter (Chart 1). Quarterly growth rates from the mining investment data and capex diffusion index are positively correlated.
Development and input costs
In third quarter 2023, the finding/development diffusion index fell six points, according to the E&P firms surveyed. Based on O&G support service firms surveyed, the input costs diffusion index fell 19 points in the third quarter (Chart 2). These changes indicate fewer firms on balance reported rising cost pressures compared with the previous quarter.
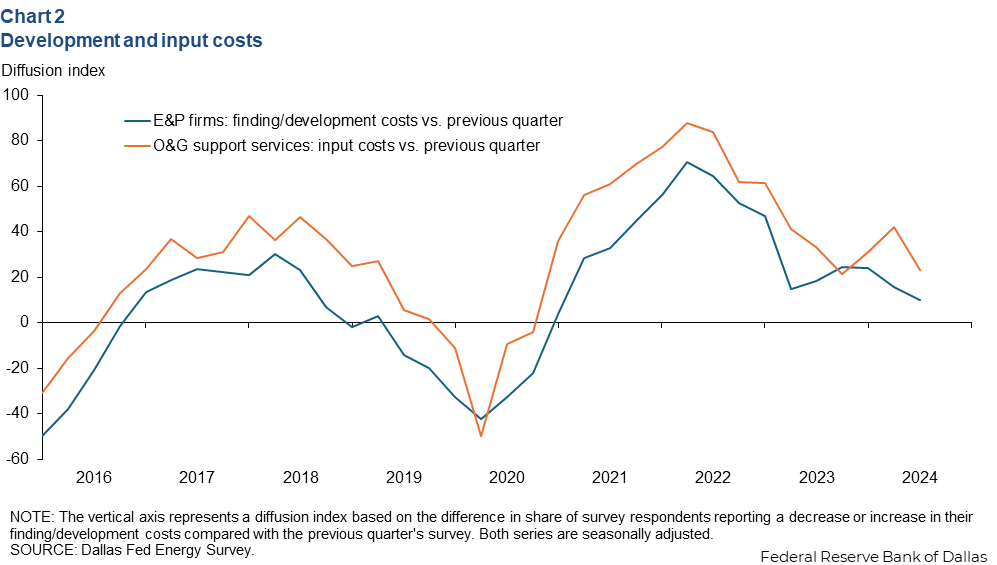
Overall, the business activity index turned negative in the third quarter, but most firms (48 percent) surveyed reported “no change.” The split was between E&P and oilfield services firms. E&P firms reported flat activity, while O&G support services declined.
Breakevens and profitability
As West Texas Intermediate (WTI) futures have been declining from postpandemic highs, the industry Producer Price Index (PPI) for drilling and oil services and the reported break-even prices for drilling reported in the Kansas City Fed and Dallas Fed surveys remained stable (Chart 3). The October Kansas City Fed energy survey reported a $65 average break-even price per barrel across respondents surveyed, an increase of only $1 from the same period in 2023. The PPI was up 1.7 percent compared with October 2023.
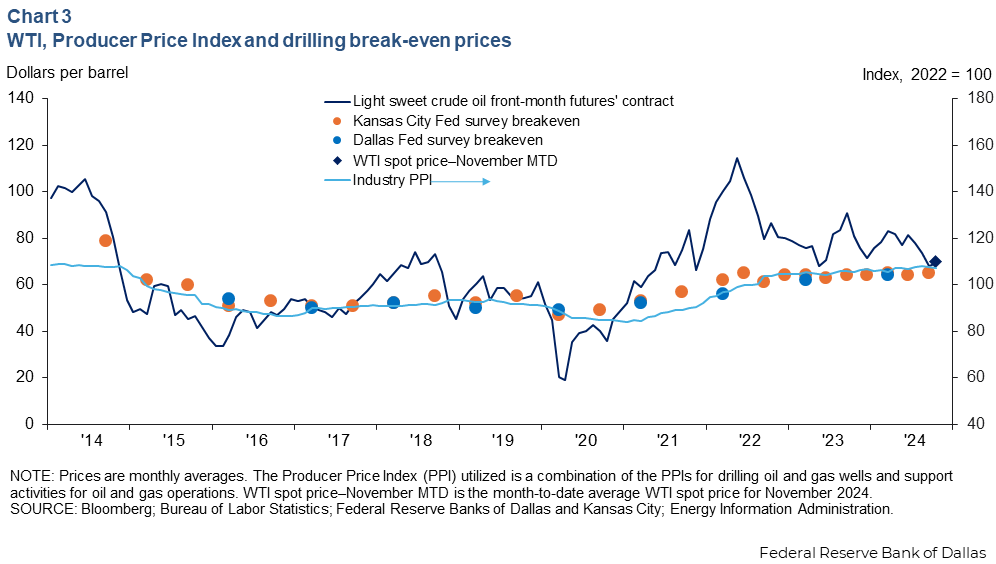
The average daily front-month closing price for WTI for Nov. 1–25 was $70 per barrel, 12.8 percent below November 2023. Industry forecast agencies such as Goldman Sachs project WTI will average around $70 per barrel for fourth quarter 2024 and expect it to remain near $69 in fourth quarter 2025. However, with 2.2 million barrels per day of OPEC+ spare capacity waiting to return to market, risks around the price of oil remain weighted to the downside.
Oil and gas equities underperform in latter half of 2024
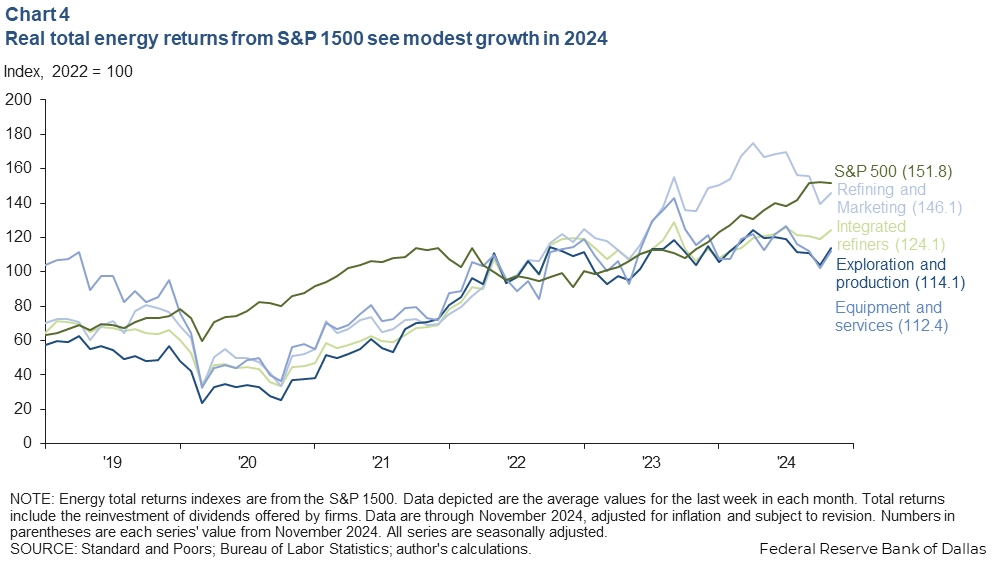
Inflation-adjusted total returns to oil and gas segments of the S&P 1500 (which include the reinvestment of dividends) were mixed in 2024 (Chart 4). Year to date, total annualized real returns for integrated refiners (firms that both produce and refine oil) were up 10.5 percent for the last week of November. Independent E&P firms' returns dropped 0.9 percent, and refining and marketing was down 1.9 percent year to date annualized. Oilfield equipment and services firms saw the sharpest declines in returns, falling 8.2 percent. For comparison, the benchmark S&P 500 index total returns grew 32.6 percent year to date.
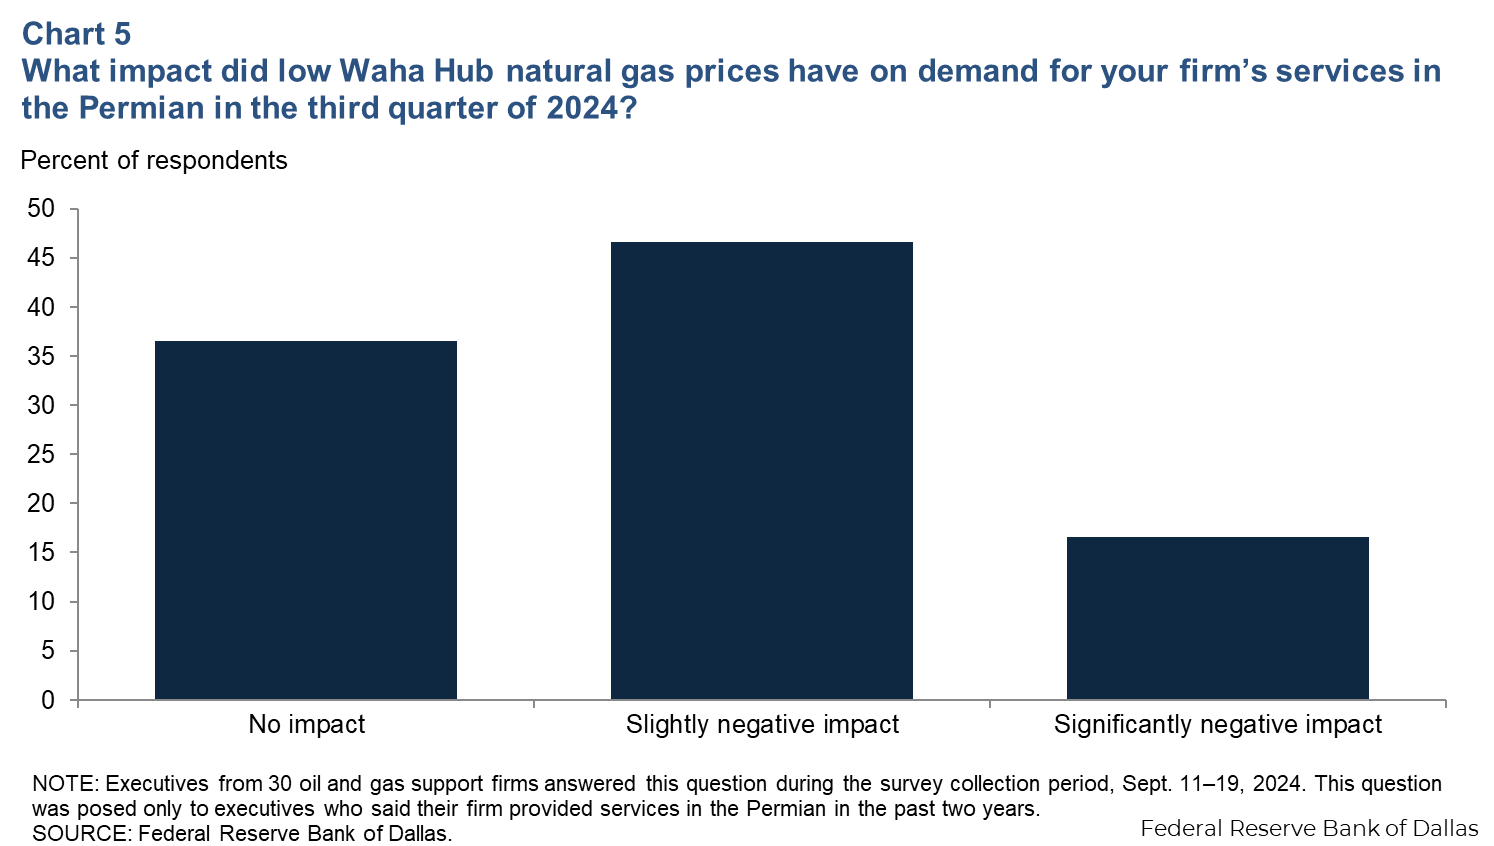
Low natural gas prices negatively impact demand
Most oilfield services firms that work in the Permian were negatively impacted by low Waha hub natural gas prices in the third quarter, according to the Dallas Fed Energy Survey (Chart 5). Waha—a benchmark for the price of natural gas near the Permian Basin in West Texas—averaged $1.79 per million British thermal units for the week ending Nov. 29, an improvement from the consistently negative prices seen most of the year. Rising associated gas production (natural gas co-produced alongside oil), limited takeaway capacity within the Permian Basin, as well as delays in the startup of new capacity—the Matterhorn gas pipeline—have driven the exceptionally weak prices.
The new 2.6 billion cubic feet per day (bcf/d) pipeline extending from the Permian Basin to Katy, Texas, began running in October. From Oct. 1 to Nov. 8, Bloomberg New Energy Finance reported the pipeline carried approximately 1.3 bcf/d. Expectations vary widely among analysts and industry leaders, but the pipeline is projected to reach maximum capacity in fewer than two years.
About Energy Indicators
Questions can be addressed to Sasha Samperio at sasha.samperio@dal.frb.org. Energy Indicators is released monthly and can be received by signing up for an email alert. For additional energy-related research, please visit the Dallas Fed’s energy home page.