
Dallas Fed Energy Survey
Oil and gas activity edges lower as outlooks dim, uncertainty rises
Special questions this quarter focus on the impact of low Waha Hub natural gas prices on activity in the Permian Basin, whether E&P firms plan to ramp up completions once the natural gas pipeline bottleneck clears in the Permian and expectations regarding future pipeline bottlenecks for crude oil in the Permian. Also explored are firms’ plans for electrification of oil fields along with the lead time for electrical components, such as transformers, and the top challenges to electrification.
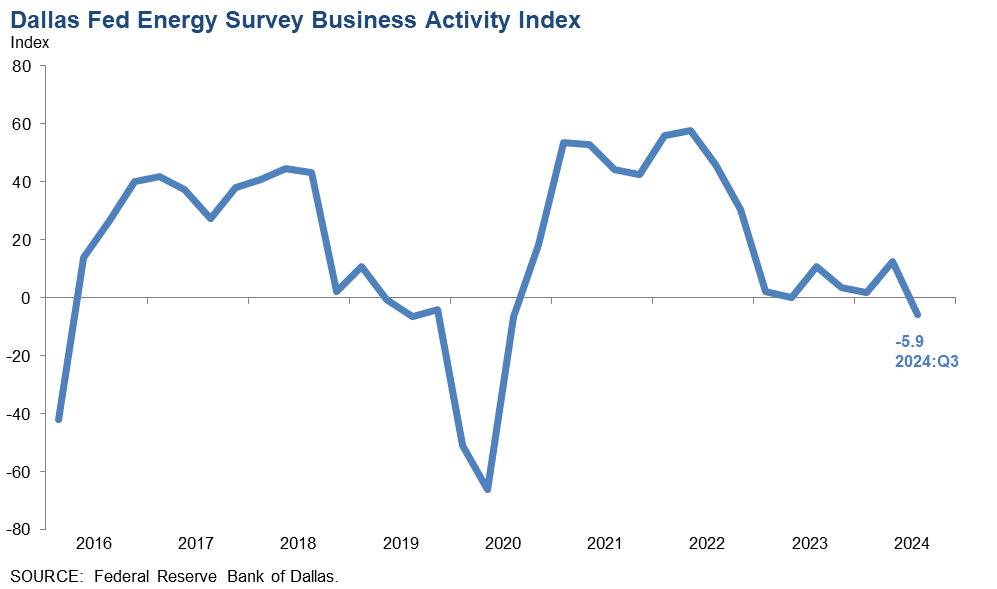
Activity in the oil and gas sector declined slightly in third quarter 2024, according to oil and gas executives responding to the Dallas Fed Energy Survey. The business activity index, the survey’s broadest measure of the conditions energy firms face in the Eleventh District, decreased from 12.5 in the second quarter to -5.9 in the third quarter. The business activity index was 0 for exploration and production (E&P) firms compared with -18.1 for services firms, suggesting activity was unchanged for E&P firms but declined for service firms.
Oil and gas production was mixed in the third quarter, according to executives at E&P firms. The oil production index increased from 1.1 in the second quarter to 7.9 in the third quarter, suggesting oil production slightly increased in the quarter. Meanwhile, the natural gas production index declined from 2.3 to -13.3, suggesting natural gas production decreased in the quarter.
Costs rose but at a slower pace when compared with the prior quarter. Among oilfield services firms, the input cost index fell from 42.2 to 23.3. Among E&P firms, the finding and development costs index declined from 15.7 to 9.9. Meanwhile, the lease operating expenses index edged lower from 23.6 to 21.3. Two of the three cost indexes trailed the series average, suggesting costs are growing at a slower-than-average pace.
The equipment utilization index for oilfield services firms turned negative, declining from 10.9 in the second quarter to -20.9 in the third. The operating margin index fell sharply from -13.0 to -32.6, suggesting margins declined at a faster pace. The prices received for services index was relatively unchanged at -2.3.
The aggregate employment index was unchanged at 2.9 in the third quarter. While this is the 15th consecutive positive reading for the index, the low-single-digit result suggests little-to-no net hiring. The aggregate employee hours index declined from 8.1 to -2.3. Additionally, the aggregate wages and benefits index decreased from 24.0 to 18.6.
The company outlook index turned negative in the third quarter, plunging 22 points to -12.1, suggesting modest pessimism among firms. The overall outlook uncertainty index jumped 25 points to 48.6, suggesting mounting uncertainty.
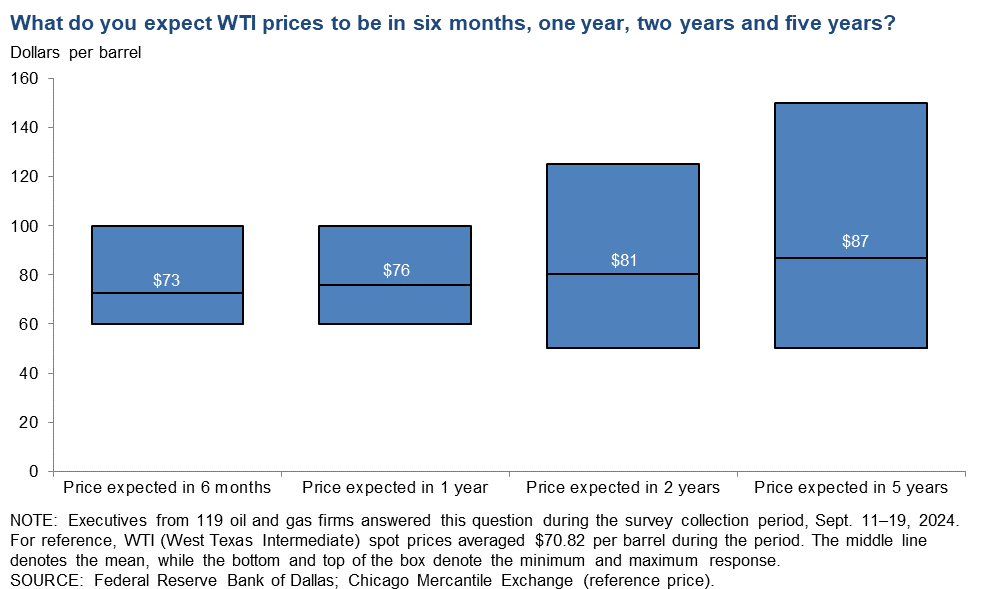
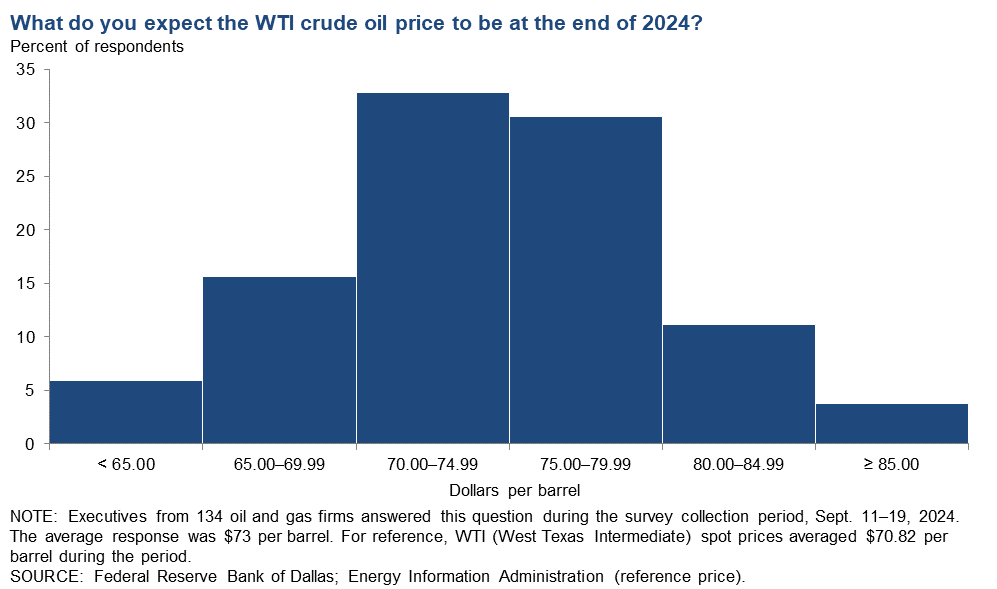
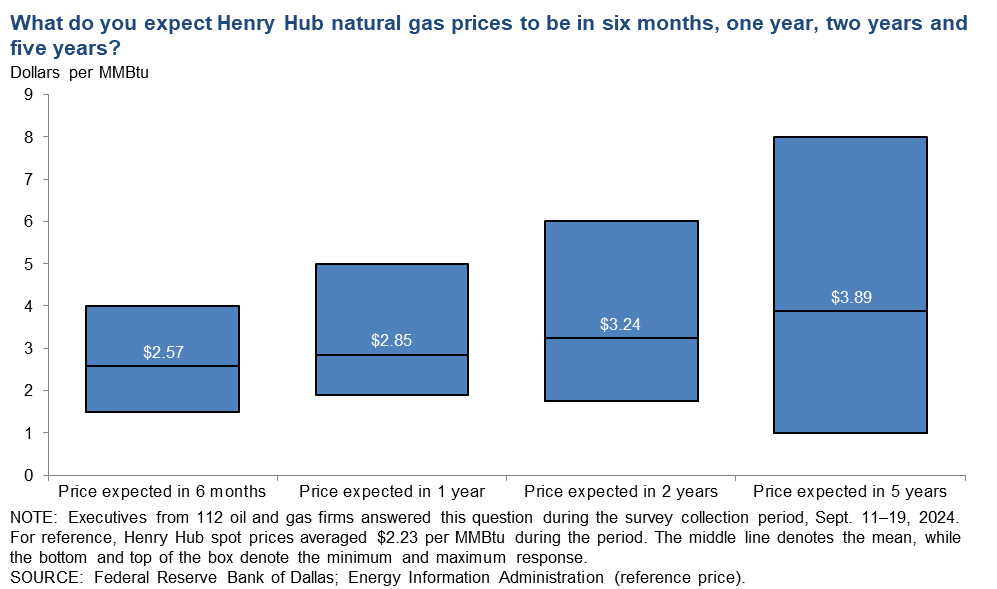
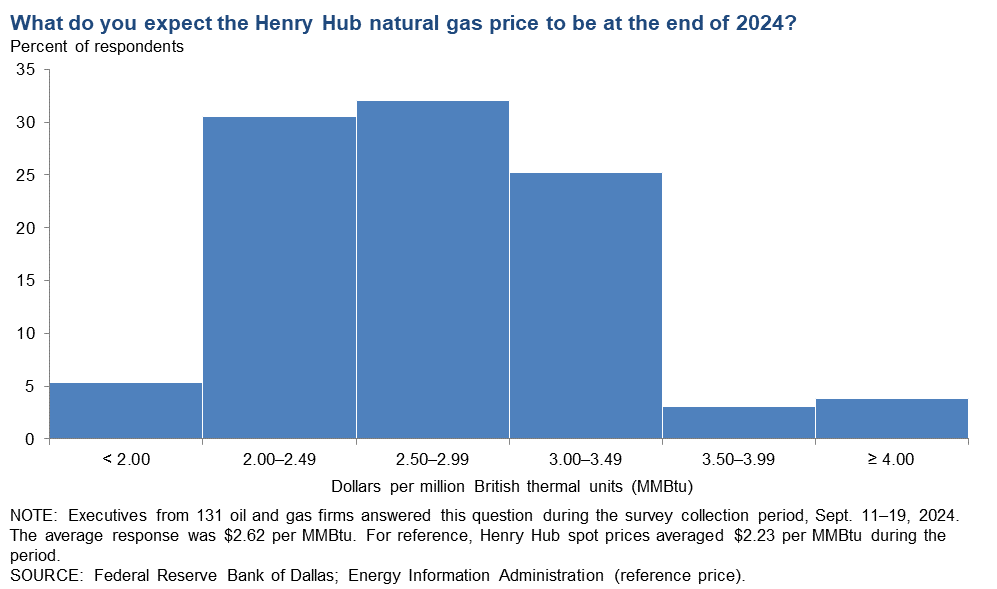
On average, respondents expect a West Texas Intermediate (WTI) oil price of $73 per barrel at year-end 2024; responses ranged from $55 to $100 per barrel. When asked about longer-term expectations, respondents on average expect a WTI oil price of $81 per barrel two years from now and $87 per barrel five years from now. Survey participants expect a Henry Hub natural gas price of $2.62 per million British thermal units (MMBtu) at year-end. When asked about longer-term expectations, respondents on average anticipate a Henry Hub gas price of $3.24 per MMBtu two years from now and $3.89 per MMBtu five years from now. For reference, WTI spot prices averaged $70.82 per barrel during the survey collection period, and Henry Hub spot prices averaged $2.23 per MMBtu.
Next release: January 2, 2025
Data were collected Sept. 11–19, and 136 energy firms responded. Of the respondents, 91 were exploration and production firms and 45 were oilfield services firms.
The Dallas Fed conducts the Dallas Fed Energy Survey quarterly to obtain a timely assessment of energy activity among oil and gas firms located or headquartered in the Eleventh District. Firms are asked whether business activity, employment, capital expenditures and other indicators increased, decreased or remained unchanged compared with the prior quarter and with the same quarter a year ago. Survey responses are used to calculate an index for each indicator. Each index is calculated by subtracting the percentage of respondents reporting a decrease from the percentage reporting an increase. When the share of firms reporting an increase exceeds the share reporting a decrease, the index will be greater than zero, suggesting the indicator has increased over the previous quarter. If the share of firms reporting a decrease exceeds the share reporting an increase, the index will be below zero, suggesting the indicator has decreased over the previous quarter.
Price Forecasts
West Texas Intermediate Crude
| West Texas Intermediate crude oil price, year-end 2024 | ||||
| Indicator | Survey Average | Low Forecast | High Forecast | Price During Survey |
Current quarter | $72.66 | $55.00 | $100.00 | $70.82 |
Prior quarter | $78.66 | $62.50 | $100.00 | $79.94 |
| NOTE: Price during survey is an average of daily spot prices during the survey collection period. SOURCES: Federal Reserve Bank of Dallas; Energy Information Administration. | ||||
Henry Hub Natural Gas
| Henry Hub natural gas price, year-end 2024 | ||||
| Indicator | Survey Average | Low Forecast | High Forecast | Price During Survey |
Current quarter | $2.62 | $1.50 | $4.25 | $2.23 |
Prior quarter | $3.01 | $1.85 | $4.80 | $2.61 |
| NOTE: Price during survey is an average of daily spot prices during the survey collection period. SOURCES: Federal Reserve Bank of Dallas; Energy Information Administration. | ||||
Special Questions
Data were collected Sept. 11–19; 133 oil and gas firms responded to the special questions survey.
Exploration and production firms
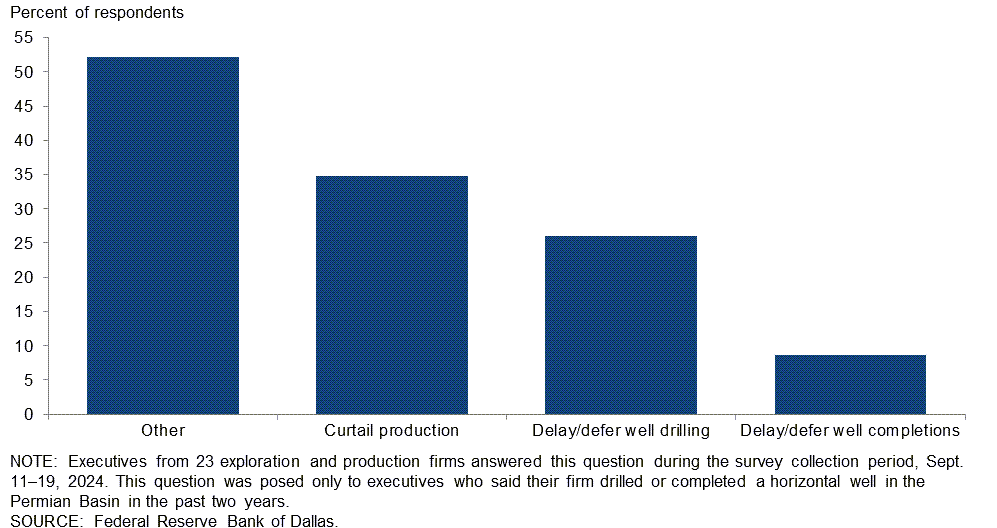
In the Permian Basin, what impact have low Waha natural gas prices had on your operations in the third quarter of 2024? Please select all that apply.
The Waha Hub is a gathering location for natural gas in the Permian Basin and connects to major pipelines. Of the executives surveyed, 52 percent selected “other”; the most-cited reason was little to no impact on operations, followed by reduced natural gas revenue. Thirty-five percent said low Waha Hub natural gas prices caused their firm to curtail production. Twenty-six percent said low natural gas prices caused them to delay/defer well drilling, and 9 percent noted they delayed/deferred well completions. Respondents were able to select more than one choice for this special question. Among those who selected “other,” only one chose any of the remaining options.
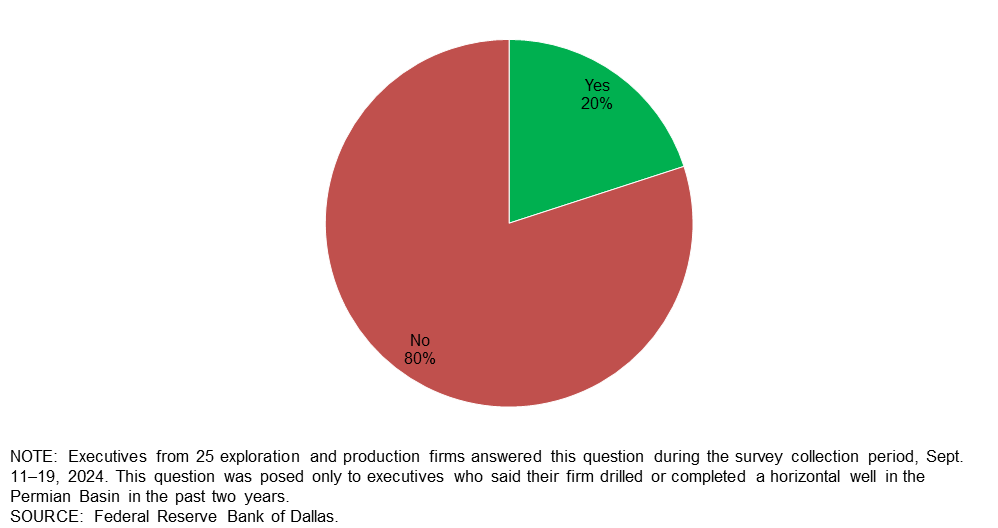
Is your firm planning to ramp up well completion activities in the Permian Basin once the natural gas pipeline bottleneck is cleared?
Eighty percent of executives said they are not planning to ramp up well completion activities in the Permian Basin once the natural gas pipeline bottleneck clears. The remaining 20 percent said their firm plans to do so.
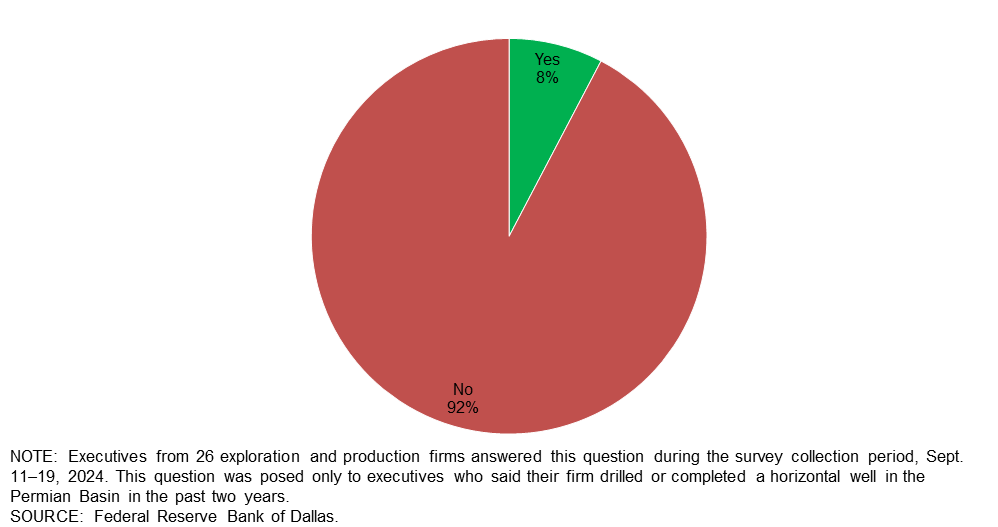
Do you expect your firm's crude oil production to be constrained at any point in time between now and the end of 2026 due to crude oil pipeline capacity constraints in the Permian?
Ninety-two percent of executives said they do not expect their firm’s crude oil production to be limited between now and the end of 2026 due to crude oil pipeline capacity constraints in the Permian. The remaining 8 percent said that they expect constrained production.
Oil and gas support services firms
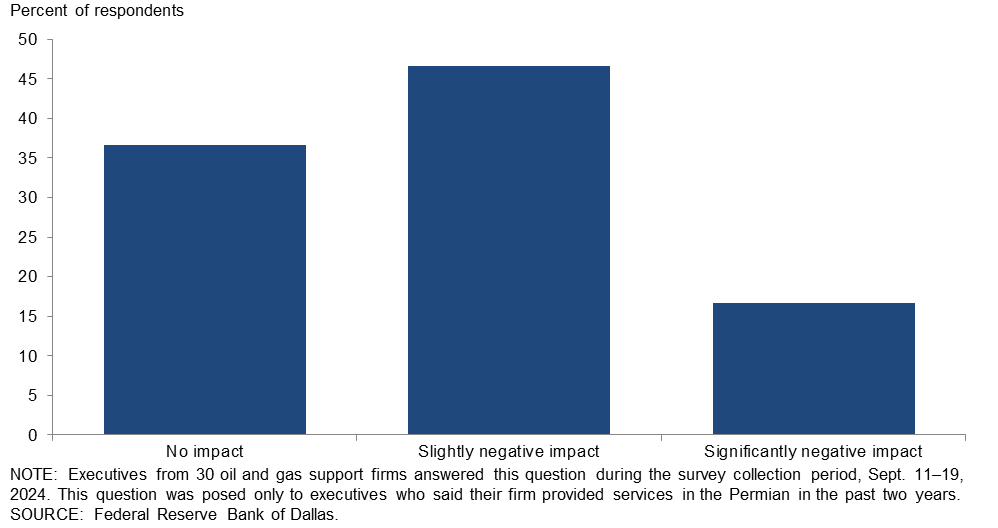
What impact did low Waha Hub natural gas prices have on demand for your firm’s services in the Permian in the third quarter of 2024?
The majority of executives surveyed, 47 percent, said low Waha Hub natural gas prices slightly negatively affected demand for their firm’s services in the Permian Basin in the third quarter. Thirty-seven percent noted no impact, while 17 percent said the low Waha Hub prices had a significantly negative impact on demand for their firm’s services in the basin in the most recent quarter.
All firms
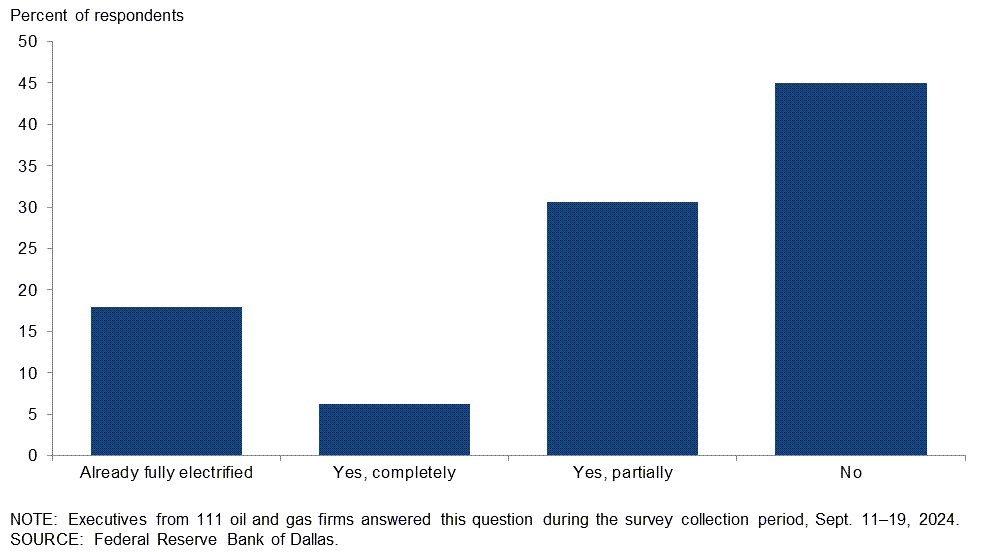
Is your firm aiming to electrify its oilfield operations?
Eighteen percent of executives said their firm’s oilfield operations are already fully electrified. Six percent of executives said they aim to completely electrify oilfield operations for their firm, and an additional 31 percent said they expect to partially electrify operations. The remaining 45 percent said they do not plan to do so.
Responses differed depending on the firm’s size and type. Twenty-eight percent of the executives surveyed from small exploration and production (E&P) firms (crude oil production of fewer than 10,000 barrels per day (b/d) as of fourth quarter 2023) said their oilfield operations are already fully electrified, compared with 9 percent of executives from oil and gas support services firms and 6 percent of large E&P firms (production of 10,000 b/d or more). Service firms were also slightly more likely than small and large E&P firms to indicate they are not aiming to electrify their oilfield operations. A breakdown of the data is in the table below.
| Response | Percent of respondents (among each group) | |||
| All firms | Large E&P | Small E&P | Services | |
| Already fully electrified | 18 | 6 | 28 | 9 |
| Yes, completely | 6 | 6 | 9 | 3 |
| Yes, partially | 31 | 44 | 24 | 34 |
| No | 45 | 44 | 40 | 54 |
| NOTE: Executives from 76 exploration and production firms and 35 oil and gas support services firms answered this question during the survey collection period, Sept. 11–19, 2024. Small E&P firms produced fewer than 10,000 barrels per day (b/d) in the fourth quarter of 2023, while large E&P firms produced 10,000 b/d or more. A total of 58 small E&P firms and 18 large E&P firms responded. Percentages may not sum to 100 due to rounding. SOURCE: Federal Reserve Bank of Dallas. |
||||
What is the current lead time for electrical components, such as transformers?
A majority of executives—54 percent—said the current lead time for electrical components, such as transformers, is not more than one year. Twenty-one percent of executives said the lead time is more than one year but not more than two years. An additional 10 percent of executives said more than two years but not more than three years. No executives said three years or more. Fifteen percent of executives noted there is no lead time for electrical components such as transformers.
| Response | Percent of respondents |
| No lead time | 15 |
| Not more than one year | 54 |
| More than one year but not more than two years | 21 |
| More than two years but not more than three years | 10 |
| More than three years but not more than four years | 0 |
| More than four years but not more than five years | 0 |
| More than five years | 0 |
| NOTE: Executives from 39 oil and gas firms answered this question during the survey collection period, Sept. 11–19, 2024. This question was posed only to executives who said their firm is aiming to electrify its oilfield operations or who have already electrified their operations. SOURCE: Federal Reserve Bank of Dallas. |
|
What is the top challenge to electrifying oilfield operations?
This question was asked to all respondents. Firms aiming to electrify oilfield operations, or that have already done so, were asked whether their operations were primarily focused on the Permian Basin or outside the Permian Basin. Among firms primarily focused on the Permian Basin, the top selected challenge was “uncertainty about future access to the grid” (29 percent), followed by “other” (25 percent). The most-cited reason for “other” was challenges with grid infrastructure. Among firms primarily focused outside the Permian, the top selected challenge was “too expensive” (30 percent), followed by “lead times for equipment” (26 percent).
Among respondents not looking to electrify, the most-cited response was “too expensive” (48 percent), followed by both “uncertainty about future grid stability” and “other,” which were each selected by 17 percent of respondents.
| Response | Percent of respondents (among each group) | ||
| Firms aiming to electrify or already electrified | Firms not aiming to electrify | ||
| Firms with operations primarily focused on the Permian | Firms with operations primarily focused outside the Permian | ||
| Lead times for equipment | 8 | 26 | 7 |
| Uncertainty about future access to the grid | 29 | 9 | 10 |
| Uncertainty about future grid stability | 17 | 13 | 17 |
| Too expensive | 13 | 30 | 48 |
| Regulatory and permitting issues | 8 | 4 | 0 |
| Other | 25 | 17 | 17 |
| NOTE: Executives from 76 oil and gas firms answered this question during the survey collection period, Sept. 11–19, 2024. Among the responses from firms aiming to electrify their oilfield operations or have already electrified, responses came from 24 firms with operations primarily focused on the Permian and 23 firms with operations primarily focused outside the Permian. Responses came from 29 firms not aiming to electrify. SOURCE: Federal Reserve Bank of Dallas. |
|||
Special Questions Comments
Exploration and Production (E&P) Firms
- We stand by the hypothesis that the world is swiftly running out of $60 barrels on the way to $100+ barrels within the next five years. OPEC is being punished short term for ceding market share. To us, it appears to be a savvy "oil storage" policy. U.S. shale will decline in a similar fashion to how Hemingway went bankrupt: "Gradually, then all of a sudden." Why do you think very sophisticated firms, worth tens of billions of dollars, are selling out to the super majors for equity despite a market-leading Permian footprint?
- The oil community prefers to await the allocation of capital until after the election. Deflationary pressures in China continue to curtail oil demand. India is buying cheap Russian oil, which is also helping cap world prices. Future OPEC+ production allotments are uncertain. The lack of a war-price premium in product prices is a concern. Technical analysis of the recent oil-price movements suggests that WTI could drop to around $55 per barrel depending on whether the U.S. is entering a recession.
Oil and Gas Support Services Firms
- Most of our rigs are capable of running off grid power, but the logistical (regulatory and permitting) hurdles that our customers have to go through to bring power to the rig is formidable and expensive.
- The Electric Reliability Council of Texas and/or Public Utility Commission of Texas are struggling with regulatory framework around distributed generation, behind-the-meter generation and grid interconnections. Statutory requirements for utilities to approve grid interconnections have no teeth; what should take three months now takes 12 to 18 months. Lead times for intermediate voltage (~14KVa) transformers, etc., are now two to three years, and utility-scale high-voltage components are in the five-to-seven-year range. Utility-scale battery backup costs roughly 10 to 15 times the cost of natural gas-powered peaking facilities. Concerns about being able to meet projected demand driven by AI and/or data centers and/or bitcoin mining abound. Serious concerns about large tech players locking up baseload and peaking power supplies and driving up the costs for consumers also exist.
- I am not convinced that electric-powered vehicles and equipment can hold up to the operational demands placed on them in our industry. That and the cost of parts (especially batteries) cause many concerns. The continued rhetoric (mostly political) about doing away with the fossil-fuel industry continues to be a sore spot with our company, our employees and our customers. The contributions made by the oil and gas industry have been the backbone of our economy for a very, very long time. All "they" want to focus on is some of the pitfalls of oil and gas exploration and production without looking at the great strides our industry has made in terms of efficiency, cost reduction and especially safety. Maybe "they" need to learn how much fossil-fuel products impact their everyday life.
- To add the additional costs to electrify equipment, the returns have to be there through higher prices or reduced costs. That is not the case in our segment.
- Our operations are far too mobile and fast paced to install the necessary electrical infrastructure for operations. Additionally, suppliers are currently not making electrical options for many of our types of machinery.
Additional Comments »
Historical data are available from first quarter 2016 to the most current release quarter.
Business Indicators: Quarter/Quarter
| Business Indicators: All Firms Current Quarter (versus previous quarter) | |||||
| Indicator | Current Index | Previous Index | % Reporting Increase | % Reporting No Change | % Reporting Decrease |
Level of Business Activity | –5.9 | 12.5 | 23.0 | 48.1 | 28.9 |
Capital Expenditures | –3.8 | 8.2 | 26.5 | 43.2 | 30.3 |
Supplier Delivery Time | –3.8 | –1.5 | 5.3 | 85.6 | 9.1 |
Employment | 2.9 | 2.9 | 18.5 | 65.9 | 15.6 |
Employee Hours | –2.3 | 8.1 | 16.8 | 64.1 | 19.1 |
Wages and Benefits | 18.6 | 24.0 | 23.0 | 72.6 | 4.4 |
| Indicator | Current Index | Previous Index | % Reporting Improved | % Reporting No Change | % Reporting Worsened |
Company Outlook | –12.1 | 10.0 | 17.7 | 52.4 | 29.8 |
| Indicator | Current Index | Previous Index | % Reporting Increase | % Reporting No Change | % Reporting Decrease |
Uncertainty | 48.6 | 24.1 | 57.4 | 33.8 | 8.8 |
| Business Indicators: E&P Firms Current Quarter (versus previous quarter) | |||||
| Indicator | Current Index | Previous Index | % Reporting Increase | % Reporting No Change | % Reporting Decrease |
Level of Business Activity | 0.0 | 14.5 | 24.2 | 51.6 | 24.2 |
Oil Production | 7.9 | 1.1 | 31.5 | 44.9 | 23.6 |
Natural Gas Wellhead Production | –13.3 | 2.3 | 21.1 | 44.4 | 34.4 |
Capital Expenditures | 0.0 | 10.2 | 28.9 | 42.2 | 28.9 |
Expected Level of Capital Expenditures Next Year | 12.1 | 16.9 | 36.3 | 39.6 | 24.2 |
Supplier Delivery Time | –4.5 | 1.1 | 3.4 | 88.8 | 7.9 |
Employment | 1.1 | 2.2 | 13.2 | 74.7 | 12.1 |
Employee Hours | 2.2 | 5.6 | 14.4 | 73.3 | 12.2 |
Wages and Benefits | 16.5 | 24.5 | 20.9 | 74.7 | 4.4 |
Finding and Development Costs | 9.9 | 15.7 | 23.1 | 63.7 | 13.2 |
Lease Operating Expenses | 21.3 | 23.6 | 30.3 | 60.7 | 9.0 |
| Indicator | Current Index | Previous Index | % Reporting Improved | % Reporting No Change | % Reporting Worsened |
Company Outlook | –14.8 | 16.8 | 14.8 | 55.6 | 29.6 |
| Indicator | Current Index | Previous Index | % Reporting Increase | % Reporting No Change | % Reporting Decrease |
Uncertainty | 52.7 | 18.9 | 60.4 | 31.9 | 7.7 |
| Business Indicators: O&G Support Services Firms Current Quarter (versus previous quarter) | |||||
| Indicator | Current Index | Previous Index | % Reporting Increase | % Reporting No Change | % Reporting Decrease |
Level of Business Activity | –18.1 | 8.5 | 20.5 | 40.9 | 38.6 |
Utilization of Equipment | –20.9 | 10.9 | 18.6 | 41.9 | 39.5 |
Capital Expenditures | –11.9 | 4.3 | 21.4 | 45.2 | 33.3 |
Supplier Delivery Time | –2.3 | –6.5 | 9.3 | 79.1 | 11.6 |
Lag Time in Delivery of Firm's Services | 4.7 | 4.4 | 7.0 | 90.7 | 2.3 |
Employment | 6.8 | 4.3 | 29.5 | 47.7 | 22.7 |
Employment Hours | –12.1 | 12.8 | 22.0 | 43.9 | 34.1 |
Wages and Benefits | 22.8 | 23.4 | 27.3 | 68.2 | 4.5 |
Input Costs | 23.3 | 42.2 | 32.6 | 58.1 | 9.3 |
Prices Received for Services | –2.3 | –4.4 | 16.7 | 64.3 | 19.0 |
Operating Margin | –32.6 | –13.0 | 11.6 | 44.2 | 44.2 |
| Indicator | Current Index | Previous Index | % Reporting Improved | % Reporting No Change | % Reporting Worsened |
Company Outlook | –6.9 | –2.1 | 23.3 | 46.5 | 30.2 |
| Indicator | Current Index | Previous Index | % Reporting Increase | % Reporting No Change | % Reporting Decrease |
Uncertainty | 40.0 | 34.0 | 51.1 | 37.8 | 11.1 |
Business Indicators: Year/Year
| Business Indicators: All Firms Current Quarter (versus same quarter a year ago) | |||||
| Indicator | Current Index | Previous Index | % Reporting Increase | % Reporting No Change | % Reporting Decrease |
Level of Business Activity | –2.3 | 16.7 | 35.2 | 27.3 | 37.5 |
Capital Expenditures | 7.2 | 10.1 | 38.9 | 29.4 | 31.7 |
Supplier Delivery Time | –4.8 | –5.4 | 12.0 | 71.2 | 16.8 |
Employment | 9.5 | 8.3 | 26.8 | 55.9 | 17.3 |
Employee Hours | 7.2 | 11.3 | 23.2 | 60.8 | 16.0 |
Wages and Benefits | 39.0 | 52.6 | 44.5 | 50.0 | 5.5 |
| Indicator | Current Index | Previous Index | % Reporting Improved | % Reporting No Change | % Reporting Worsened |
Company Outlook | –13.1 | 13.7 | 23.7 | 39.5 | 36.8 |
| Business Indicators: E&P Firms Current Quarter (versus same quarter a year ago) | |||||
| Indicator | Current Index | Previous Index | % Reporting Increase | % Reporting No Change | % Reporting Decrease |
Level of Business Activity | 7.0 | 18.6 | 37.6 | 31.8 | 30.6 |
Oil Production | 7.1 | 3.5 | 41.2 | 24.7 | 34.1 |
Natural Gas Wellhead Production | –17.1 | 2.3 | 26.8 | 29.3 | 43.9 |
Capital Expenditures | 7.1 | 1.2 | 38.1 | 31.0 | 31.0 |
Expected Level of Capital Expenditures Next Year | 17.8 | 10.3 | 45.2 | 27.4 | 27.4 |
Supplier Delivery Time | –4.9 | –7.0 | 12.0 | 71.1 | 16.9 |
Employment | 1.1 | 5.8 | 19.0 | 63.1 | 17.9 |
Employee Hours | 7.1 | 6.9 | 19.0 | 69.0 | 11.9 |
Wages and Benefits | 35.3 | 51.7 | 41.2 | 52.9 | 5.9 |
Finding and Development Costs | 14.2 | 11.6 | 32.1 | 50.0 | 17.9 |
Lease Operating Expenses | 36.9 | 38.0 | 50.0 | 36.9 | 13.1 |
| Indicator | Current Index | Previous Index | % Reporting Improved | % Reporting No Change | % Reporting Worsened |
Company Outlook | –9.4 | 15.0 | 23.0 | 44.6 | 32.4 |
| Business Indicators: O&G Support Services Firms Current Quarter (versus same quarter a year ago) | |||||
| Indicator | Current Index | Previous Index | % Reporting Increase | % Reporting No Change | % Reporting Decrease |
Level of Business Activity | –21.0 | 13.0 | 30.2 | 18.6 | 51.2 |
Utilization of Equipment | –20.0 | 9.1 | 25.0 | 30.0 | 45.0 |
Capital Expenditures | 7.2 | 26.7 | 40.5 | 26.2 | 33.3 |
Supplier Delivery Time | –4.8 | –2.2 | 11.9 | 71.4 | 16.7 |
Lag Time in Delivery of Firm's Services | –4.8 | 6.8 | 7.1 | 81.0 | 11.9 |
Employment | 25.6 | 13.1 | 41.9 | 41.9 | 16.3 |
Employment Hours | 7.3 | 19.6 | 31.7 | 43.9 | 24.4 |
Wages and Benefits | 46.5 | 54.4 | 51.2 | 44.2 | 4.7 |
Input Costs | 50.0 | 66.6 | 61.9 | 26.2 | 11.9 |
Prices Received for Services | 7.2 | 11.4 | 26.2 | 54.8 | 19.0 |
Operating Margin | –31.0 | –15.9 | 21.4 | 26.2 | 52.4 |
| Indicator | Current Index | Previous Index | % Reporting Improved | % Reporting No Change | % Reporting Worsened |
Company Outlook | –20.0 | 11.4 | 25.0 | 30.0 | 45.0 |
Activity Chart
Comments from Survey Respondents
These comments are from respondents’ completed surveys and have been edited for publication. Comments from the Special Questions survey can be found below the special questions.
Exploration and Production (E&P) Firms
- Recent volatility has started to impact planning discussions for 2025. We have not adjusted our plan yet, but we are starting to work on potential drilling plans for a lower commodity environment.
- The political uncertainty is not helping the market.
- The uncertainties due to legal assaults, cumbersome policies and invasive regulations create severe hurdles for small E&P operators.
- There is greater uncertainty surrounding the economy and the oil market. Much of this has to do with the election uncertainty and the anticipated impact on the overall market.
- Natural gas production in the Permian Basin is priced well below the futures market. Several of the past months I have received nothing or a negative adjustment to revenue for natural gas. In June, one operator paid $0.09 per million cubic feet, which is above $0, but accrues little to my revenue. I believe this situation will persist for months if not years.
- We are seeing natural gas prices affect drilling rig utilization in the East Texas Basin. The Eastern Haynesville drilling rig utilization is dropping off, and drilling rig utilization in the Western Haynesville/Bossier Sands play is increasing due to higher production rates being found there.
- Oil inventories are increasing, causing downward pressure on the per barrel price of oil. Instability in Ukraine and the Middle East are a cause for concern for long-term oil and gas deliveries, which OPEC is less influential on. My opinion would suggest an increased oil price in 2025.
- If we don't change from the current U.S. administration, oil prices and the oil industry will decline, and we'll become more dependent on foreign oil imports—hurting our economy and losing good-paying oil industry jobs.
- Turbulent commodity pricing markets, specifically WTI (West Texas Intermediate) crude oil and Henry Hub natural gas, do not allow for confident future performance projections when it comes to net income. Merger and acquisition (M&A) markets are sluggish with a lack of quality assets and lower deal volume by deal count. Large corporate mergers are leading the M&A space as assets are reshuffled and the larger companies try to create shareholder returns outside of the drill bit. We need a healthier M&A market to grow our company via acquisitions.
- The recession scare is front and center. The presidential election is a side show in terms of actual effects for most energy firms. As the Fed [Federal Reserve] cuts rates, the economy is either headed for a recession, which is bad news for oil, or somehow, we will manage the first soft landing in the history of the nation. For oil and gas companies, they will unfortunately be punished until the soft-landing outlook is actually in the rearview. No one wants to invest in oil and gas. Sentiment has thawed very slightly from zero investors interested to one or two on the margin. It is just brutal out there.
- Our company outlook could increase if the executive leadership shifts to conservative.
- The lack of investor interest in oil and gas exploration is an issue affecting our company. Another issue is a decrease in oil and gas revenues due to depletion and lower prices.
- Oilfield operating cost inflation is a major concern in the industry.
- Regulatory uncertainty and changes are affecting our company.
- The administration’s “death by a thousand cuts” keeps impacting my company in different quadrants. All are aimed at increasing the cost of doing business in oil and gas and aimed at keeping oil and gas independents from staying in business.
Oil and Gas Support Services Firms
- The consolidation and shutting down of oilfield service firms will hurt the ability of the U.S. to ramp up in the face of international supply disruptions.
- Lead times for electrical components (transformers, capacitor banks, reclosers) have increased from 10–12 weeks to 100–120 weeks, and costs are up 50–80 percent. There’s no way the projected increased demand for electricity (driven by data centers and/or artificial intelligence (AI)) will be achievable in the time frame projected.
- I think [there will be] no change until the election. Oil is down an alarming amount, but my clients have me busy.
- The current disconnect between oil price and physical supply is worrisome. Prices are not supportive of the long-term investments needed to maintain adequate supplies through the energy transition. As a result, the current underinvestment will lead to significant inventory shortfalls in the medium term, followed by rapid price escalation. It's going to be a very bumpy ride ... again.
- We are hearing and seeing a continued reining in of activity from our customers due to the uncertainty regarding the November elections. There is work out there, but it is just being held until there is some certainty regarding energy policy.
- Middle Eastern politics seem to play less and less of a factor in determining the price of oil, and the price more and more reflects worldwide economics.
- Consolidation of operators in the upstream sector continues to ripple through the service sector. Less continuity of work makes it hard to maintain skilled labor.
- Activity levels are up slightly, but the market still feels cautious. Whether the caution is driven by the continuous M&A or the election is unclear to us. As a smaller service company, the scale of the larger operators is making it more difficult to access goods for smaller operators than we have seen in the past.
Questions regarding the Dallas Fed Energy Survey can be addressed to Michael Plante at Michael.Plante@dal.frb.org or Kunal Patel at Kunal.Patel@dal.frb.org.
Sign up for our email alert to be automatically notified as soon as the latest Dallas Fed Energy Survey is released on the web.