Energy Indicators

| Energy dashboard (May 2025) | |||
| WTI price avg. May 27–30 |
WTI price change from 4 weeks prior |
Henry Hub price avg. May 27–30 |
Henry Hub price change from 4 weeks prior |
| $62.03/barrel | 1.16% | $3.01/MMBtu | -2.35% |
Texas solar power generation grew faster compared to other fuel types in 2024, although natural gas and wind generation continue to make up the highest shares of Texas’ electricity grid. As hurricane season begins, the Electric Reliability Council of Texas (ERCOT) has noted wind generation poses the biggest seasonal risk to reserves, but robust battery storage growth has lessened the risk of declaring an emergency energy alert. Solar and battery storage represent the largest newly completed and proposed U.S. capacity additions for 2025. Battery additions in Texas are projected to double the state’s storage capacity this year. U.S. EV (electric vehicle) sales continued to grow in 2024.
Electrical grid
Texas solar power grows rapidly
New power generation connected to the ERCOT grid grew 20 terawatt hours (TWh) year over year, totaling 464 TWh in 2024 (Chart 1). Solar generation has grown fastest in recent years, adding 16 TWh of power in 2024 to reach 48 TWh. Gas and wind generation each increased 4 TWh year over year while nuclear and coal generation dropped by 2 TWh and 3 TWh, respectively.
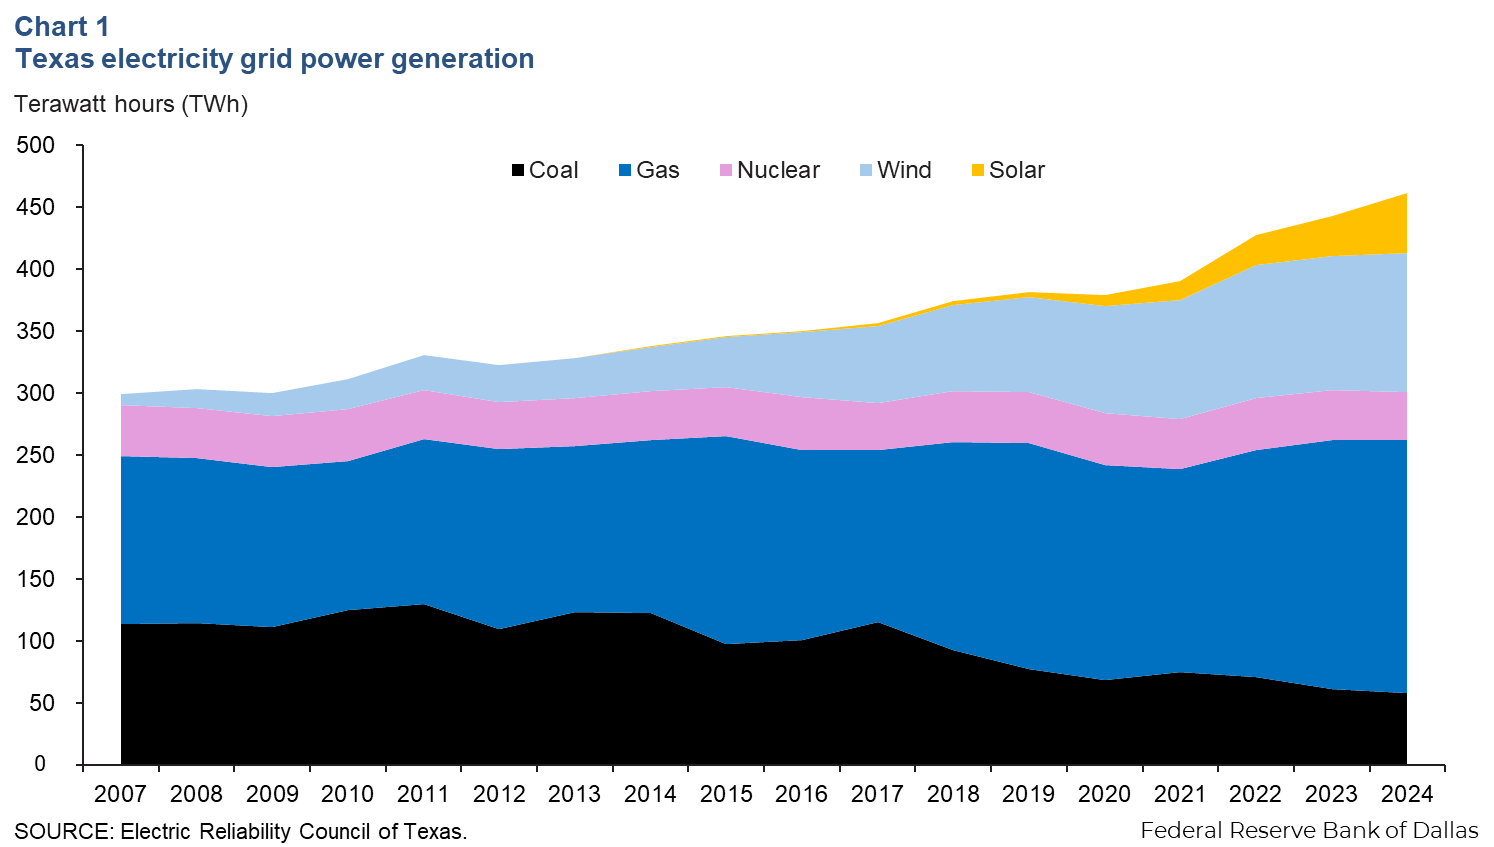
Natural gas generation accounts for the highest share of power on the Texas grid at 44.0 percent, followed by wind generation at 24.1 percent. Over the past 15 years, coal generation has largely been displaced by increases in natural gas generation.
ERCOT expects sufficient capacity for summer
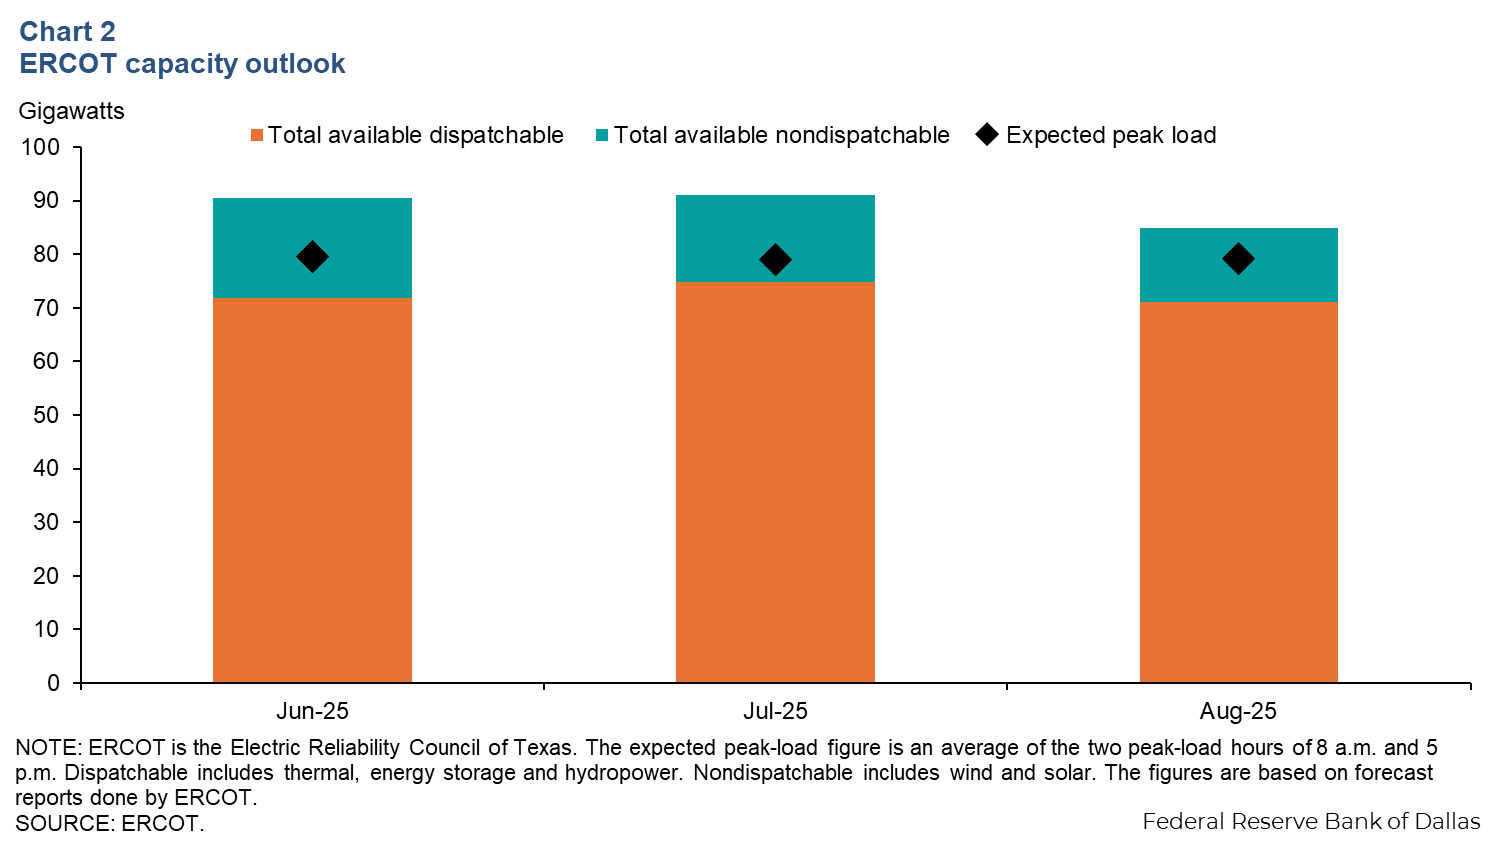
The peak load for the Texas grid is expected to be 79.6 gigawatts (GW) in June, then fall slightly to 79.0 in July. August’s peak load is expected to rise slightly to 79.2 GW (Chart 2). Total available dispatchable capacity (generation—including coal, nuclear, gas and energy storage—with some flexibility for volume adjustment as needed throughout the day) is set to increase 3 GW from June to July. From July to August, dispatchable capacity is set to fall approximately 4 GW.
ERCOT projects availability of sufficient generation for the hours where reserve shortage risk is highest in June, July and August. The risk of an Energy Emergency Alert from ERCOT is also reduced for these months. ERCOT cites low wind production as a significant risk factor for reserves, but robust battery capacity growth has reduced that risk significantly.
Solar, battery storage capacity growth outpaces other fuel types
Roughly half of new U.S. planned grid additions in 2025 are solar, while another 30 percent will come from battery storage additions. For Texas, new additions in 2025 are forecast to be 54 percent solar and 35 percent battery storage (Chart 3). Texas is projected to account for 35 percent of new U.S. power additions, but recent federal policy changes and proposed legislation may affect planned capacity expansions.
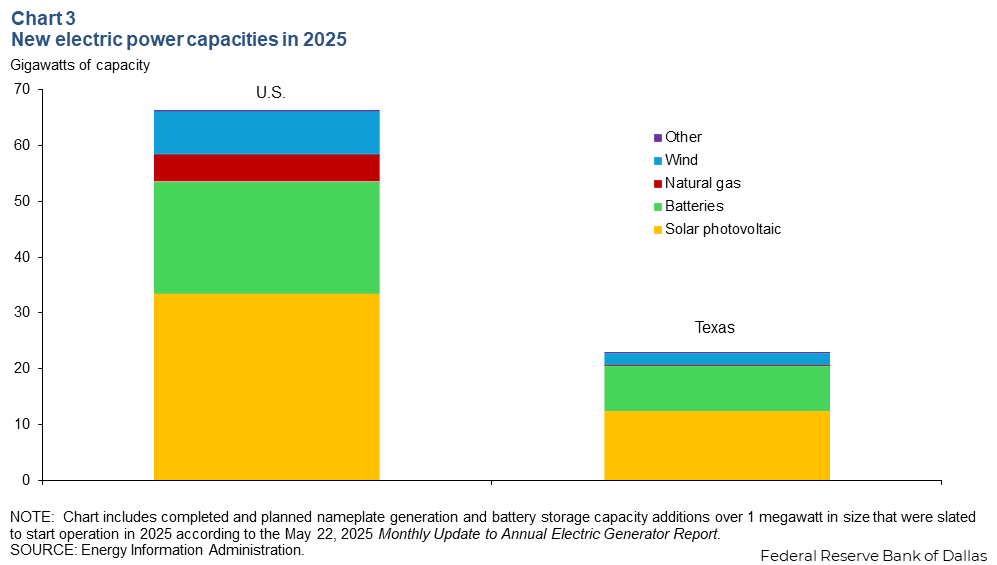
For clarity, this doesn’t mean the U.S. will see a 65 GW increase in generation this year. Realized output is always significantly less that nameplate capacity. Solar has a national average capacity factor (actual output divided by total capacity) of 24 percent, while natural gas has a capacity factor of 57 percent. Average capacity factor can vary from region to region, and even within types of generation such as natural gas, depending on age and type of technology deployed.
Batteries and EVs
Planned 2025 additions would double battery capacity in Texas
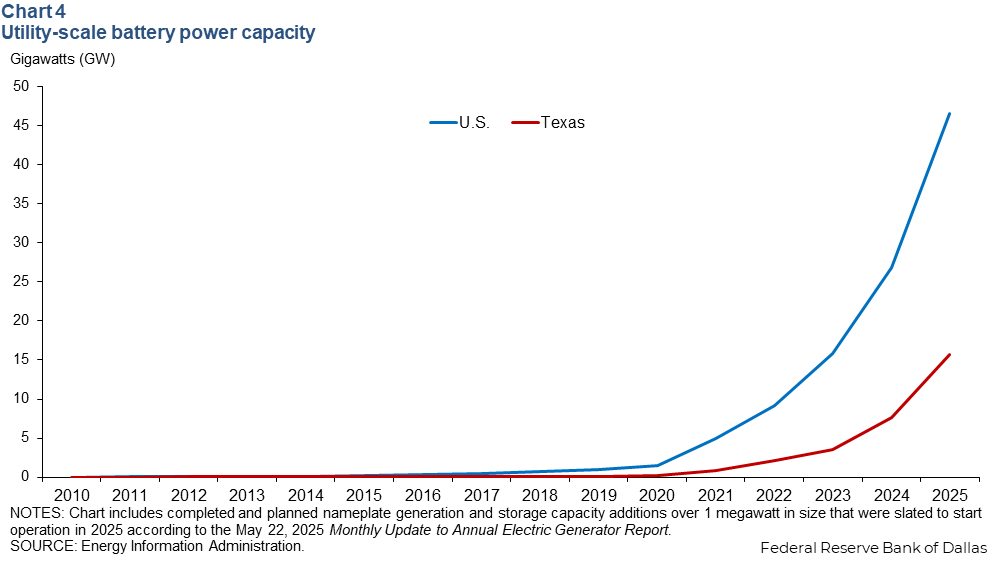
Total utility-scale battery storage capacity for the U.S. is set to rise 19.8 GW or 73 percent in 2025. Out of that increase, Texas is slated to more than double its capacity with an additional 8.0 GW of new battery installations by year end 2025 (Chart 4). However, certain legislative actions could dampen this growth, particularly the elimination of subsidies offered through the Inflation Reduction Act in 2022.
Electric vehicle sales rise in China, remain flat in U.S.
U.S. electric vehicle (EV) sales grew 7 percent year over year, notching 1.5 million sales for 2024 as Chinese EV sales increased 40 percent year over year to 11.3 million sales for 2024 (Chart 5). European countries remained stable with the same amount as 2023, 3.2 million in sales. The U.S. Energy Information Administration reported battery electric and plug-in vehicle sales in the U.S. fell for the first quarter of 2025.
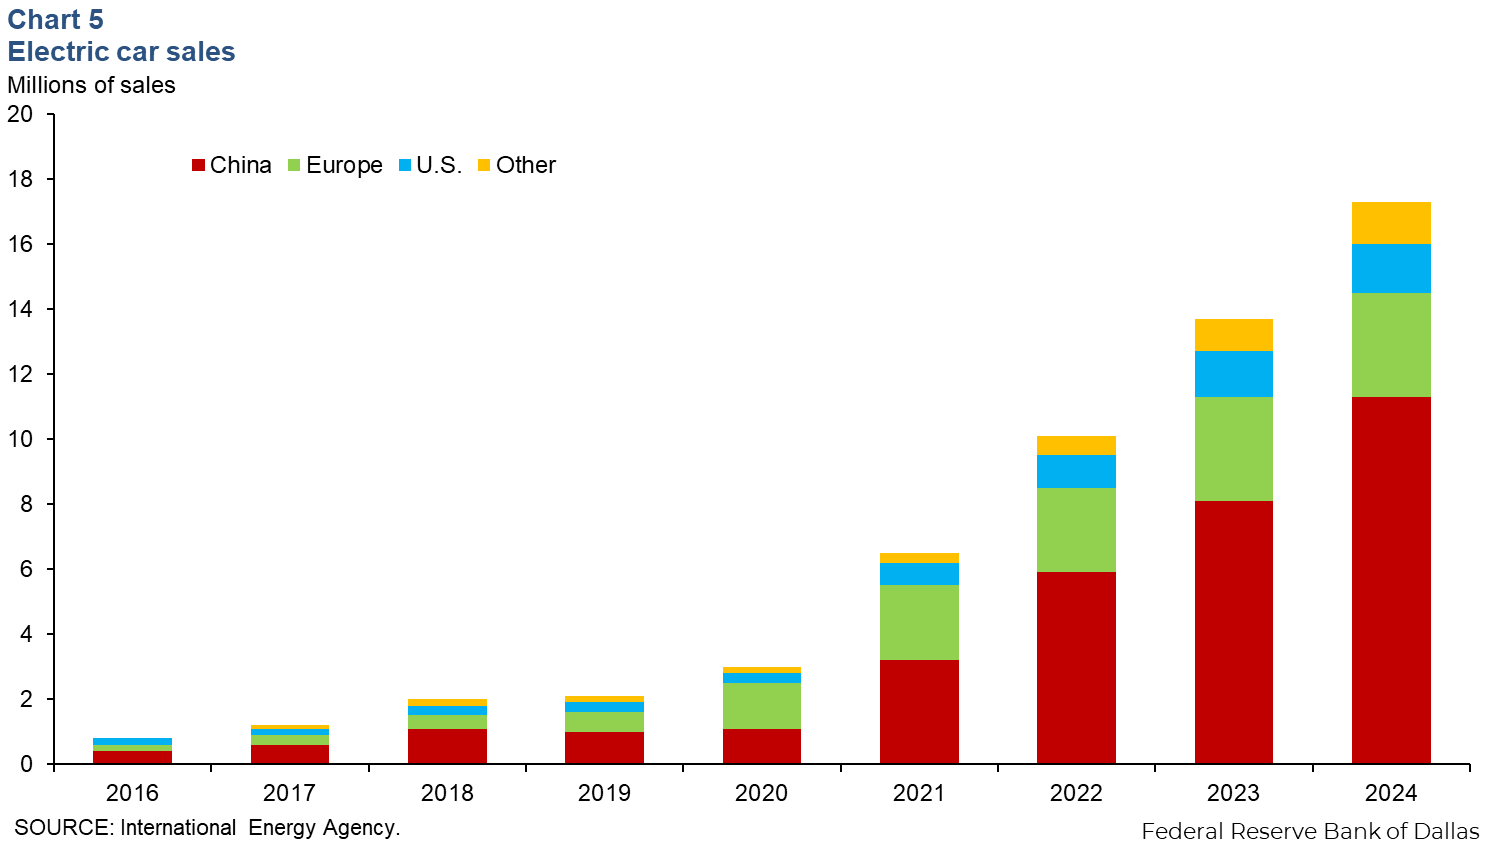
The International Energy Agency (IEA) reported in its Global EV Outlook that China is expected to achieve a sales share of around 80 percent by 2030 under the IEA’s policy assumptions as of May 2025. Europe saw a decline in growth as subsidy programs and supportive policies were phased out. Excluding the Chinese, European and American markets, the IEA reported a record increase of approximately 40% in EV sales worldwide.
About Energy Indicators
Questions can be addressed to Sasha Samperio at sasha.samperio@dal.frb.org. Energy Indicators is released monthly and can be received by signing up for an email alert. For additional energy-related research, please visit the Dallas Fed’s energy home page.