Energy Indicators

| Energy dashboard (June 2025) | |||
| WTI price avg. June 2–6 |
WTI price change from 4 weeks prior |
Henry Hub price avg. June 2–6 |
Henry Hub price change from 4 weeks prior |
| $64.06/barrel | -11.21% | $2.83/MMBtu | 6.07% |
Retail gasoline and diesel prices continue to decline. Motor gasoline consumption remains in line with historic trends, and distillate fuel consumption dipped significantly in the first half of 2025. Natural gas liquids production continues to grow, as do exports.
Consumption
Retail gasoline and diesel prices decline
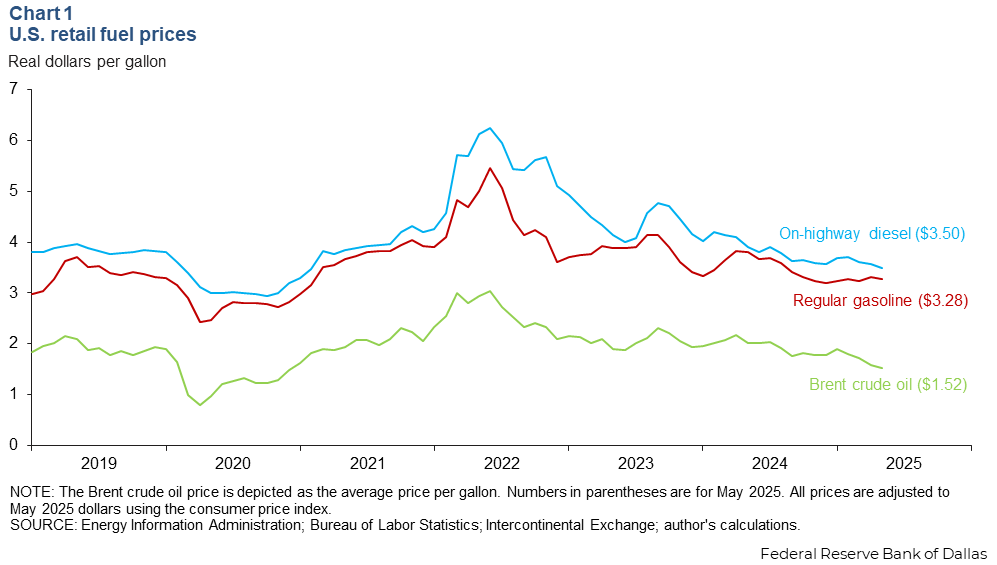
Real retail fuel prices for on-highway diesel, regular gasoline and Brent crude declined year over year in May 2025 (Chart 1). On-highway diesel’s monthly average price per gallon was $3.50 for May, down 11 percent year over year after adjusting for inflation. Regular gasoline’s average price was $3.28 per gallon, a drop of 14 percent year over year. For context, the price of Brent crude oil per gallon averaged $1.52, a drop of 24 percent year over year. Crude makes up roughly half of the retail price of motor fuels.
U.S. motor gasoline consumption in-line with average
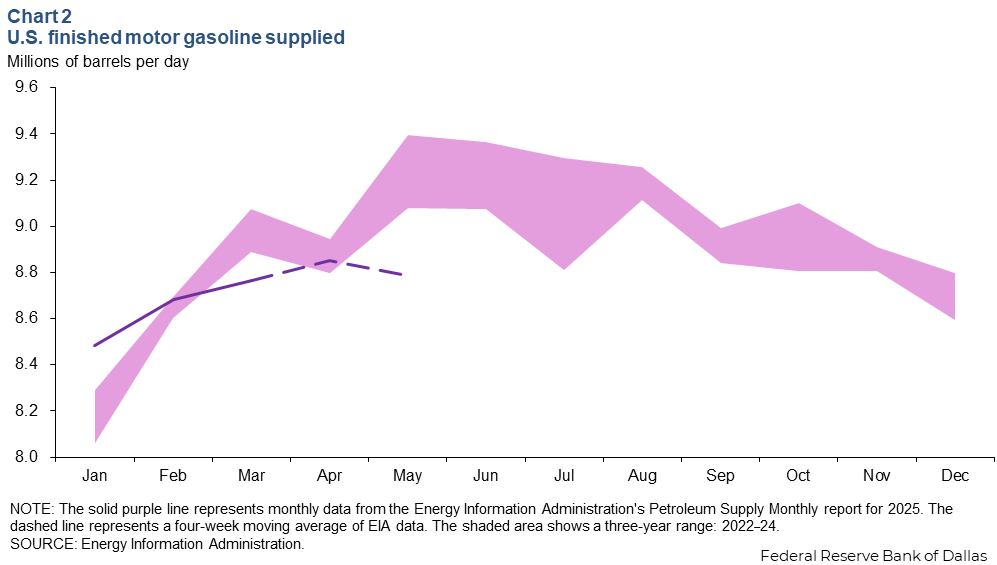
The monthly product supplied for finished motor gasoline in the U.S., a proxy for consumption, has stayed near the three-year range in 2025 (Chart 2). In March, however, consumption softened to 8.8 million barrels per day (mb/d), or 0.2 mb/d below the three-year average for that month. Since March, weekly estimates for consumption indicate motor gasoline supplied rose 0.1 mb/d in April and fell slightly back in May, down 0.1 mb/d, totaling 8.8 mb/d for May.
Distillate fuel consumption falls in first half of 2025
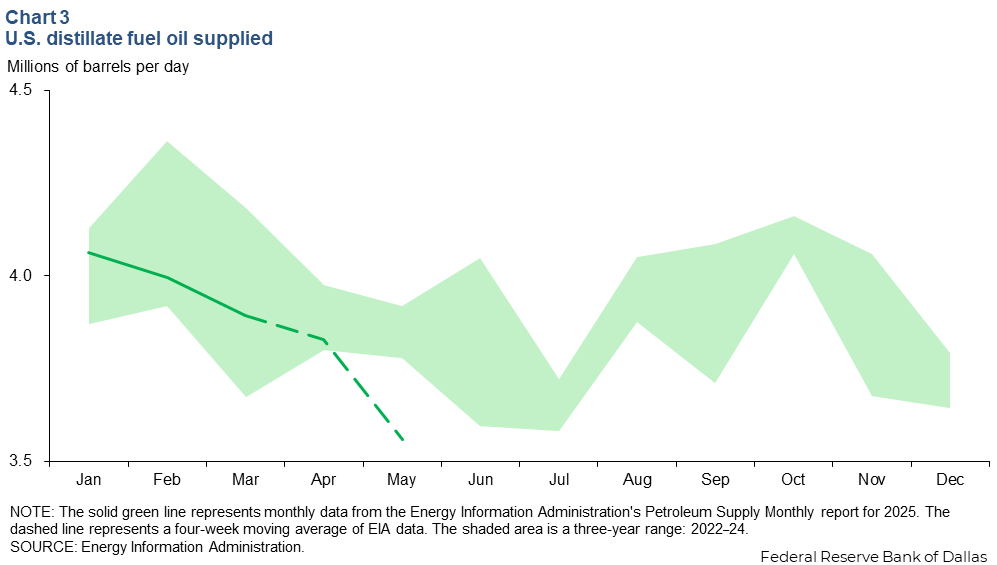
Distillate fuel consumption has fallen sharply in the first half of 2025, particularly in May (Chart 3). In March, 3.9 mb/d of distillate was supplied, in-line with the three-year average. In April, data began to weaken and consumption for May 2025 slipped 0.3 mb/d to 3.6 mb/d.
Natural gas liquids
NGL production continues to rise
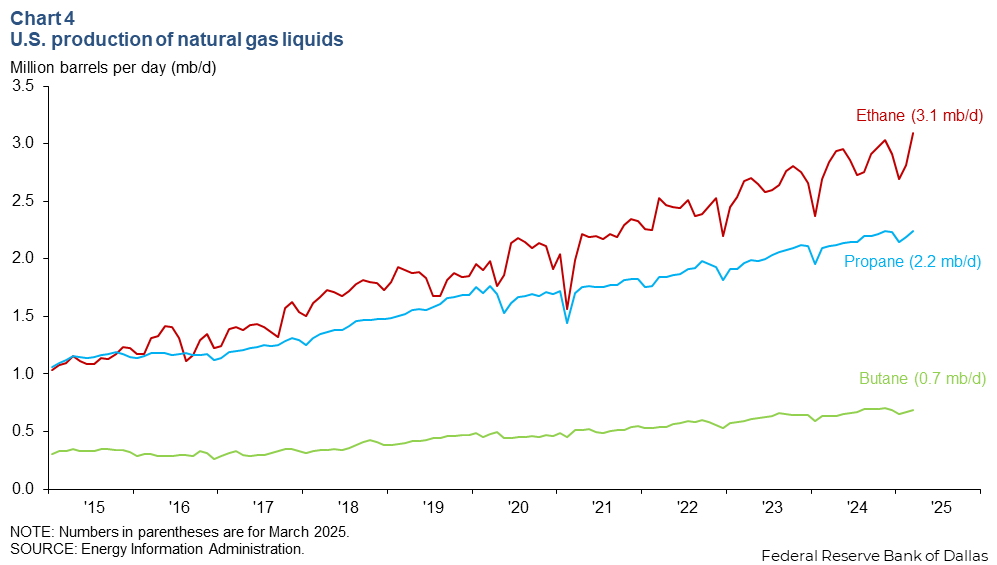
U.S. ethane production increased 9 percent year to date in March 2025 to 3.1 mb/d, propane grew 6 percent during that time period to 2.2 mb/d, and butane rose 8 percent to 0.7 mb/d (Chart 4). Collectively called natural gas liquids (NGLs), these molecules have a wide range of uses such as inputs for petrochemical production and refining, general heating and cooking.
NGL exports trend higher
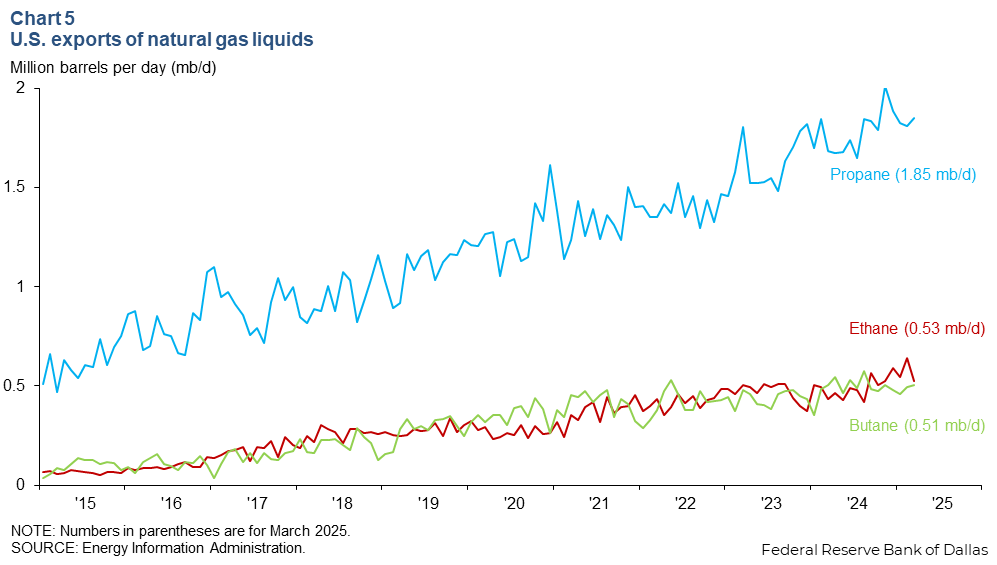
Exports of propane reached 1.85 mb/d in March 2025, up 9.8 percent from a year earlier. Ethane rose even more strongly, up 21 percent to 0.53 mb/d, while butane exports were flat, rising 0.2 percent to 0.51 mb/d (Chart 5). The Energy Information Administration forecasts a decrease in ethane exports for this year as the U.S. prohibits the shipment of ethane to China, which made up 47 percent of U.S. ethane exports in 2024.
Ethane exports to China from the U.S. are under pressure due to trade tensions between the two countries since the end of May, and alternative sources of demand internationally are limited. The most recent export data show 39.1 percent of U.S. ethane exports go to China.
What ethane isn’t exported or consumed in petrochemical manufacture is blended into the natural gas piped to consumers here in the U.S. All else equal, adding ethane supplies to natural gas volumes puts downward pressure on natural gas prices, including the Waha hub price in west Texas. Waha has struggled to stay above $0 per MMBtu the past few years, and lower prices would exacerbate challenges the producers face.
About Energy Indicators
Questions can be addressed to Sasha Samperio at sasha.samperio@dal.frb.org. Energy Indicators is released monthly and can be received by signing up for an email alert. For additional energy-related research, please visit the Dallas Fed’s energy home page.