Austin Economic Indicators

September 2, 2021
The Austin economy accelerated in July. The Austin Business-Cycle Index grew at a strong pace, led by declines in the unemployment rate and recent broad-based job gains. COVID-19 hospitalizations surged to an all-time high. Existing-home sales fell in July for the second consecutive month, and regional consumer spending remained healthy.
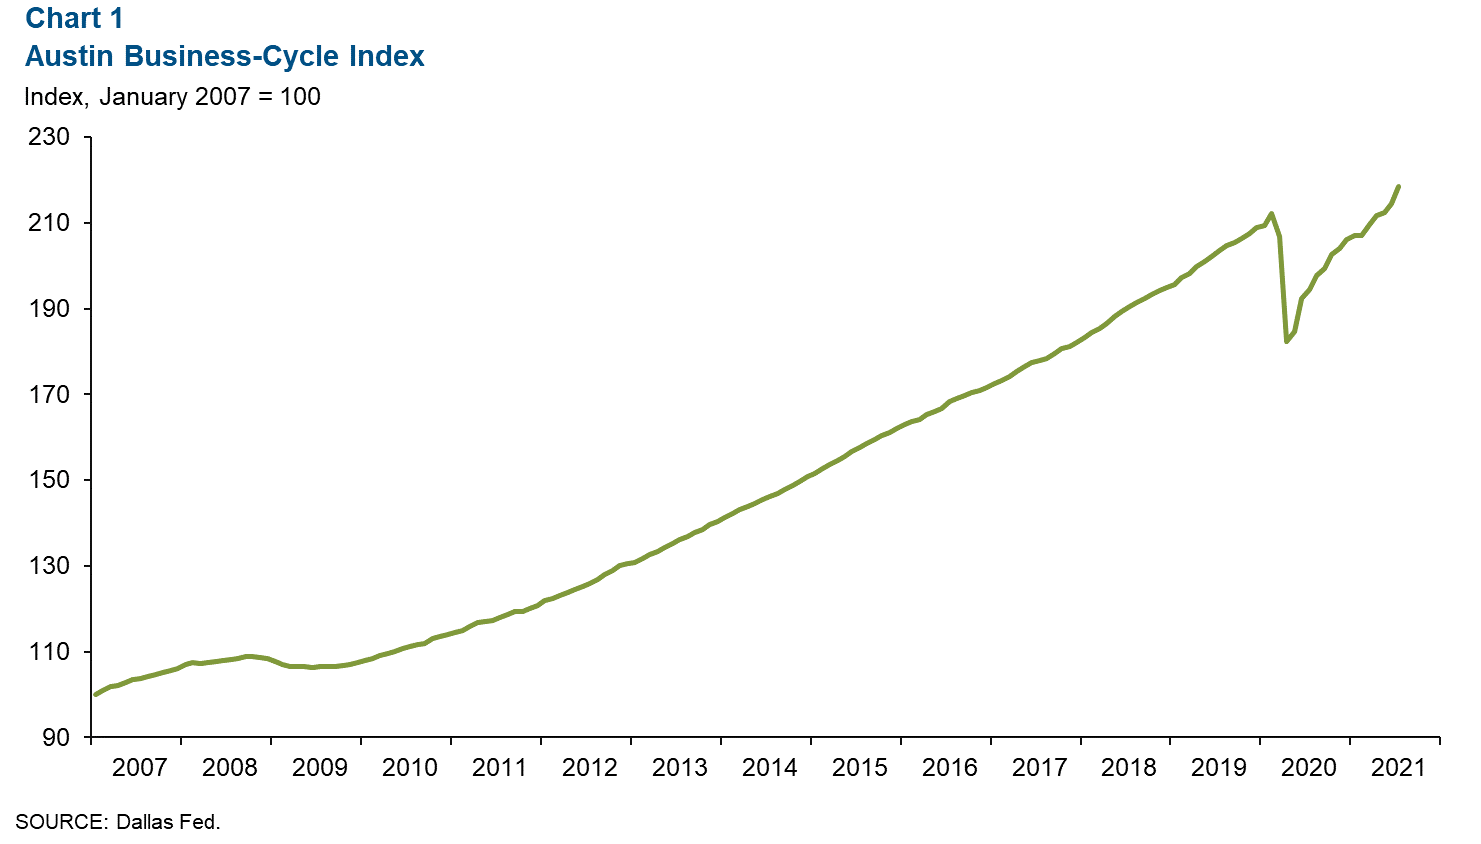
Business-Cycle Index
The Austin Business-Cycle Index—a broad measure of economic activity—expanded a robust 23.9 percent in July after increasing 12.6 percent in June. Recent strength in the economy can be attributed to job gains and unemployment rate declines. With the exception of February 2021, the index has posted positive growth since May 2020, which suggests continued strength in the Austin economy (Chart 1).
Labor Market
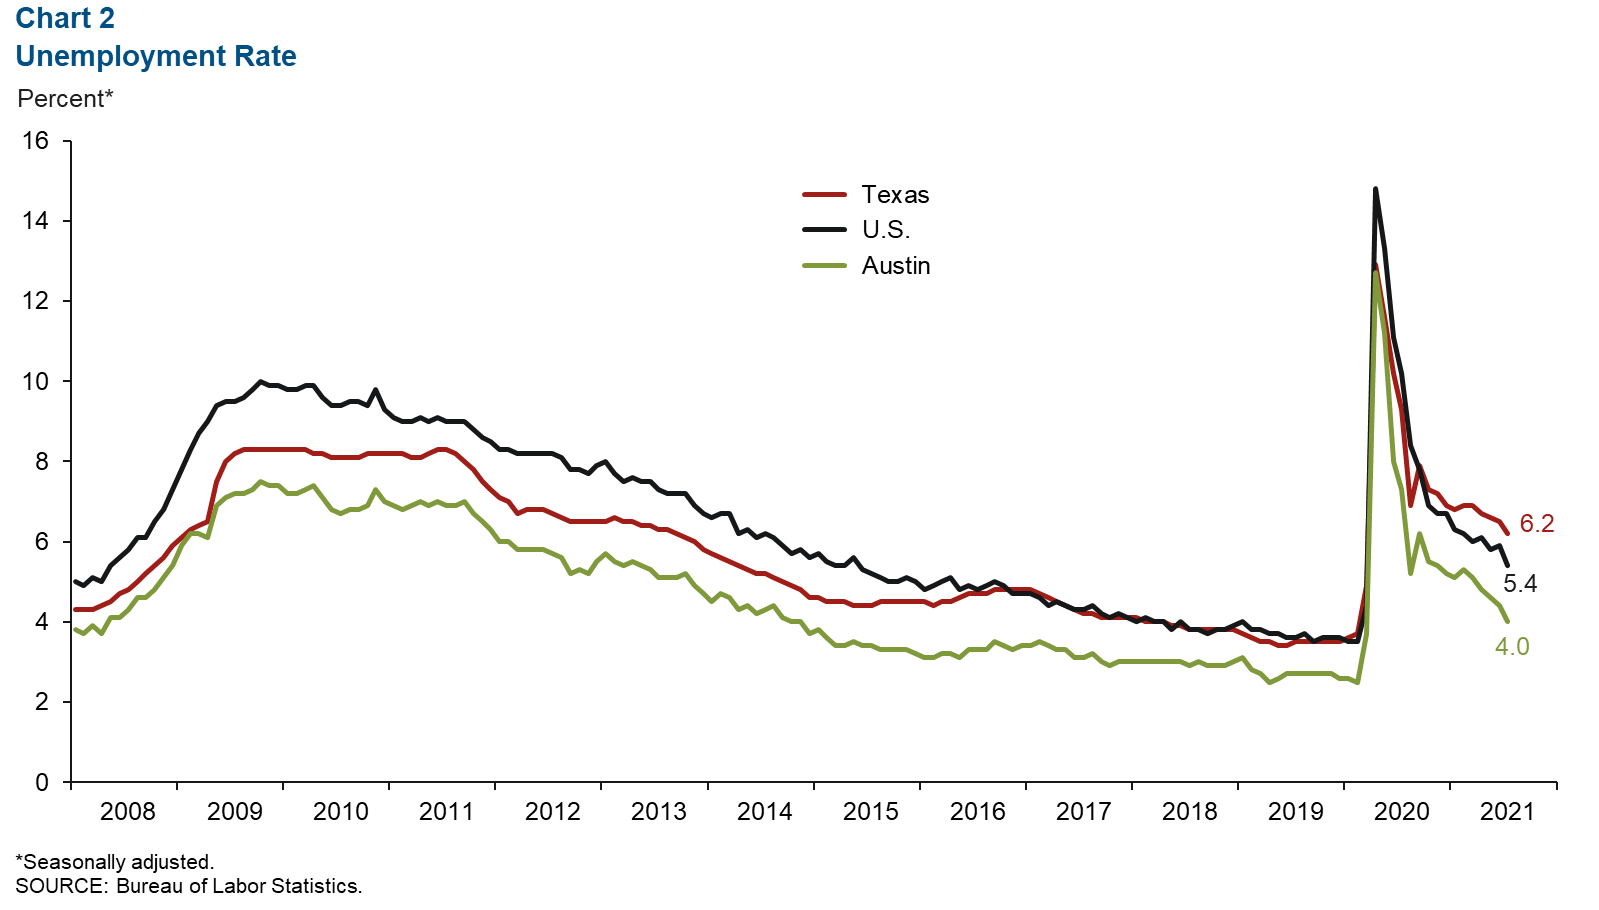
Unemployment Rate Falls
Austin’s unemployment rate continued to decrease in July to 4.0 percent, the lowest level since March 2020 (Chart 2). This is well below the state’s jobless rate of 6.2 percent and the nation’s 5.4 percent rate.
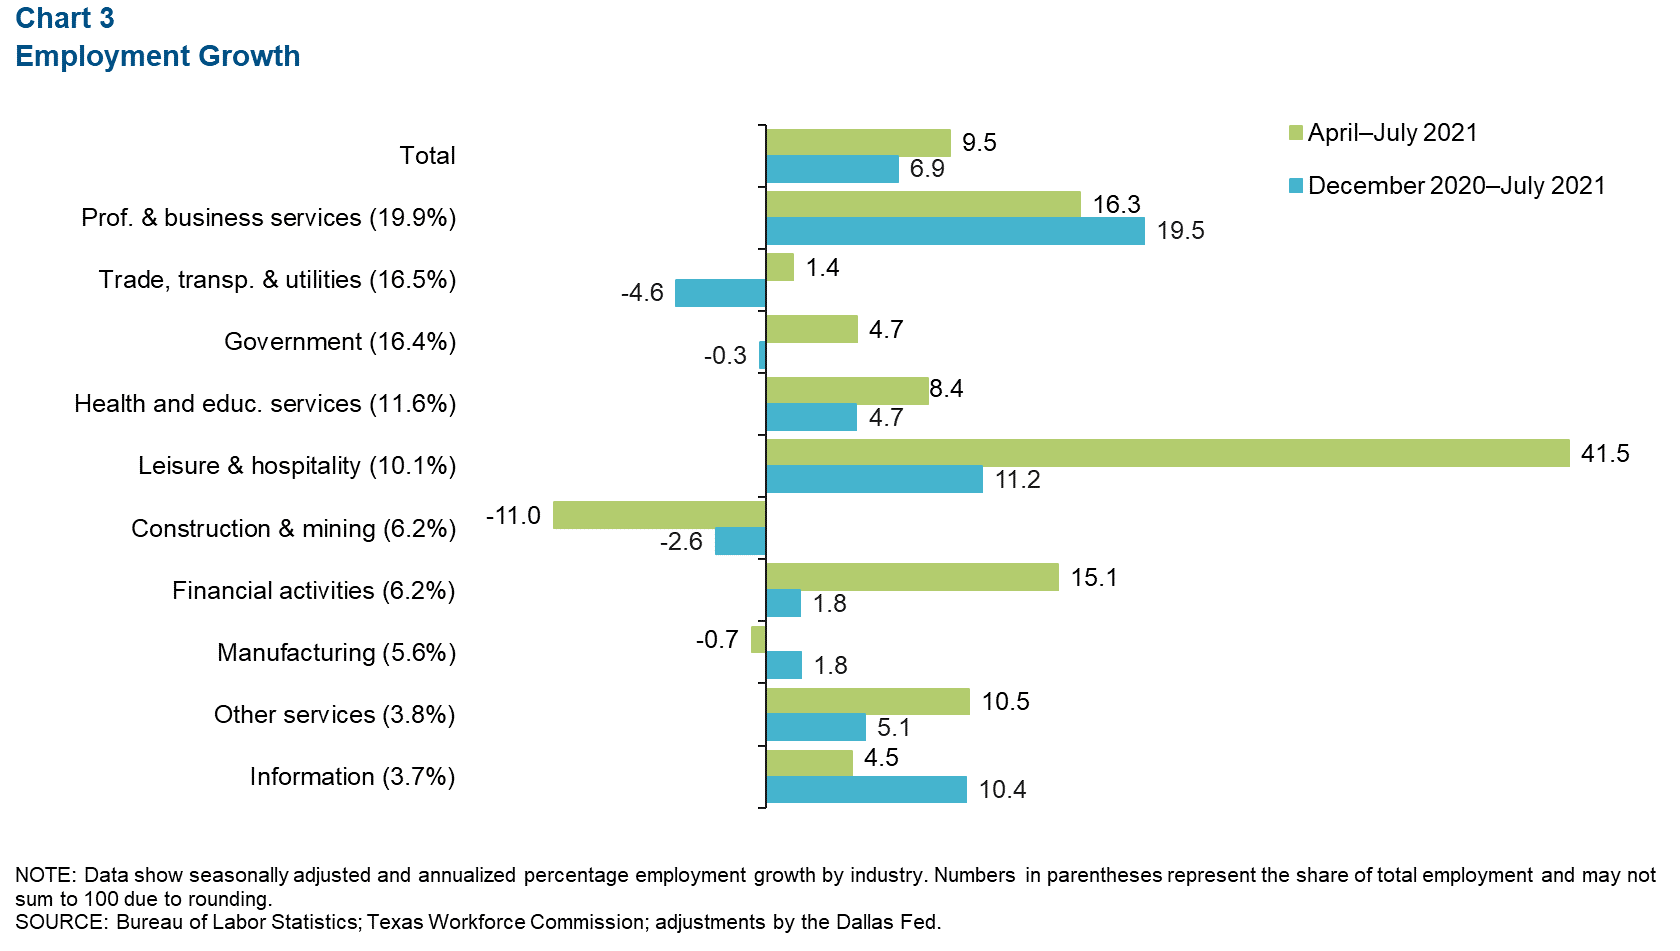
Recent Job Growth Positive in Most Sectors
Austin payrolls expanded an annualized 9.5 percent, or 26,000 net jobs, in the three months ending in July (Chart 3). Leisure and hospitality led job growth (41.5 percent, or 10,085 jobs), followed by professional and business services (16.3 percent, or 8,545 jobs), and financial activities (15.1 percent, or 2,520 jobs). The only sectors that posted net job losses were construction and mining (-11.0 percent, or 2,070 jobs), and manufacturing (-0.7 percent, of 110 jobs). As of July, the 140,287 jobs lost at the onset of the pandemic in March and April 2020 have been fully recovered, and payrolls have surpassed prepandemic levels.
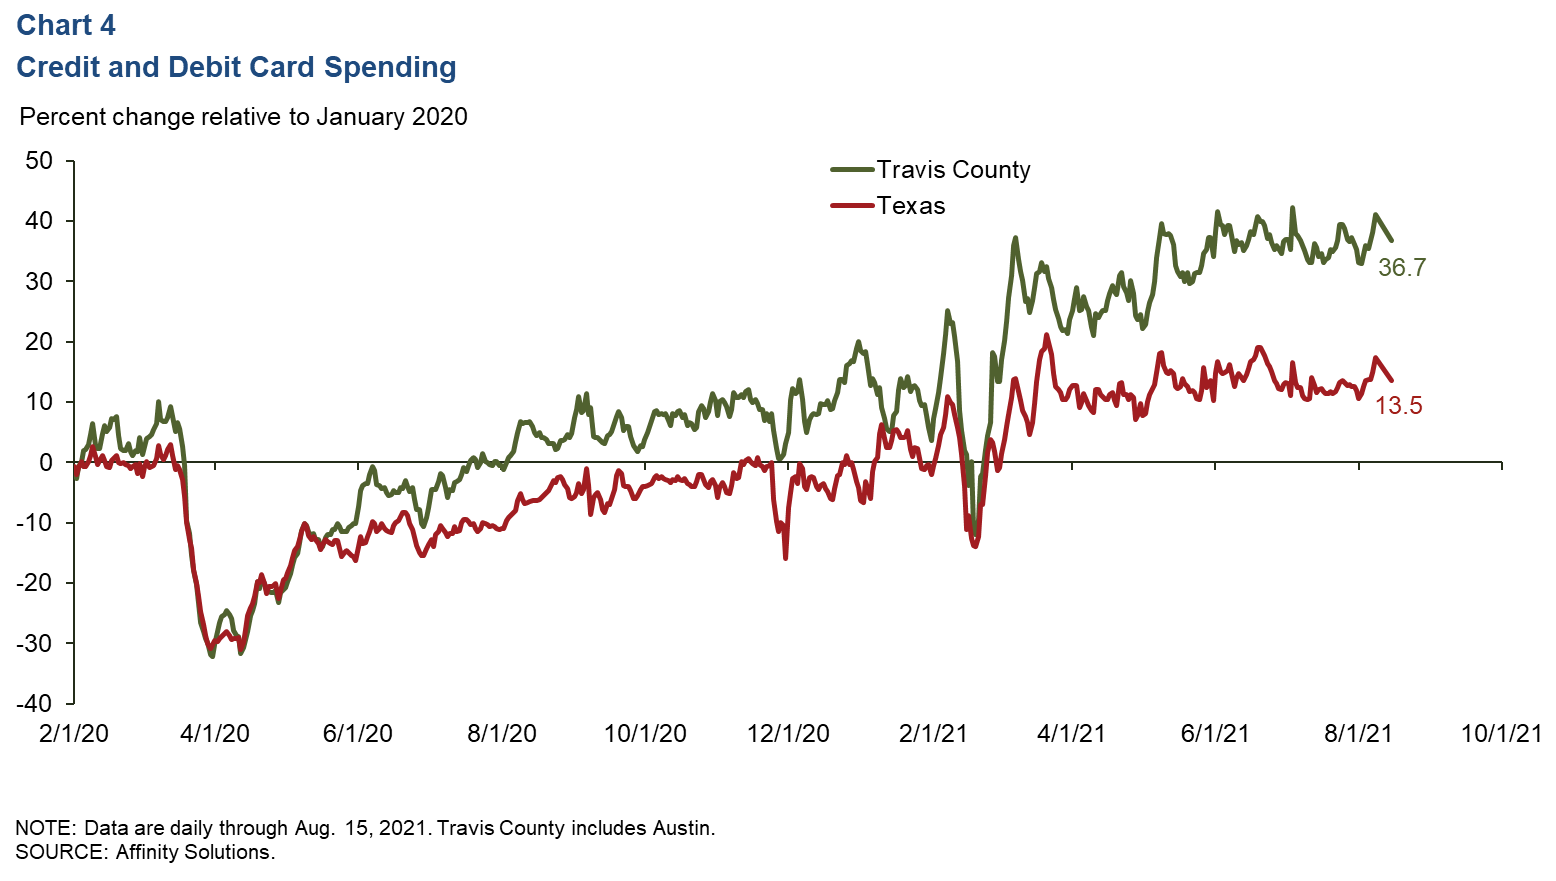
Consumer Spending
Strength in consumer spending in Austin has continued in recent weeks. In the metro’s most-populous county, Travis, credit and debit card spending has consistently surpassed January 2020 levels since last July, except for a dip in late November 2020 and during Winter Storm Uri in mid-February this year. As of Aug. 15, 2021, spending in the county was up a robust 36.7 percent relative to January 2020, while spending in Texas was up 13.5 percent (Chart 4).
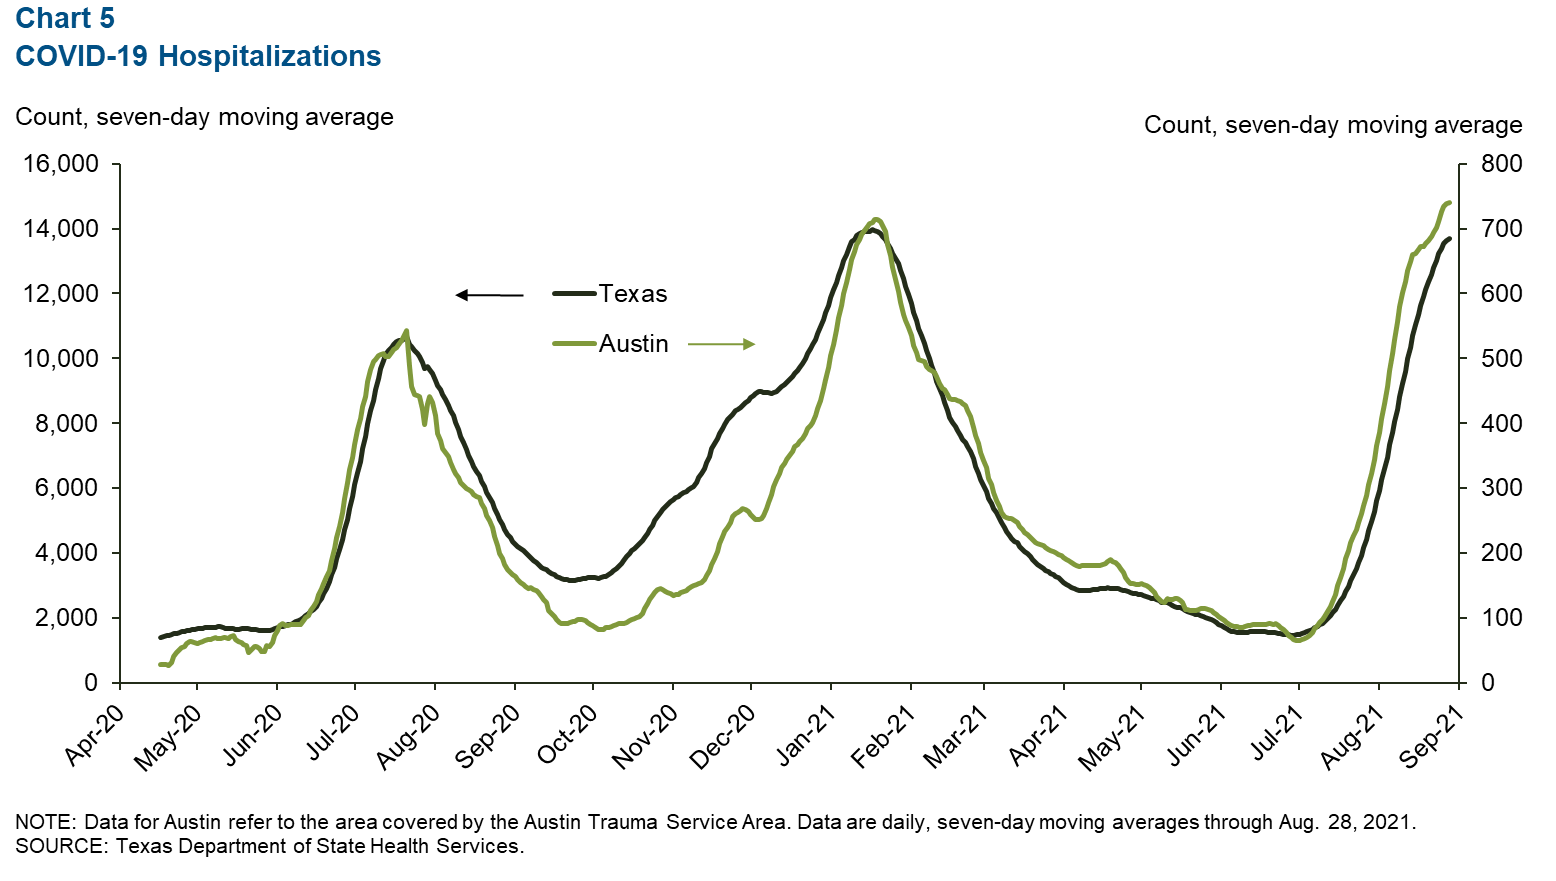
COVID-19 Statistics
The number of people currently hospitalized with COVID-19 in Austin has continued to surge since its sharp rise in early July (Chart 5). As of Aug. 28, there were 741 people hospitalized in Austin, the highest number since the pandemic began. In the state, 13,707 people were hospitalized, the highest level since late January.
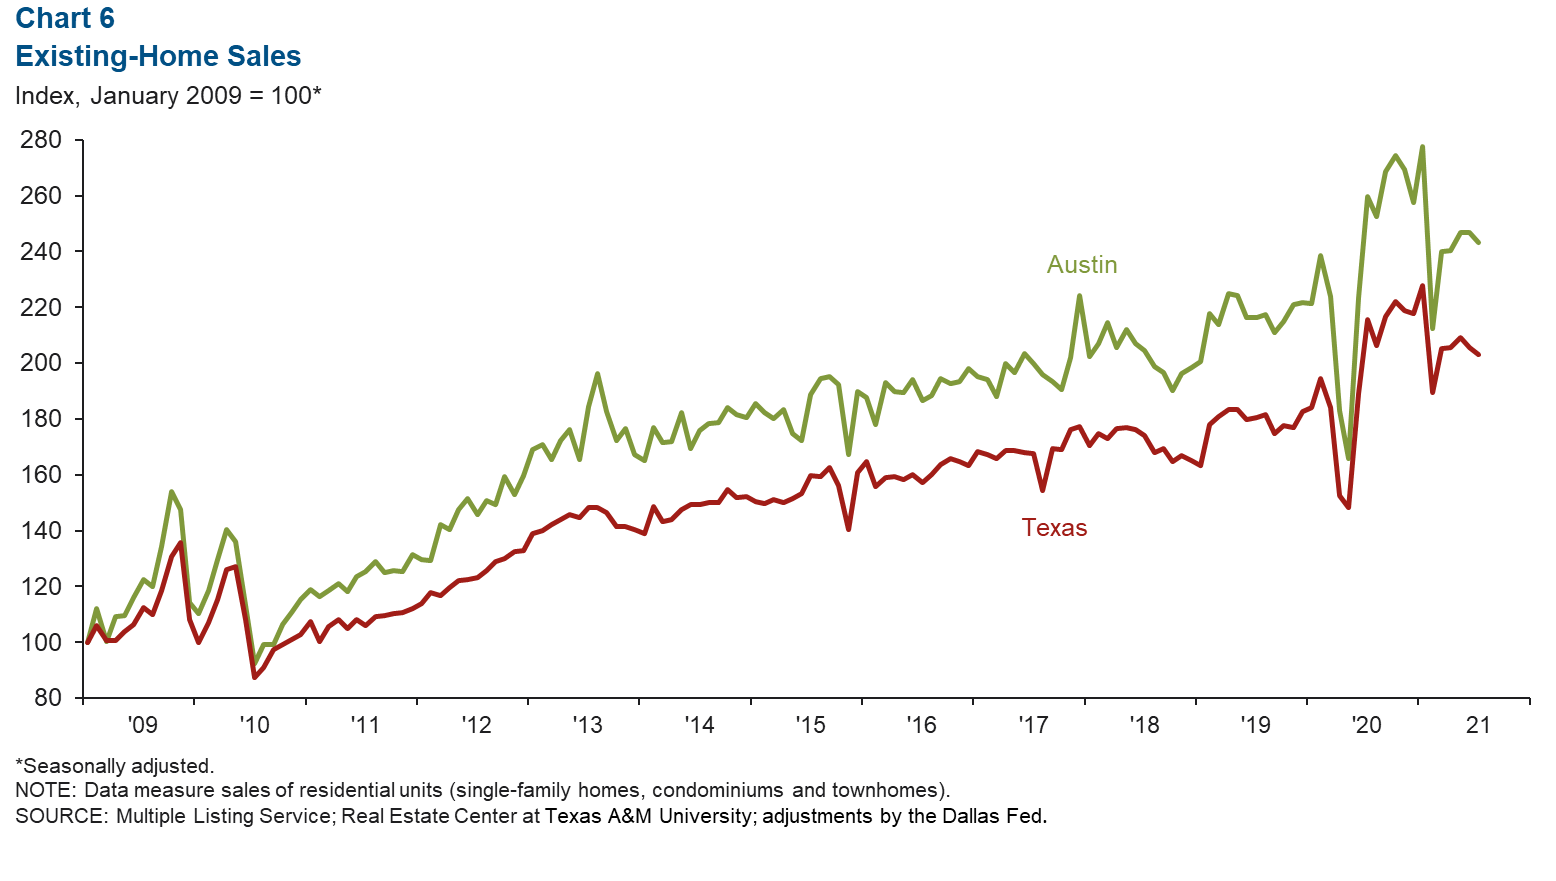
Real Estate
Existing-home sales in Austin contracted 1.3 percent in July after a minor 0.1 percent decline in June (Chart 6). This compares with a 1.3 percent decrease in the state in July after a 1.7 percent tapering in June. Nonetheless, in the first seven months of the year, metro home sales were up 12.6 percent relative to the same period in 2020. At the state level, sales were up 14.0 percent for that period. In July, the median price of homes sold was $465,262 in the metro, a 29.9 percent rise year over year, compared with $301,580 in Texas—a 10.0 percent increase.
NOTE: Data may not match previously published numbers due to revisions.
About Austin Economic Indicators
Questions can be addressed to Judy Teng at judy.teng@dal.frb.org. Austin Economic Indicators is released on the first Thursday of every month.