Austin Economic Indicators

November 3, 2022
Austin’s economy expanded in September as the Austin Business-Cycle grew, most sectors experienced job growth, wages improved, and the unemployment rate declined. Existing-home price growth is also slowing.
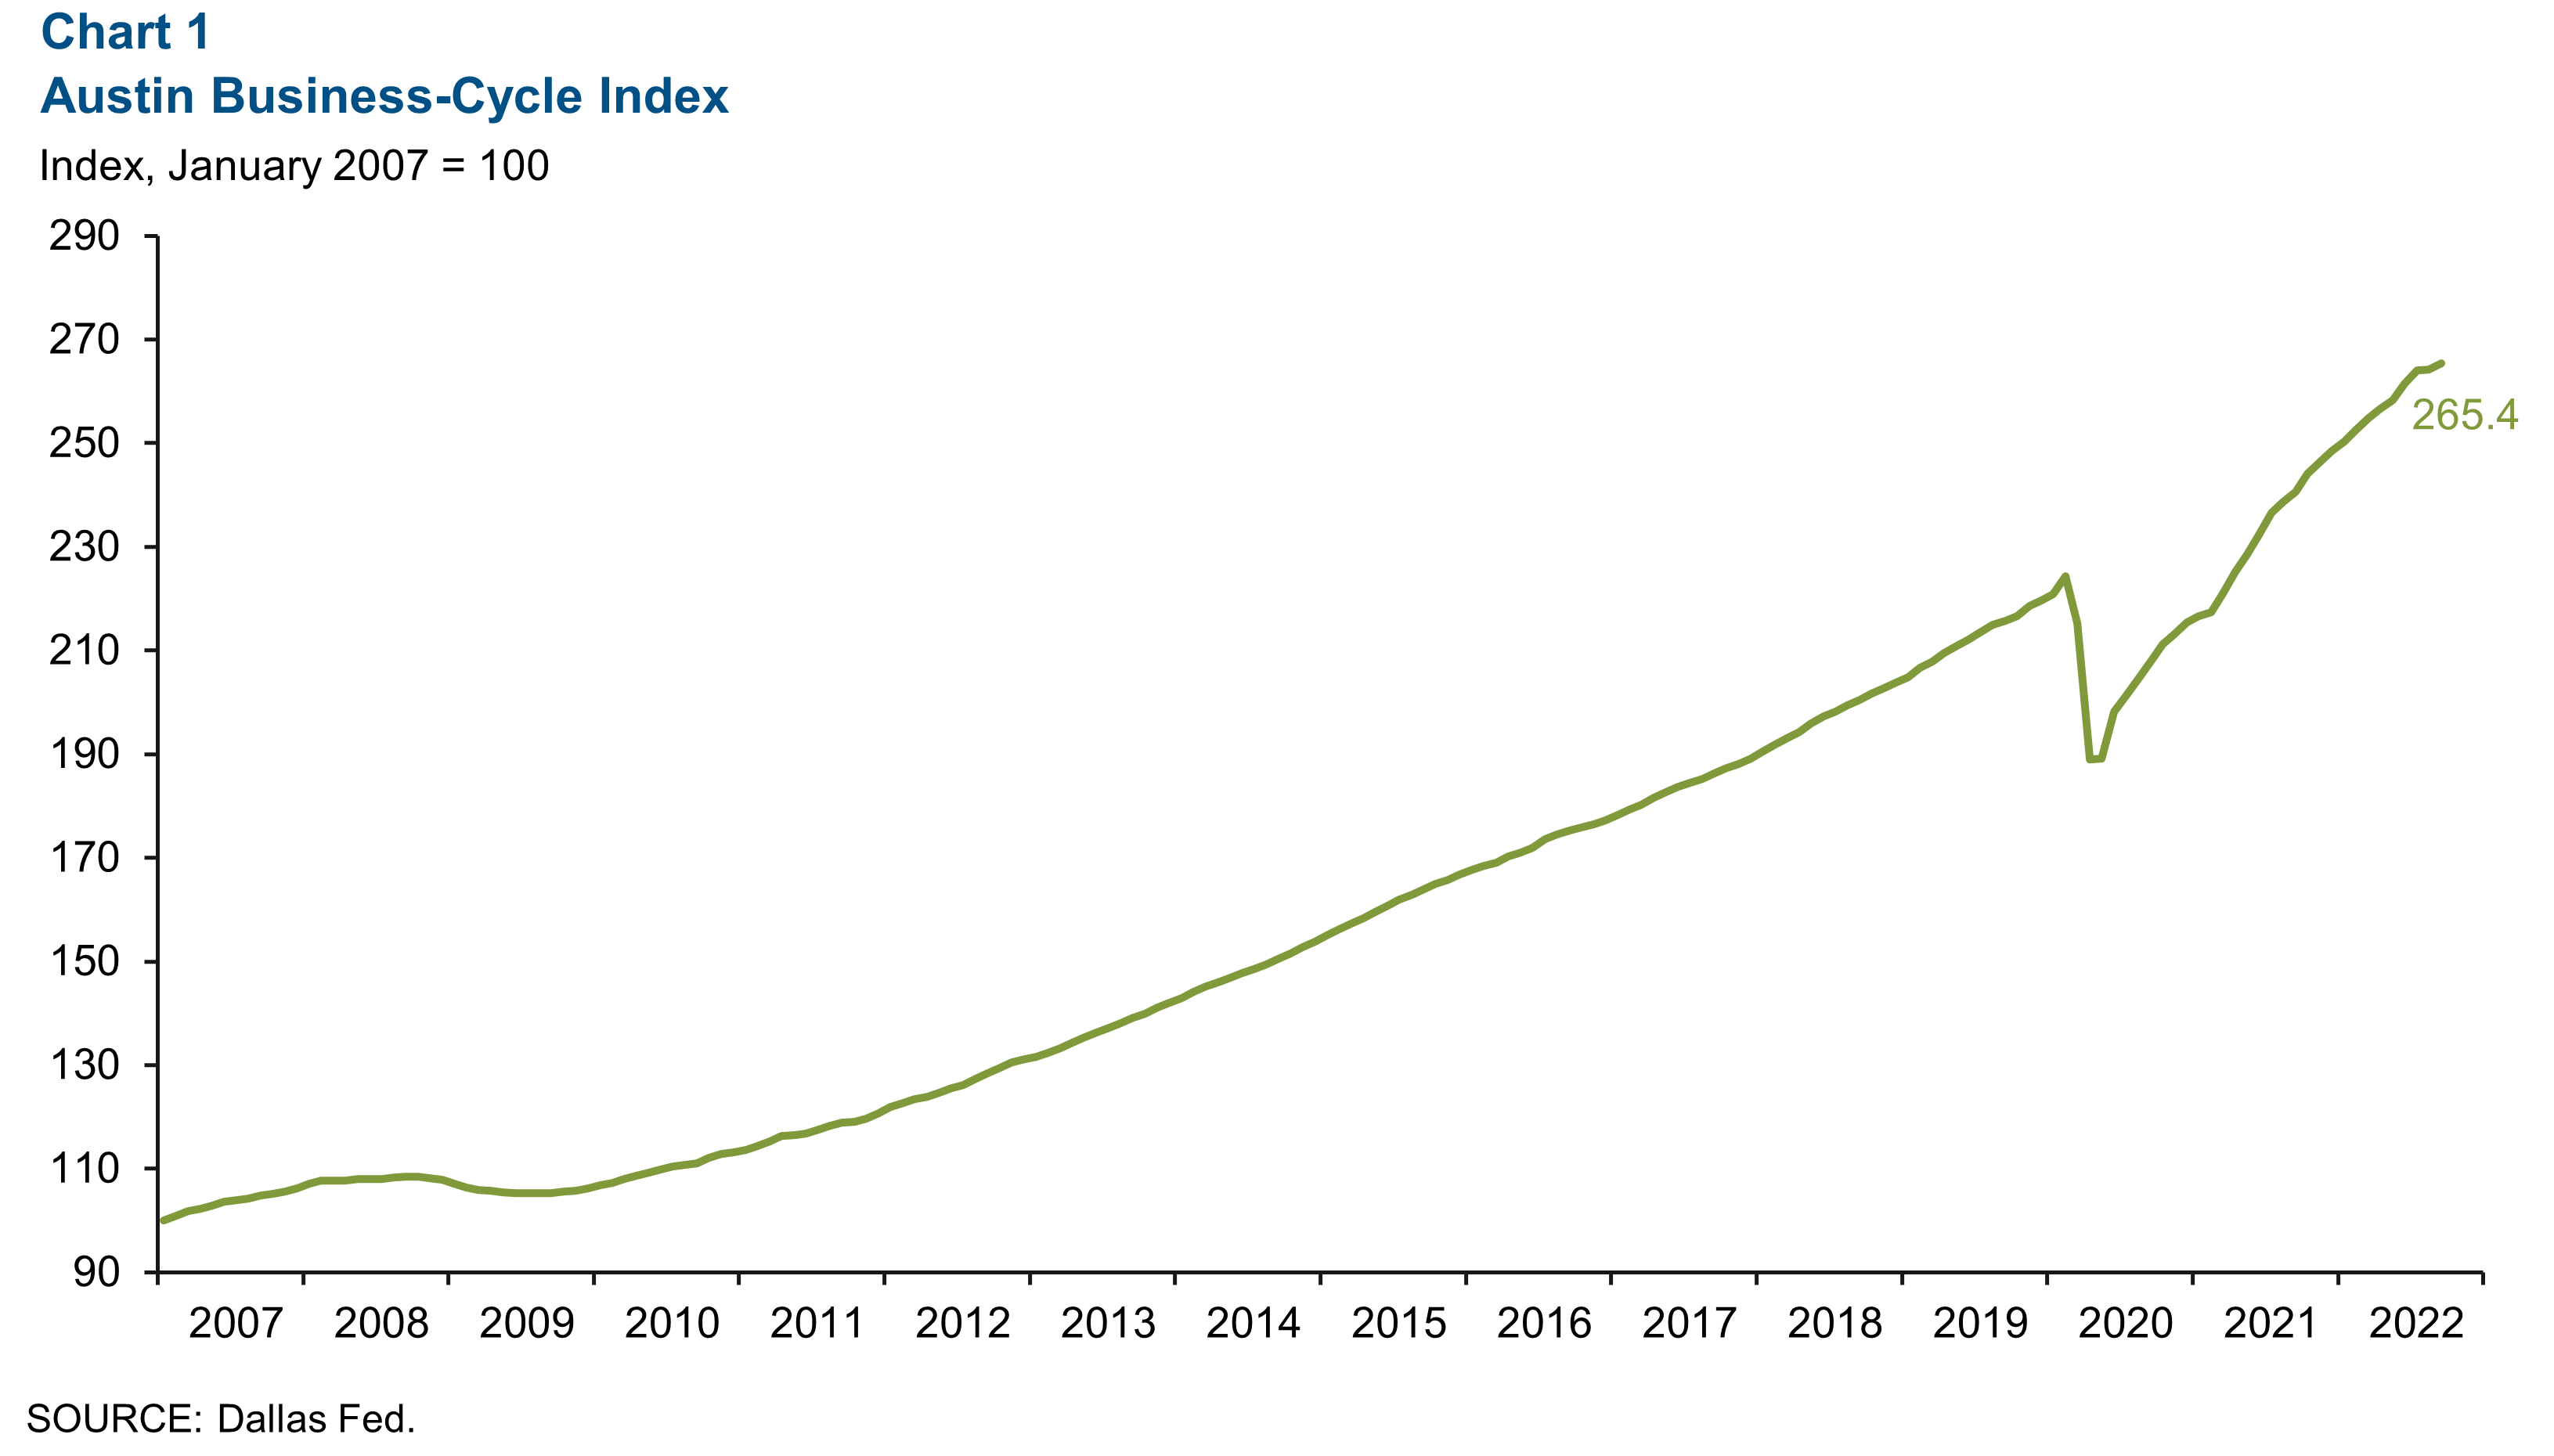
Business-cycle index
The Austin Business-Cycle Index—a broad measure of economic activity—grew at an annualized 5.3 percent in September, faster than the 0.5 percent growth in August (Chart 1).
Labor market
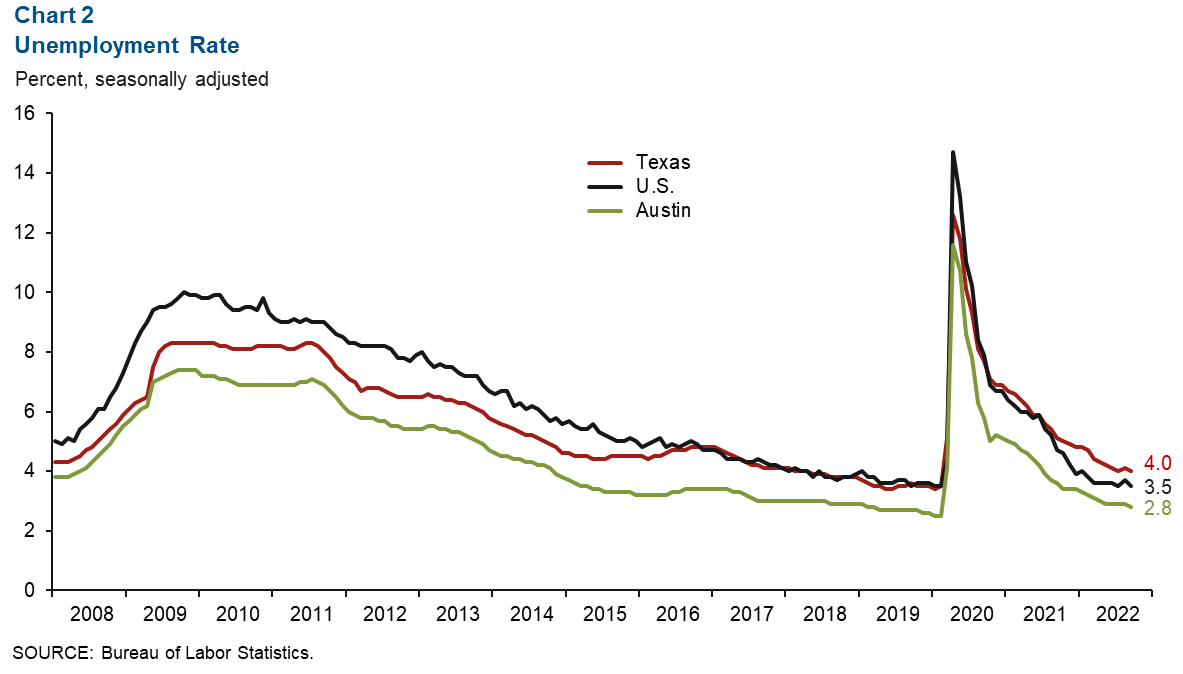
Unemployment rate falls further
Austin’s unemployment rate ticked down to 2.8 percent in September from 2.9 percent in August (Chart 2). This compared with the state’s jobless rate of 4.0 percent and the nation’s rate of 3.5 percent. The metro area labor force increased at an annualized rate of 1.3 percent in September.
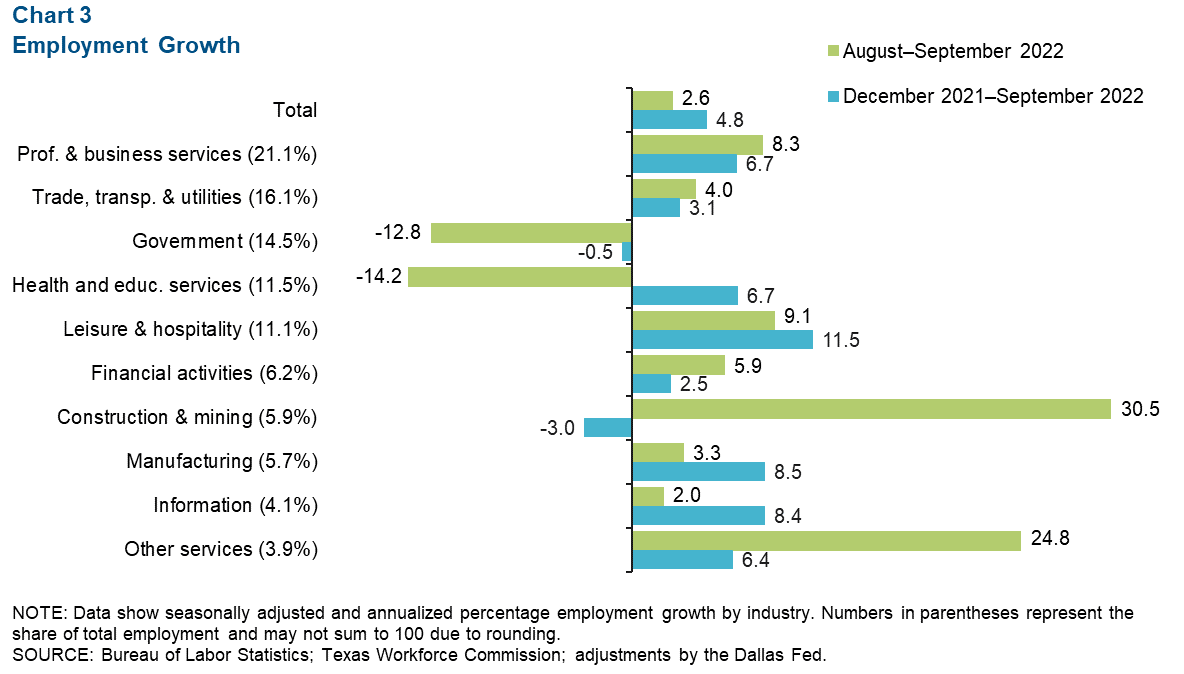
Most employment sectors expand
Austin employment increased by an annualized 2.6 percent, or by 2,668 net jobs in September (Chart 3). This was primarily driven by growth in construction and mining (30.5 percent, or 1,622 jobs), and other services (24.8 percent, or 898 jobs). The only sectors to experience declines in September were government (12.8 percent, or 2,092 jobs), and health and education services (14.2 percent, or 1,851 jobs). As of September, Austin payrolls have increased 4.8 percent year to date.
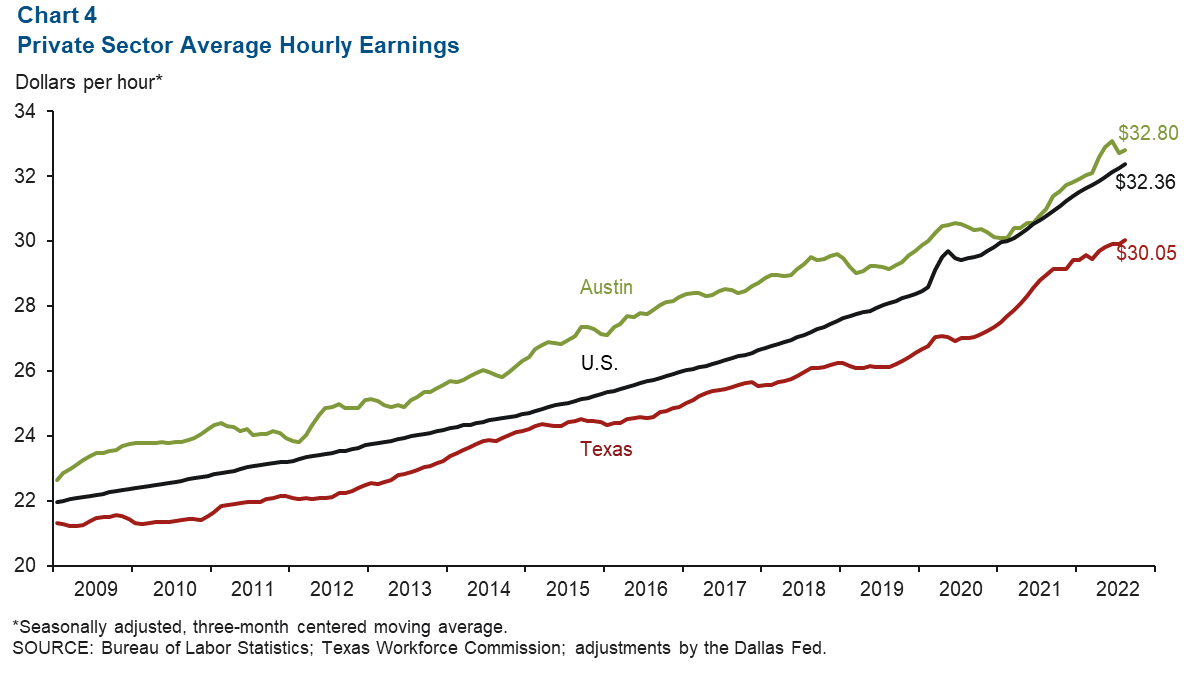
Wages climb in September
Austin’s three-month moving average of wages grew to $32.80 in September, remaining higher than both the U.S. average of $32.36 and the state average of $30.05 (Chart 4). Austin’s year-over-year wage growth improved to 6.9 percent, remaining above Texas’ rate of 4.3 percent and the nation’s 5.0 percent.
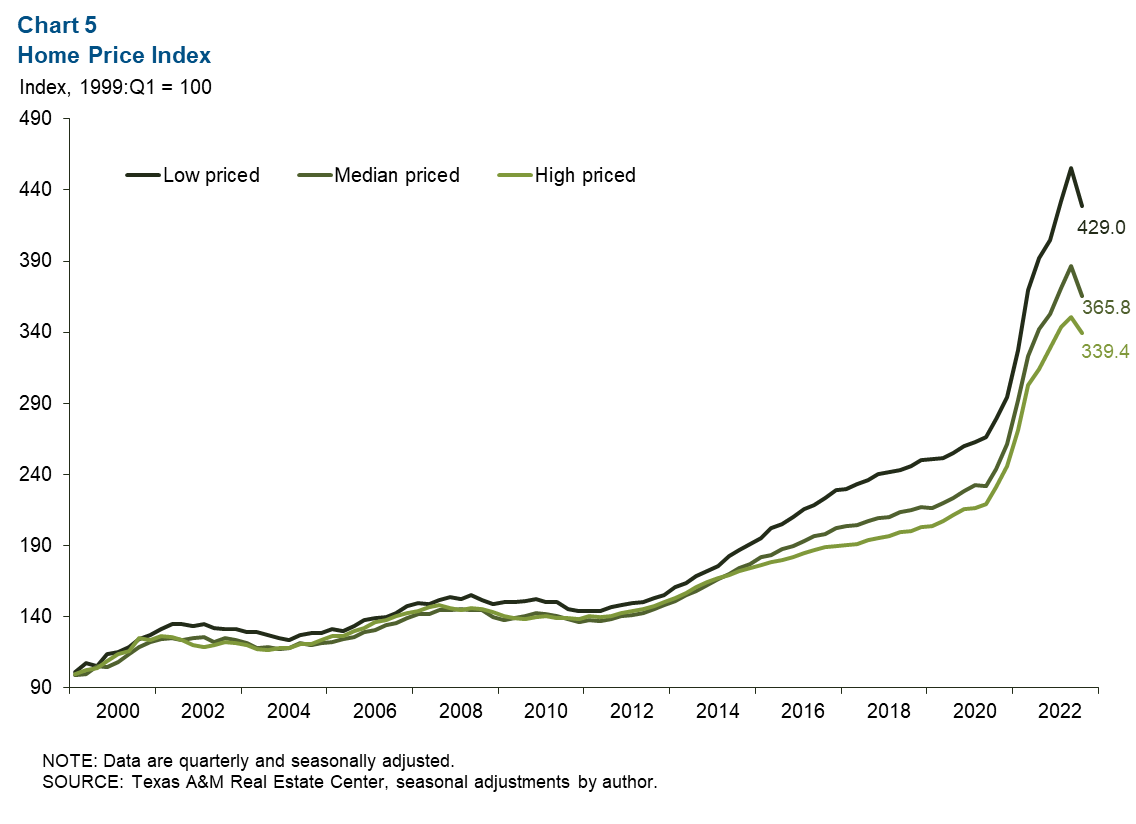
Home price index
The Home Price Index tracks price changes of existing homes when they are sold to different people. In third quarter 2022, it declined 4.8 percent. This is reflective of a cooling housing market’s impact on home values as interest rates rise. While all three price tiers of homes experienced declines in the third quarter, the sharpest decline was in low-priced homes (Chart 5). Year over year, home prices increased 8.2 percent overall, slower than the 19.5 percent year-over-year growth observed during second quarter 2022.
NOTE: Data may not match previously published numbers due to revisions.
About Austin Economic Indicators
Questions or suggestions can be addressed to Vee Kalkunte at Prithvi.Kalkunte@dal.frb.org.
Austin Economic Indicators is released on the first Thursday of every month.