Austin Economic Indicators

December 1, 2022
| Austin Economy Dashboard (October 2022) | |||
| Job growth (annualized) Sept.–Oct. '22 |
Unemployment rate |
Avg. hourly wages |
Avg. hourly wage growth y/y |
| 3.4% | 2.9% | $32.72 | 2.2% |
In October, Austin experienced a rebound in job growth, accompanied by a slight increase in unemployment and a decline in wage growth. On the housing side, demand has weakened further as mortgage rates cause home prices to cool and housing inventory to rise. At the same time, housing affordability continues to fall.
Labor market
Unemployment rate ticks up
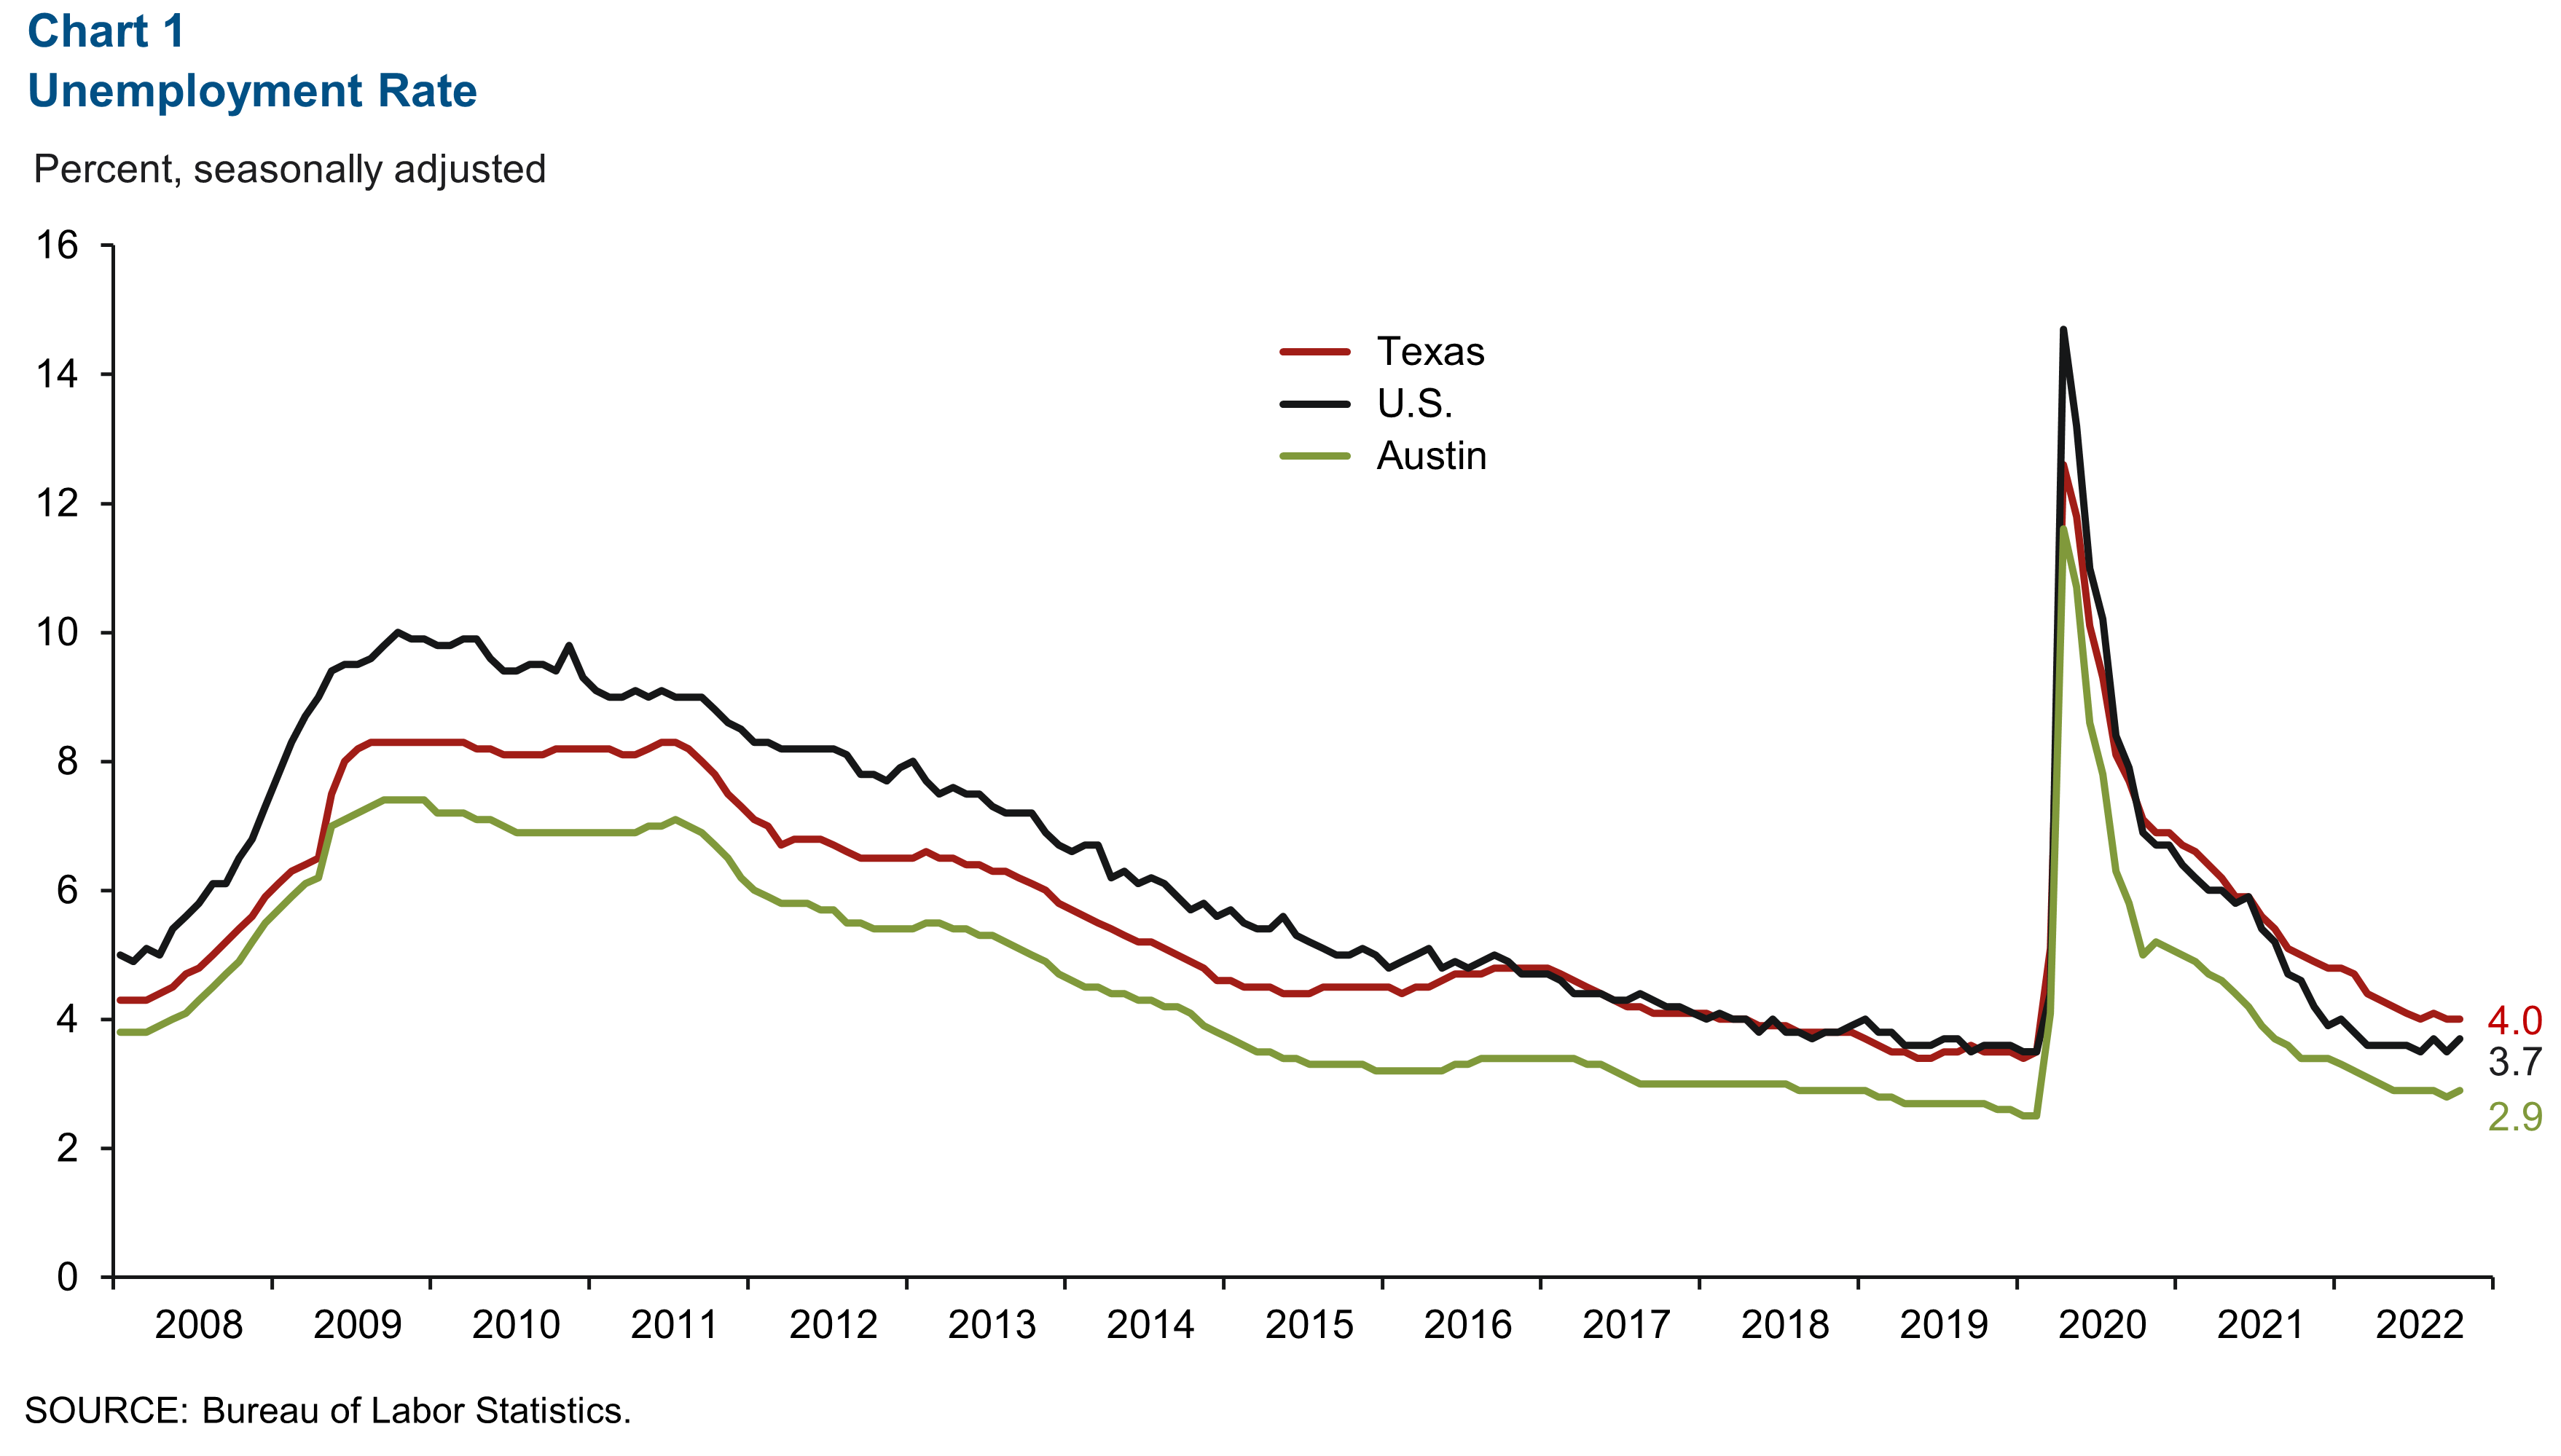
Austin’s unemployment rate increased to 2.9 percent in October from 2.8 percent in September (Chart 1). This compares with jobless rates of 4.0 percent in the state and 3.7 percent in the nation. The metro-area labor force increased at an annualized rate of 5.1 percent in October.
Most employment sectors expand
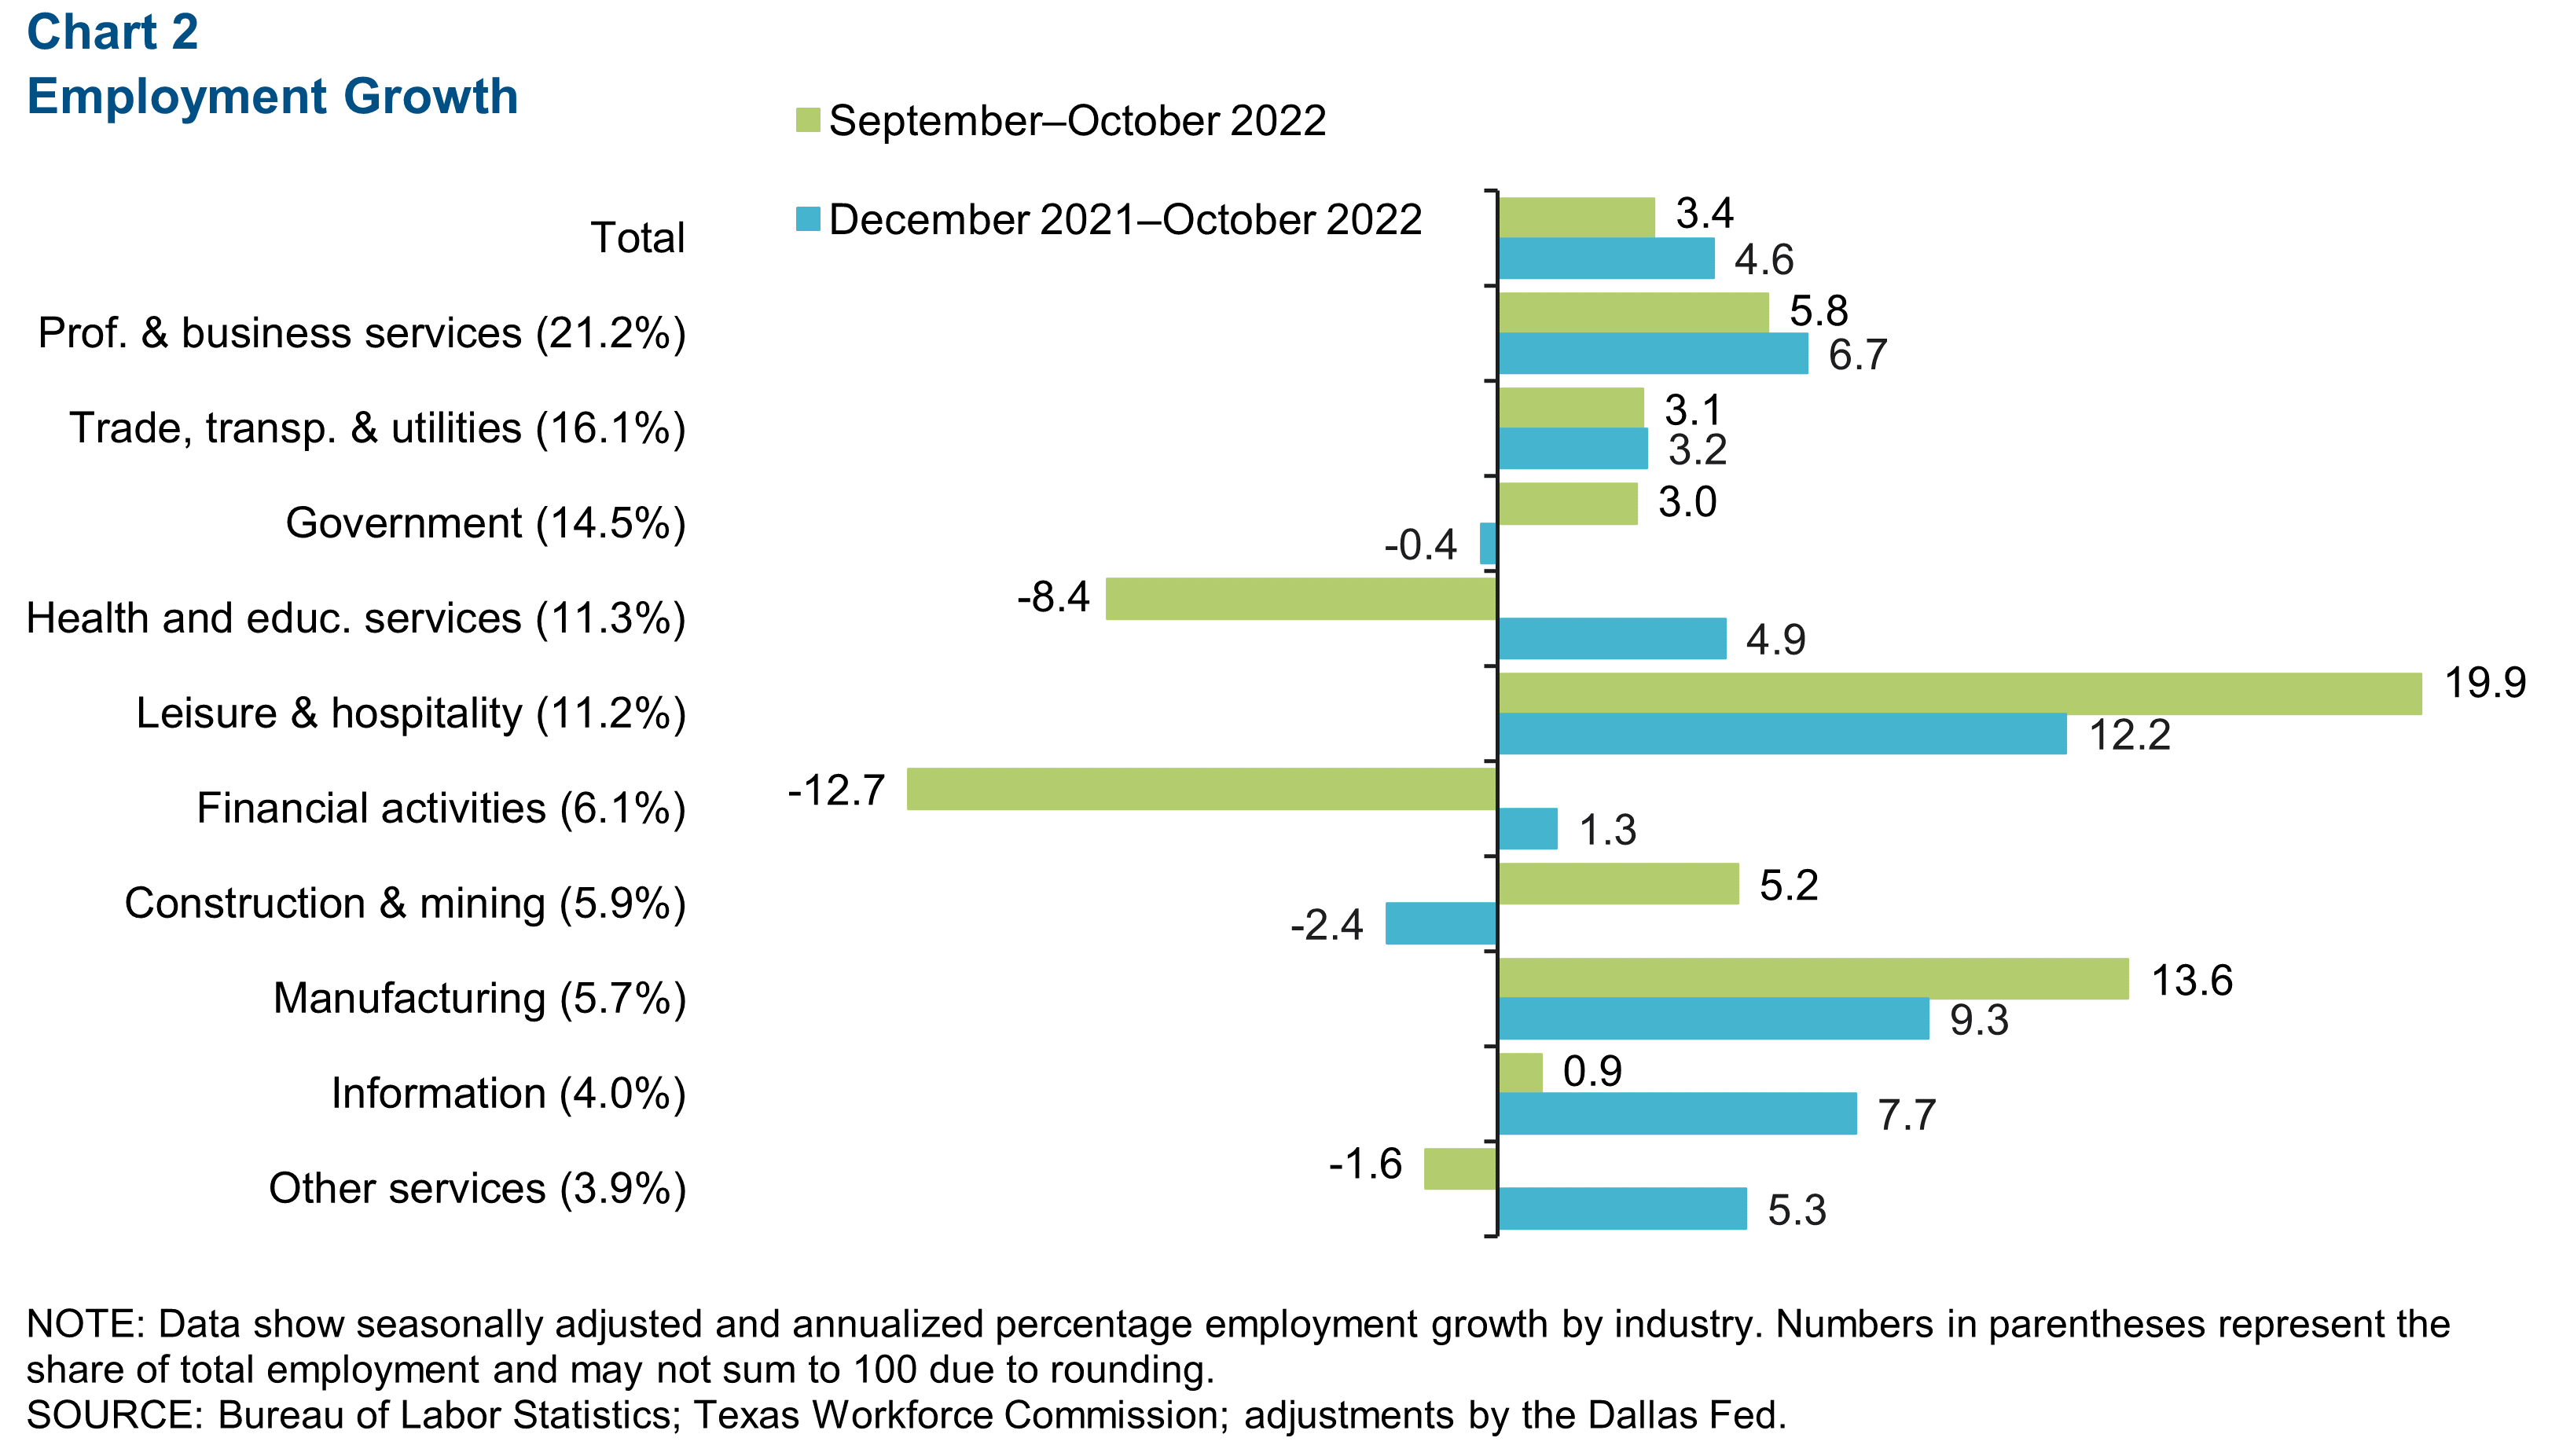
Austin employment increased an annualized 3.4 percent, or by 3,480 net jobs, in October (Chart 2). This was primarily driven by growth in leisure and hospitality (19.9 percent, or 2,125 jobs) and manufacturing (13.6 percent, or 765 jobs). However, there were declines in financial activities (12.7 percent, or 874 jobs) and health and education services (8.4 percent, or 1,051 jobs). As of October, Austin payrolls had increased 5.1 percent year over year.
Wage growth slips in October
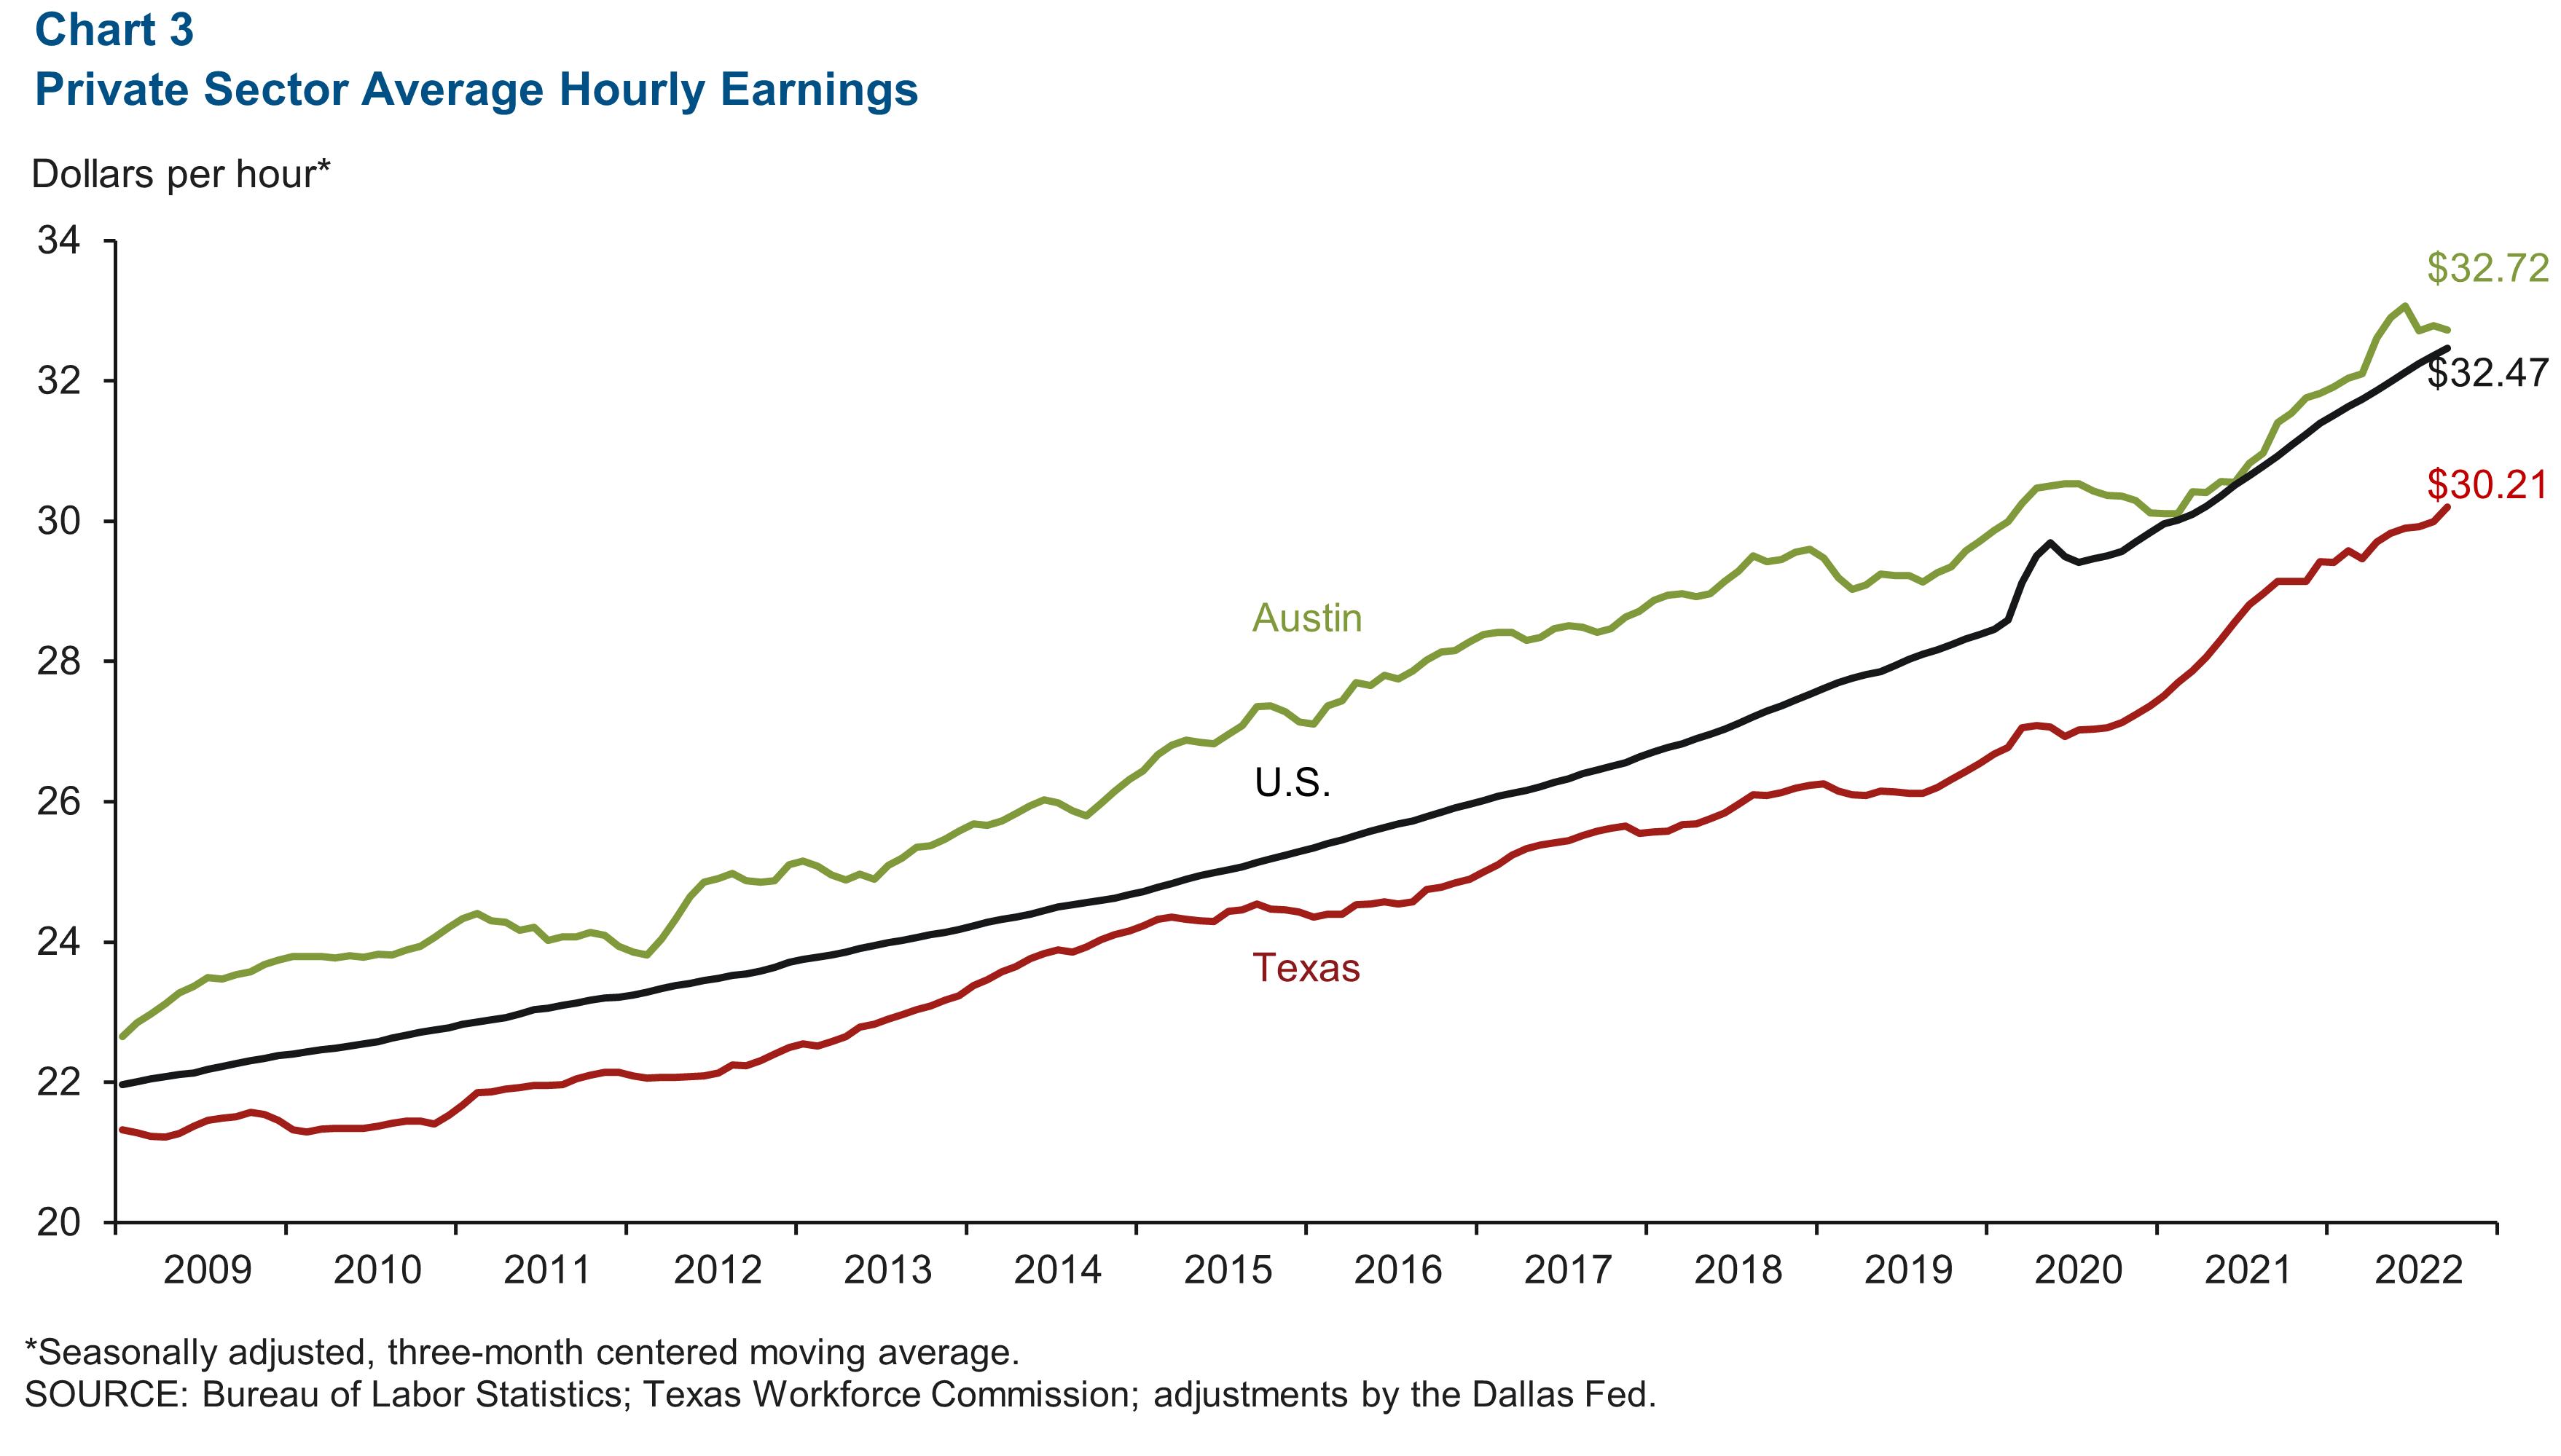
Wage growth in Austin slowed in October but increased 2.2 percent year over year, less than the 4.7 percent growth in both Texas and the nation. Austin wages declined to $32.72, based on a three-month moving average, but exceeded both the U.S. average of $32.47 and the state average of $30.21 (Chart 3).
Housing
Housing affordability declines further
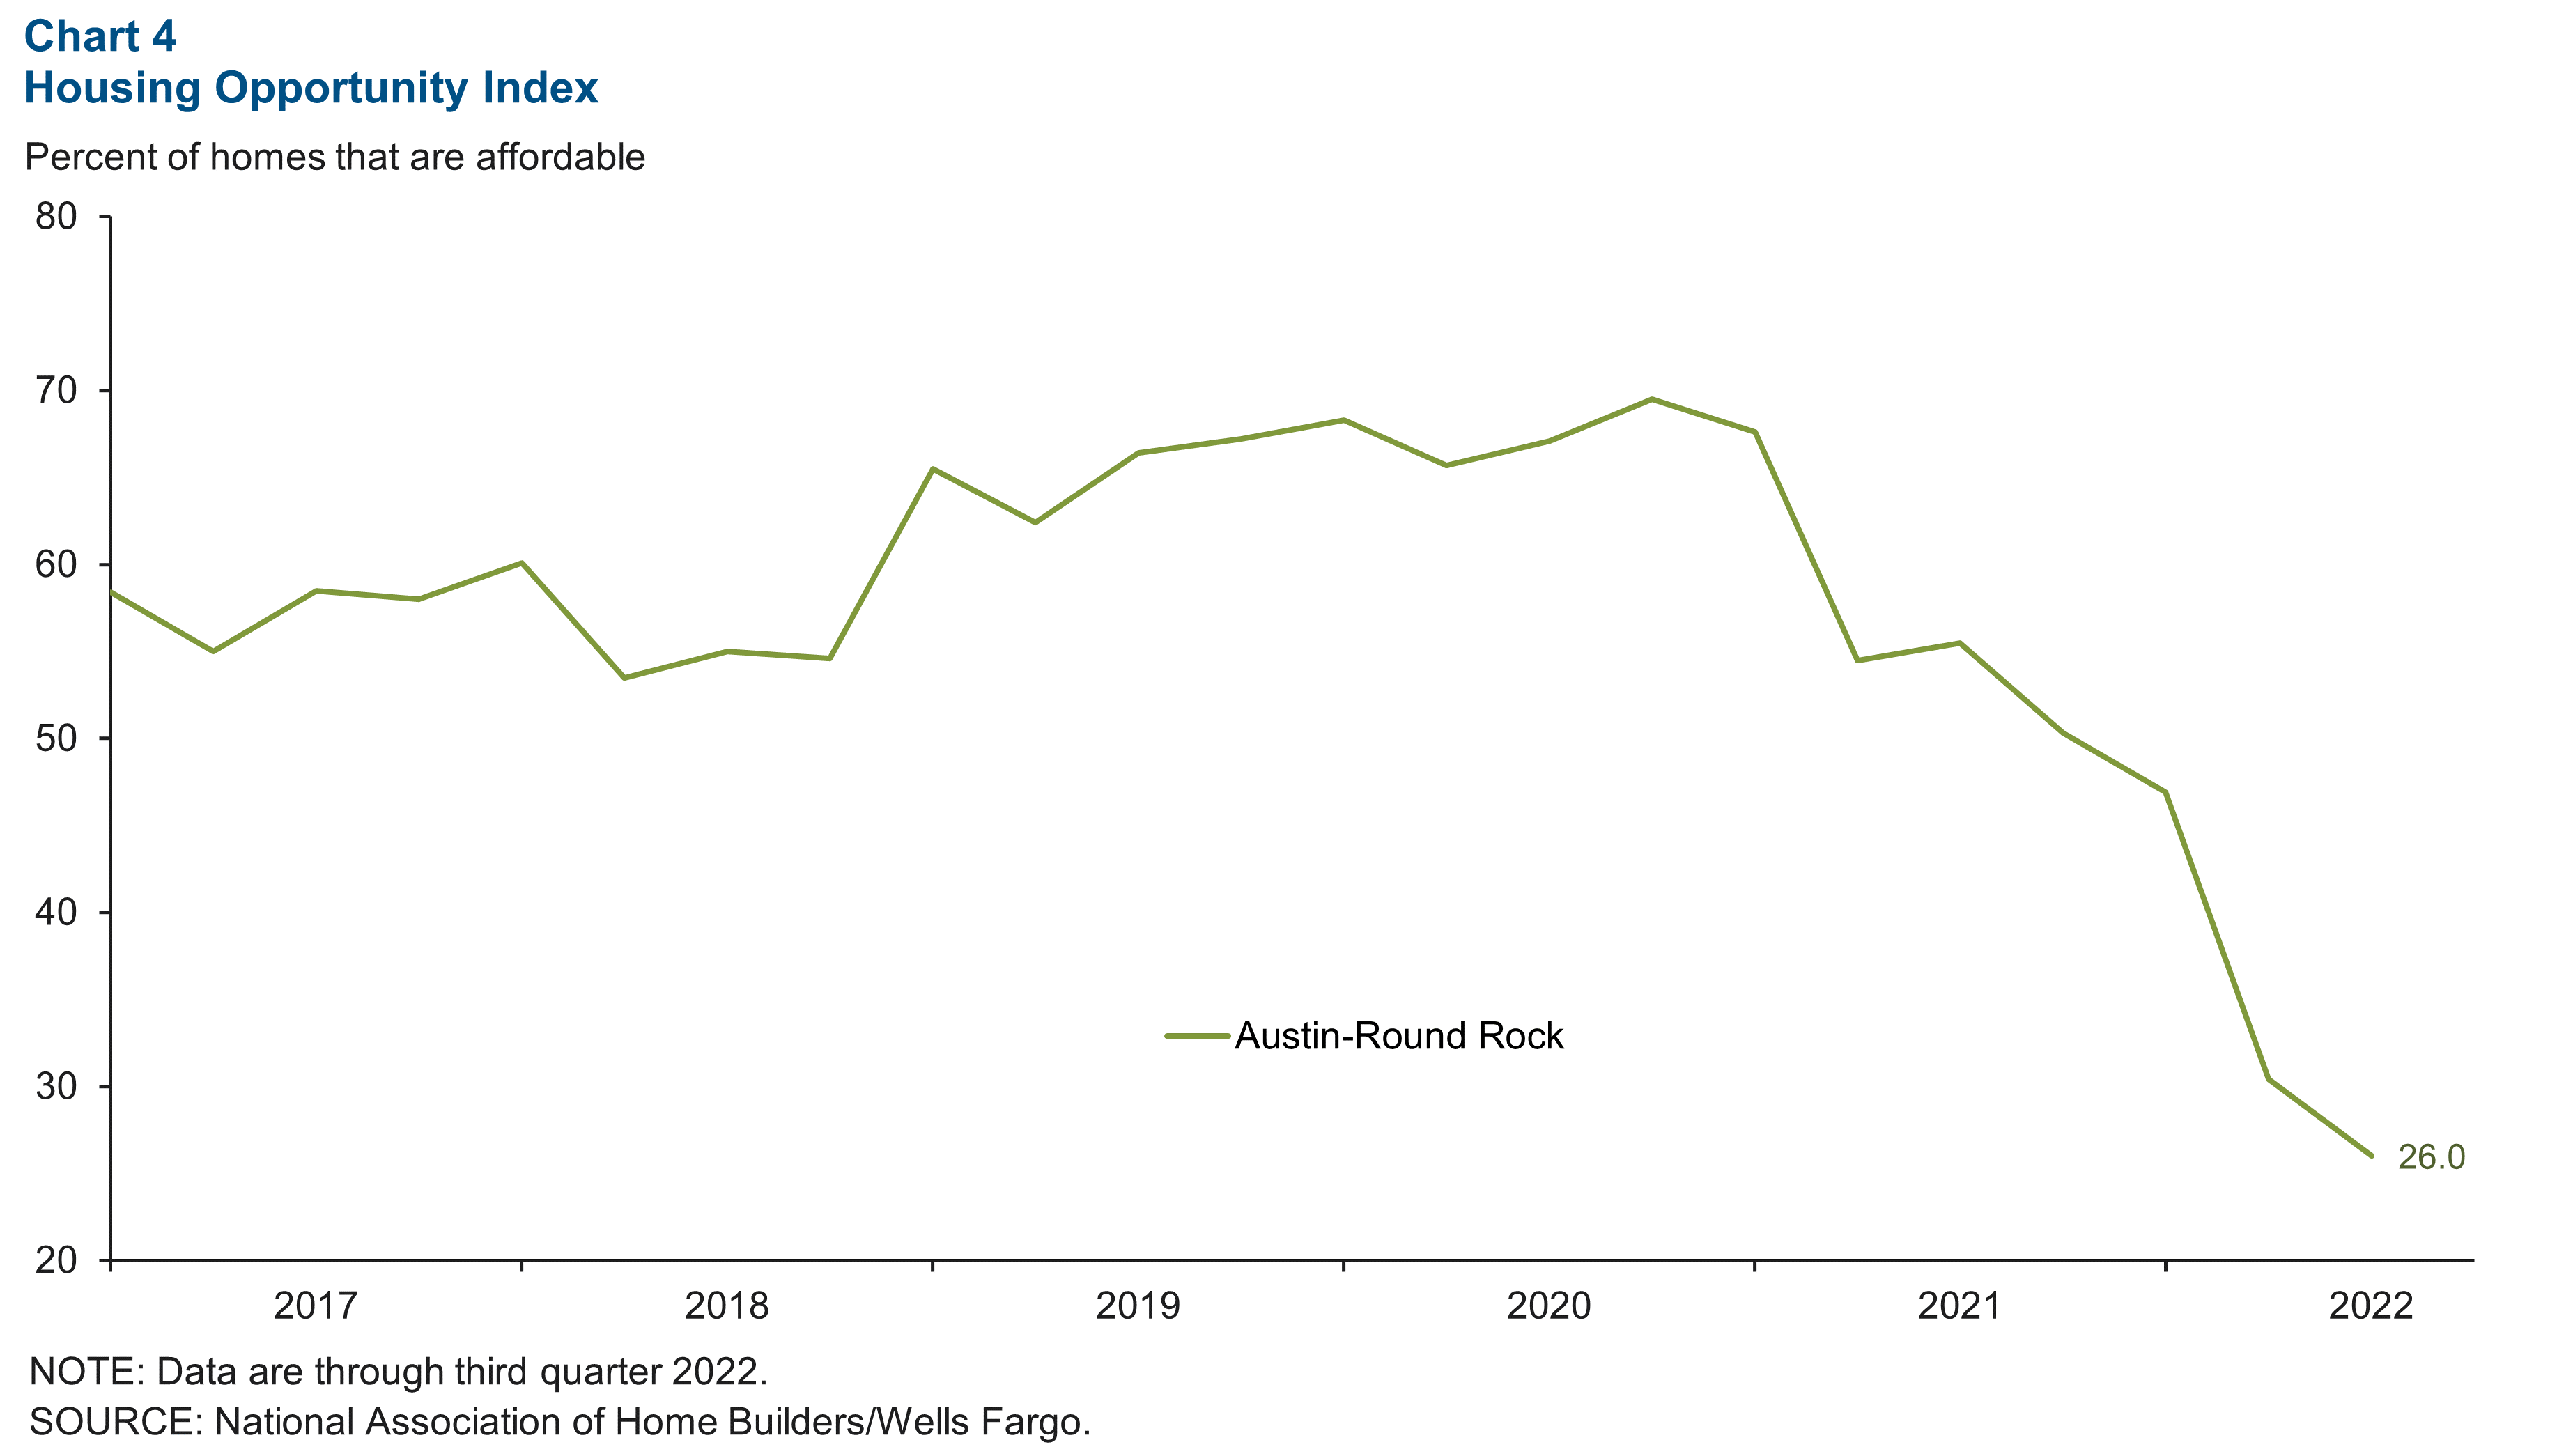
The Housing Opportunity Index, which reflects the percentage of homes sold that would have been affordable to a family earning the median income, continues to decline in the Austin area. At the end of the third quarter, the index stood at 26.0 percent, well below the national level of 42.2 percent (Chart 4).
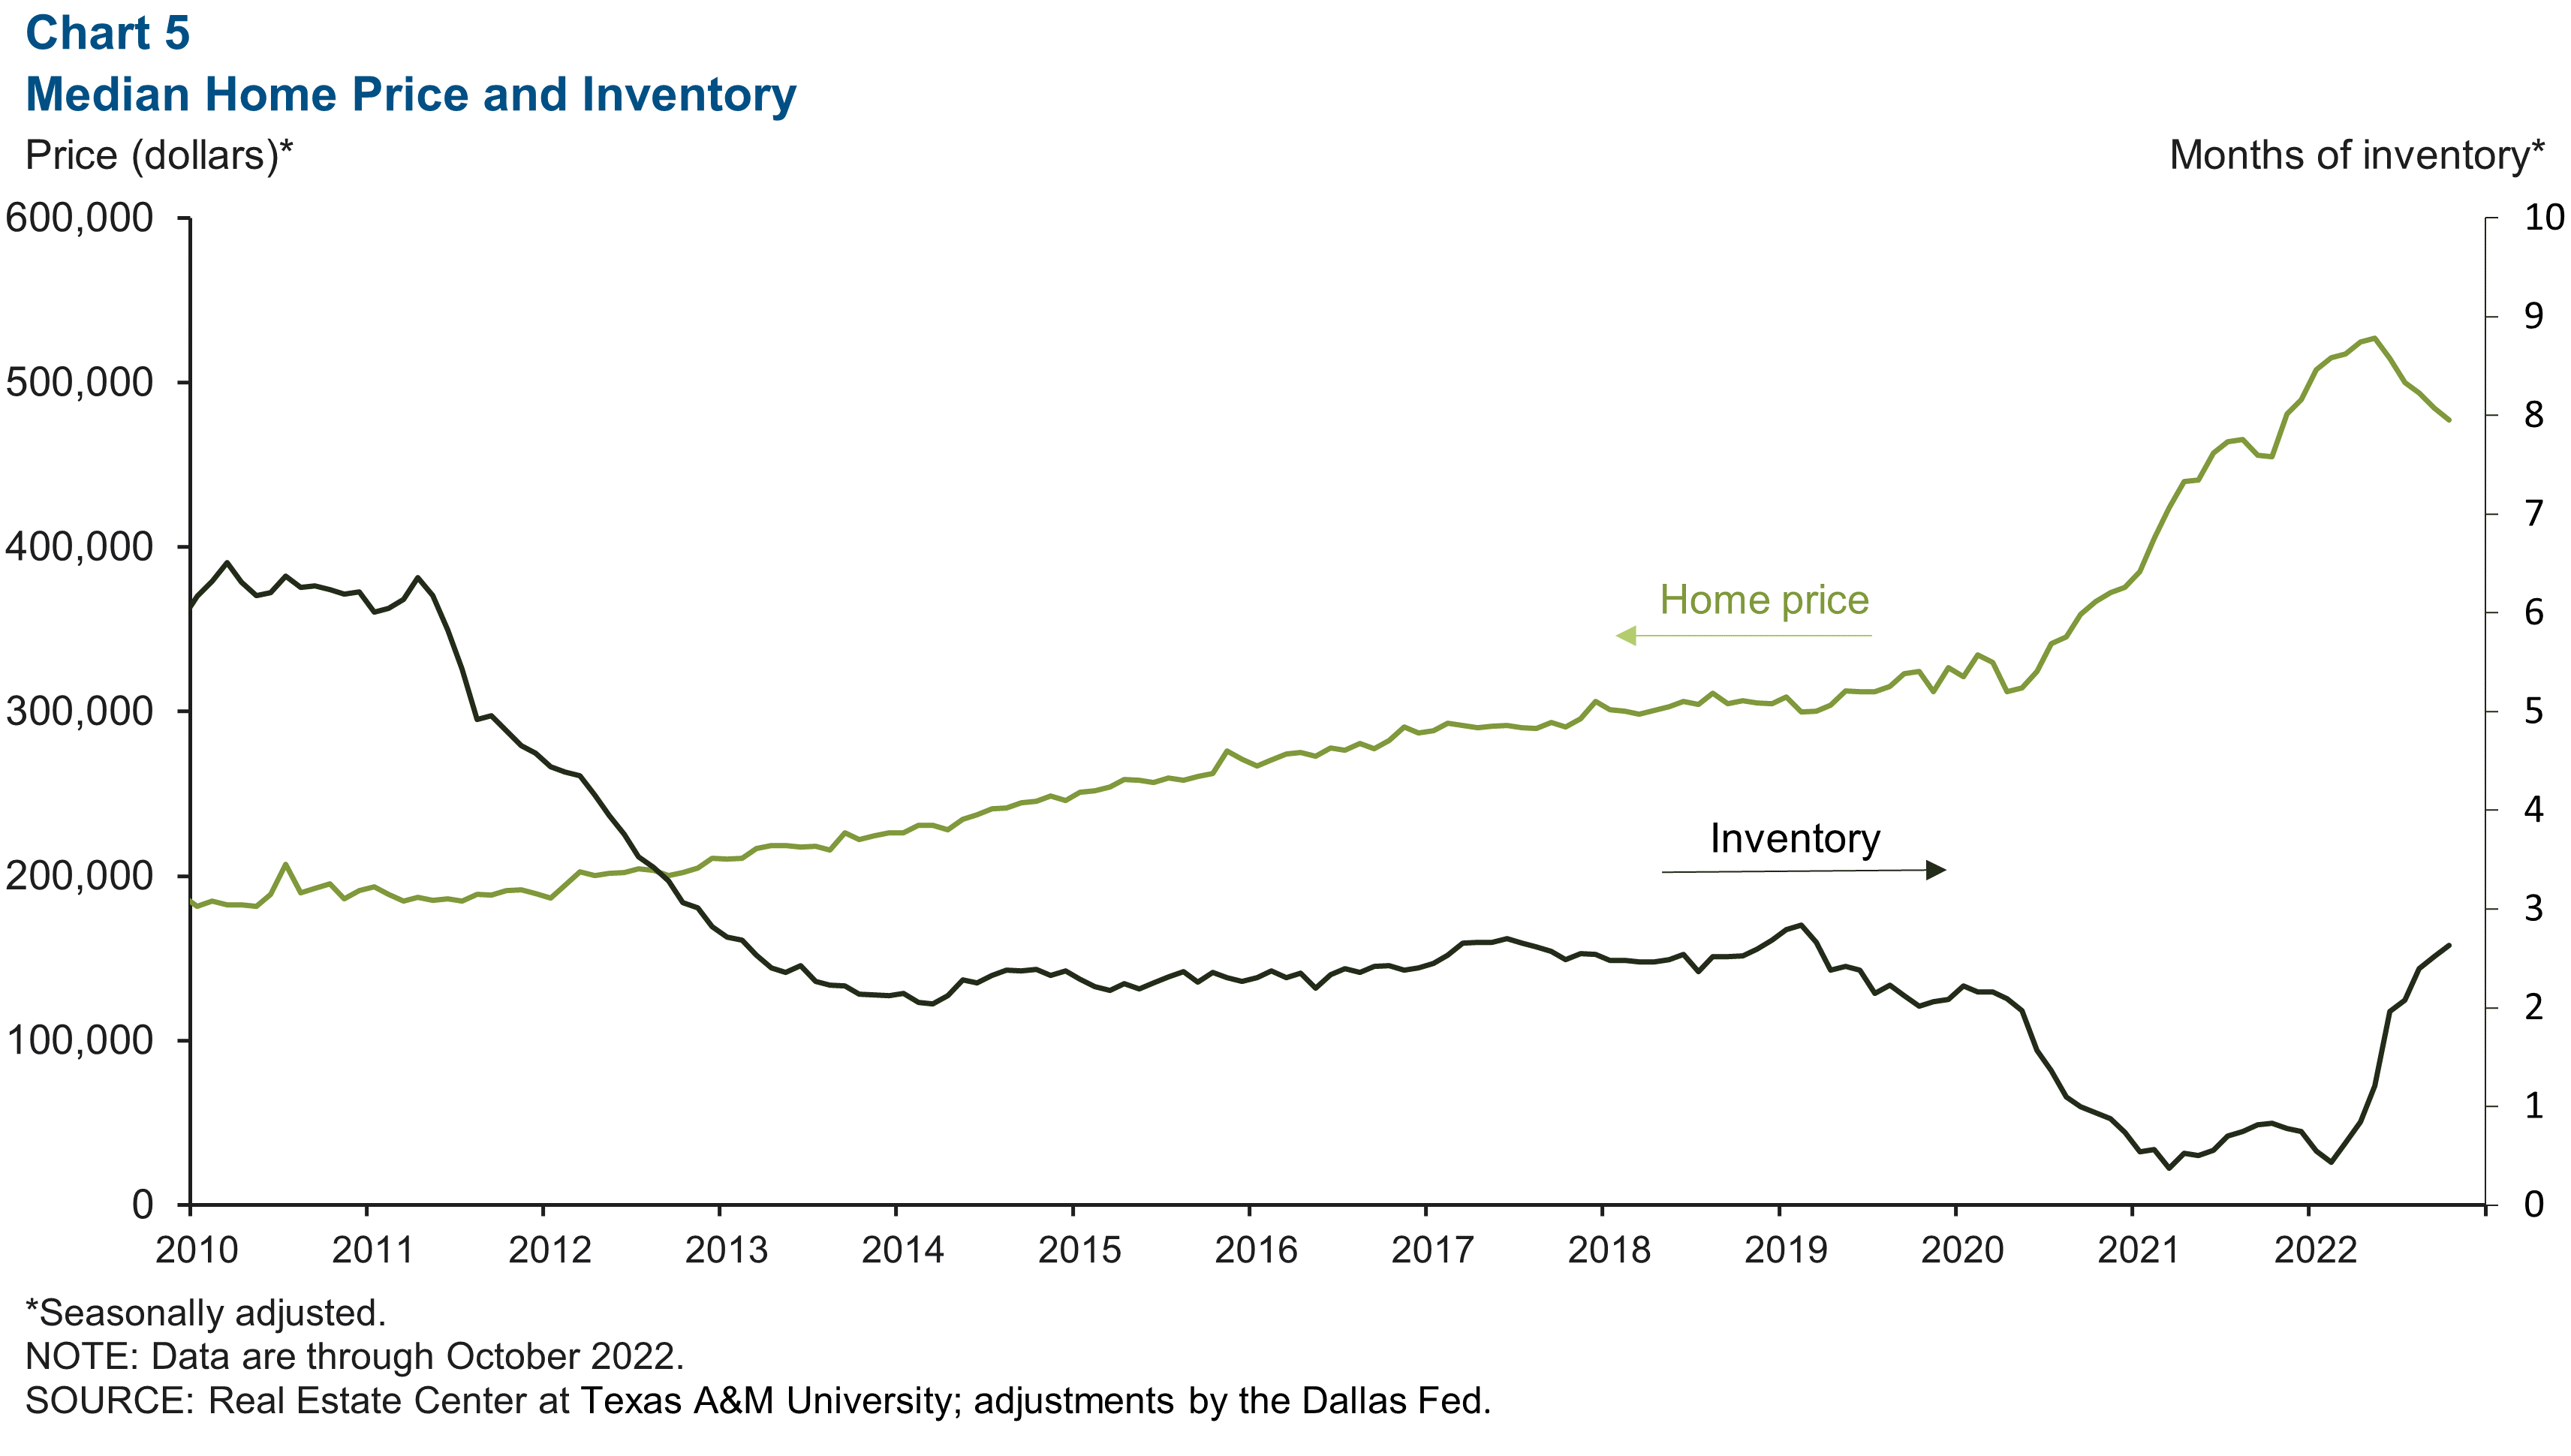
Housing inventory recovers as home prices decline
There are further signs of weakening demand in Austin’s housing market due to rising interest rates. In October, median home prices declined an annualized 16.9 percent, while housing inventory recovered to 2.6 months of supply, reaching levels last seen in early 2019 (Chart 5).
NOTE: Data may not match previously published numbers due to revisions.
About Austin Economic Indicators
Questions or suggestions can be addressed to Vee Kalkunte at Prithvi.Kalkunte@dal.frb.org.
Austin Economic Indicators is released on the first Thursday of every month.