Austin Economic Indicators

| Austin economy dashboard (July 2025) | |||
| Job growth (annualized) April–July '25 |
Unemployment rate |
Avg. hourly earnings |
Avg. hourly earnings growth y/y |
| 0.2% | 3.4% | $36.32 | 4.2% |
Austin employment ticked up in July, and the unemployment rate held steady, while wages rose. Home prices continued to decline.
Labor market
Unemployment unchanged
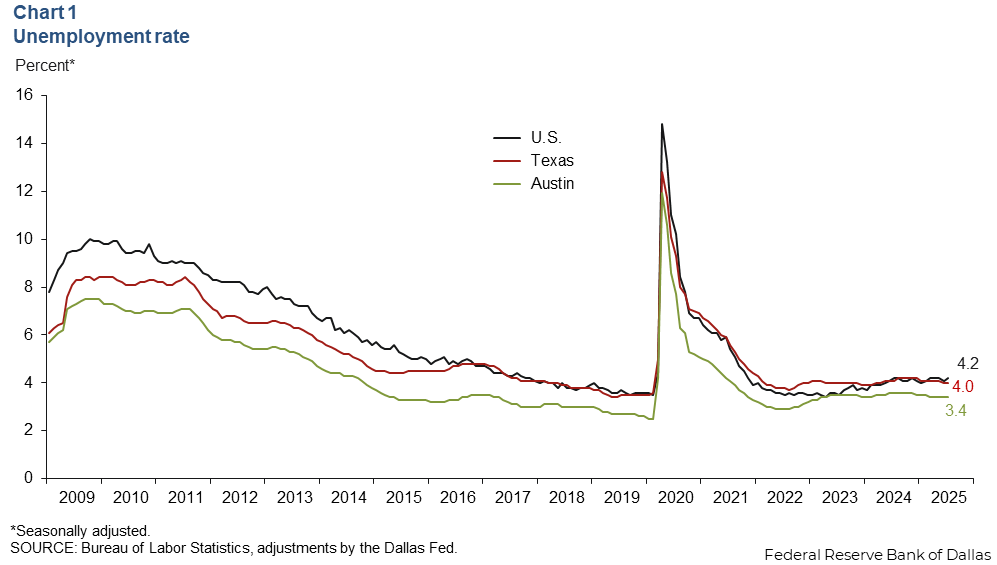
Austin’s unemployment rate remained at 3.4 percent in July, below the state rate of 4.0 percent and the national rate of 4.2 percent (Chart 1). In July, the local labor force decreased an annualized 1.8 percent, while the state’s fell 0.1 percent, and the nation’s fell 0.3 percent.
Jobs decline
Austin employment increased an annualized 0.4 percent in July, faster than the 1.8 percent decline in June. In the three months ending in July, employment increased an annualized 0.2 percent (Chart 2). The greatest gains were in education and health services (1,600 jobs), information (800 jobs) and financial activities (700 jobs). Sectors that declined include professional and business services (-3,500 jobs) and construction and mining (-200 jobs). Austin’s employment grew 1.1 percent from December to July, about the same as for Texas, which rose 0.9 percent. National employment rose 0.6 percent.

Earnings rise but at a slower pace
Austin’s average hourly wage increased to $36.32 in July. The three-month moving average for wages increased an annualized 4.2 percent in July to $36.23, lower than the nation’s average of $36.32 but higher than the state’s average of $34.47 (Chart 3). Year over year, Austin’s 4.2 percent wage growth was faster than Texas’ gains of 3.6 percent and faster than the nation’s gains of 3.9 percent.

Home prices continue to decline
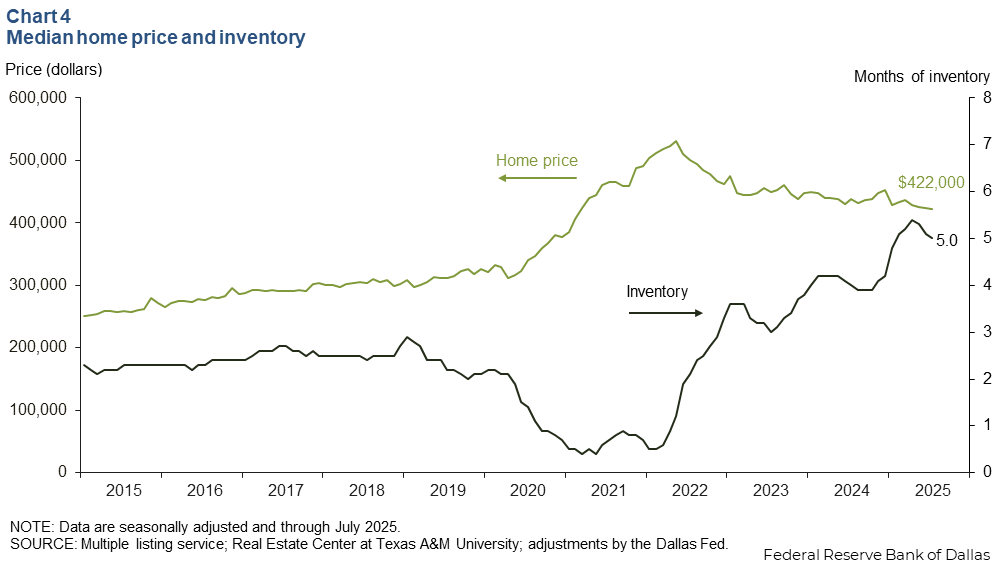
Austin’s median home price decreased 0.6 percent in July (Chart 4). Year over year, median home prices fell 3.6 percent in the metro area and 1.3 percent in the state. Austin home inventories ticked down to 5.0 months in July, remaining below six months, which is generally considered a balanced housing market. A year ago, home inventory levels in Austin were 4.0 months.
NOTE: Data may not match previously published numbers due to revisions.
About Austin Economic Indicators
Questions or suggestions can be addressed to Ethan Dixon at Ethan.Dixon@dal.frb.org.
Austin Economic Indicators is published every month after state and metro employment data are released.