Austin Economic Indicators

| Austin economy dashboard (April 2026) | |||
| Job growth (annualized) Jan. '26–Apr. '26 |
Unemployment rate |
Avg. hourly earnings |
Avg. hourly earnings growth y/y |
| 0.2% | 3.7% | $37.56 | 5.0% |
In April, Austin experienced employment growth and wage increases, though the unemployment rate also rose. Meanwhile, housing prices climbed as months of inventory declined.
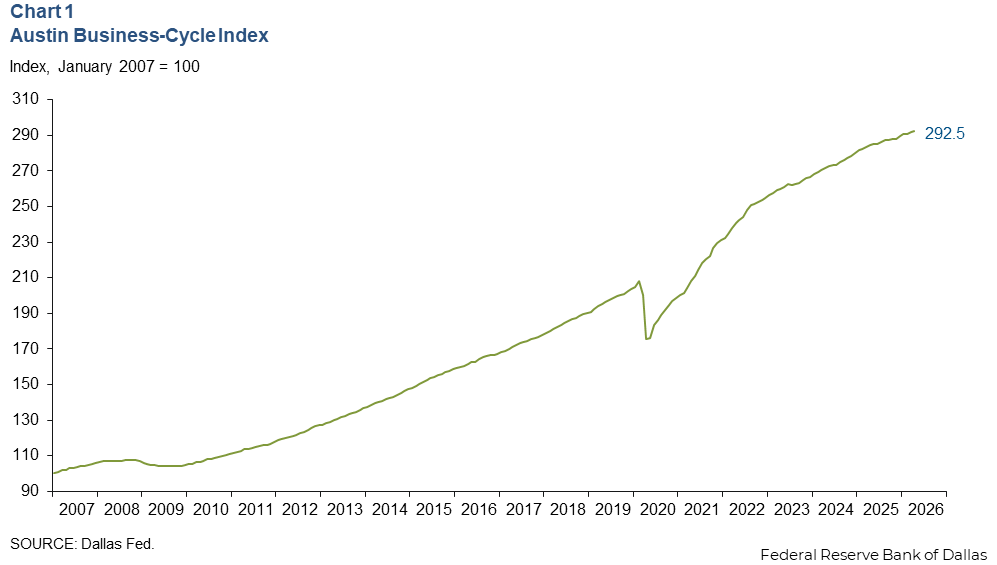
Business-cycle index
The Austin Business-Cycle Index, a broad measure of economic activity, grew an annualized 2.5 percent in April, slower than the 3.6 percent gain in March (Chart 1).
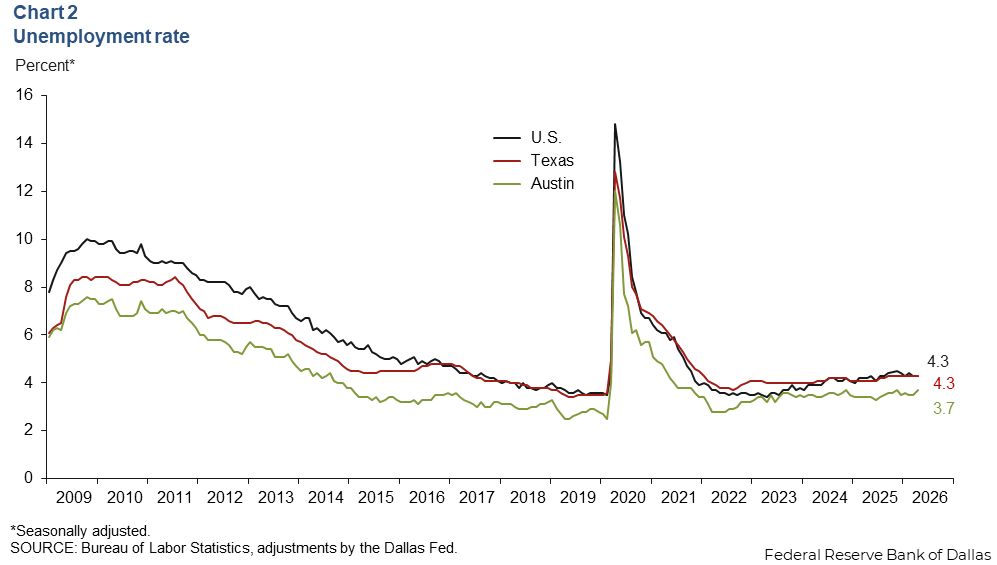
Labor market
Unemployment rises
Austin’s unemployment rate rose to 3.7 percent in April, but is still below the state and national rate of 4.3 percent (Chart 2). The number of unemployed expanded an annualized 8.9 percent, while the labor force decreased by 2.1 percent from December to April.
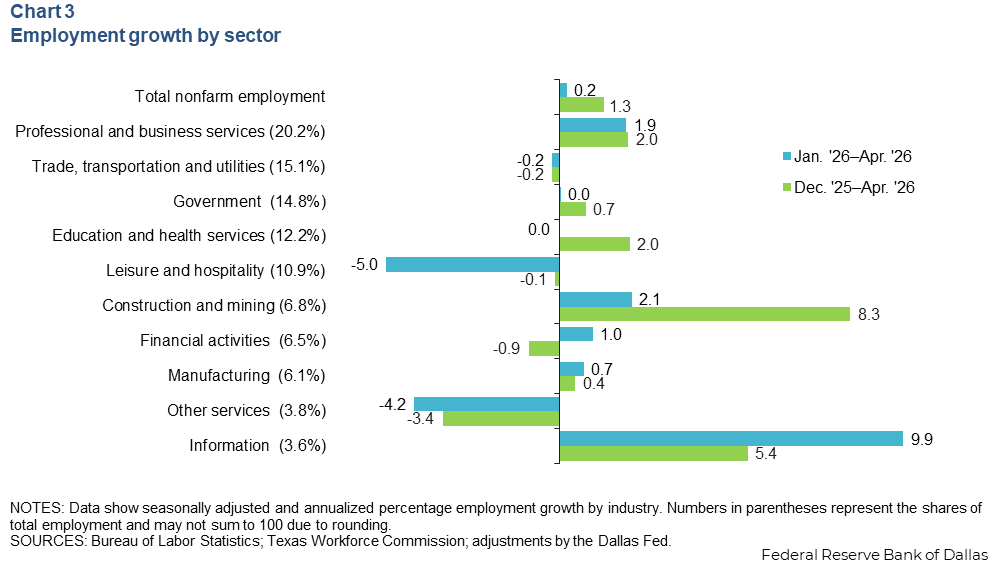
Jobs increase
Austin employment increased an annualized 1.3 percent in April. In the three months ending in April, employment increased an annualized 0.2 percent (Chart 3). The greatest gains were in professional and business services (1,400 jobs), information (1,200 jobs) and construction and mining (500 jobs). Sectors that declined include leisure and hospitality (-2,000 jobs), and other services (-600 jobs).
Austin’s employment grew 1.3 percent annualized from December to April, slower than for Texas, which rose 1.5 percent. National employment rose 0.6 percent.
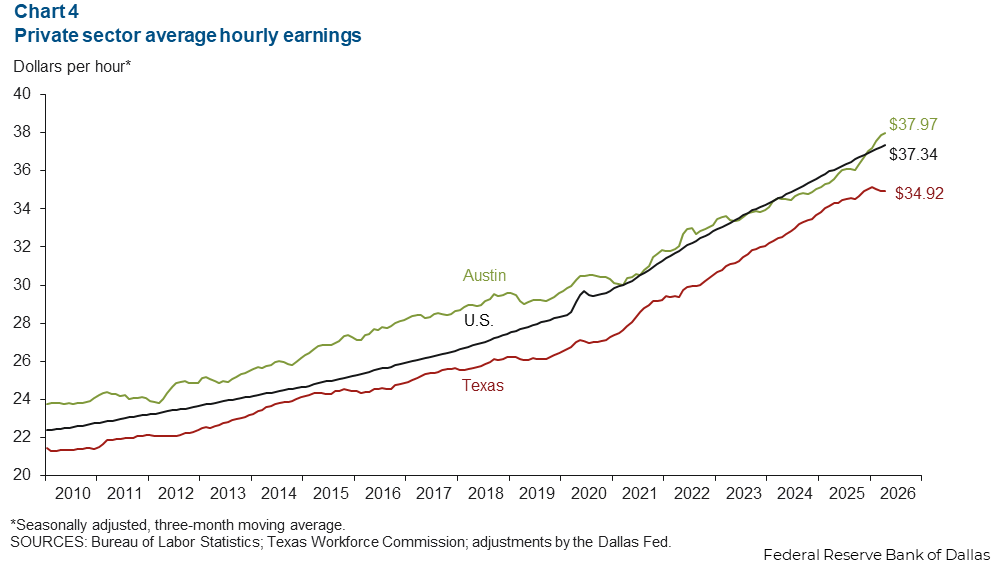
Earnings growth slows
Austin’s average hourly wage increased to $37.56 in April. The three-month moving average for wages increased an annualized 3.0 percent in April to $37.97, higher than the nation’s average of $37.34 and higher than the state’s average of $34.92 (Chart 4). Year over year, Austin’s 5.0 percent wage growth was quicker than both Texas’ and the nation’s gain of 1.9 percent and 3.6 percent, respectively.
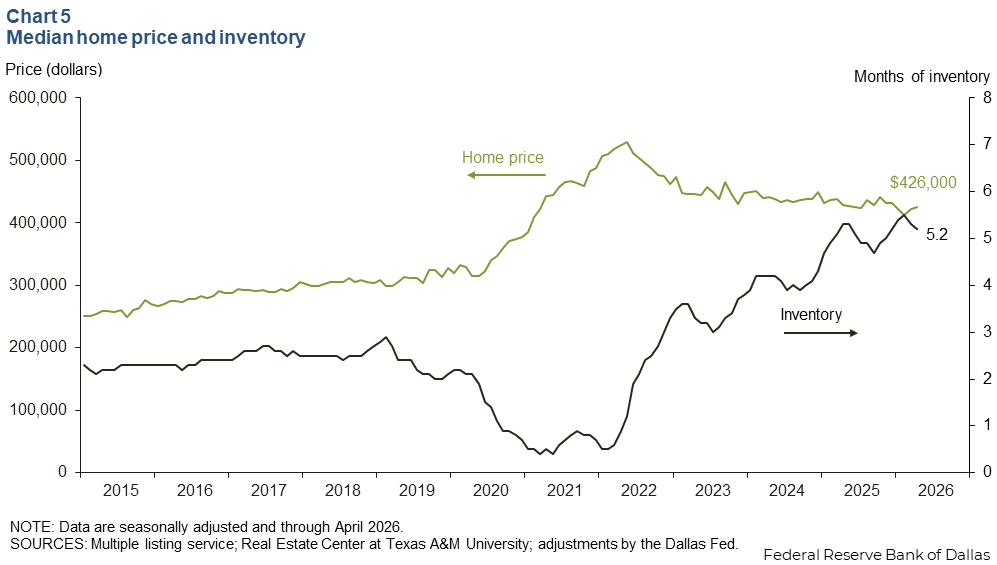
Home prices increased and inventory fell
Austin’s median home price increased 0.7 percent in April (Chart 5). Year over year, median home prices fell 0.5 percent in the metro area and 0.5 percent in Texas. Austin home inventories ticked down to 5.2 months in April, remaining below six months, which is generally considered a balanced housing market. A year ago, home inventory levels in Austin were 5.3 months.
Note
Data may not match previously published numbers due to revisions.
NOTE: Data may not match previously published numbers due to revisions.
About Austin Economic Indicators
Questions or suggestions can be addressed to Ethan Dixon. Austin Economic Indicators publishes bimonthly after state and metro employment data are released.