Dallas-Fort Worth Economic Indicators

The Dallas–Fort Worth economy continued its expansion in June, albeit at a slower pace than in May. Job growth was nearly flat, and expansion in the Dallas and Fort Worth business-cycle indexes moderated. The unemployment rate held steady in Dallas but dipped in Fort Worth. Residential construction rose in May, in part driven by the expanding DFW economy.
Employment
Employment Growth
DFW jobs grew at a 0.2 percent annualized rate in June—significantly slower than the state’s 3.6 percent pace (Chart 1). Payrolls in Dallas contracted 0.7 percent, while Fort Worth saw 2.5 percent growth.
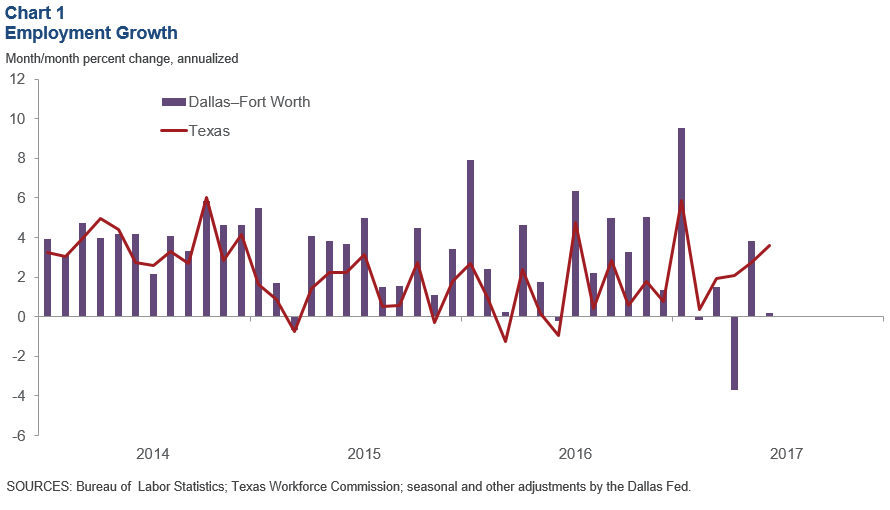
The labor market in the metroplex remained tight, with unemployment in both Dallas and Fort Worth lower than the state figure. Unemployment in Dallas was unchanged at 3.8 percent in June, while the rate in Fort Worth edged down from 4.7 percent to 4.5 percent. The jobless rate dipped to 4.6 percent in Texas, while it ticked up from 4.3 percent to 4.4 in the U.S.
Employment Growth by Sector
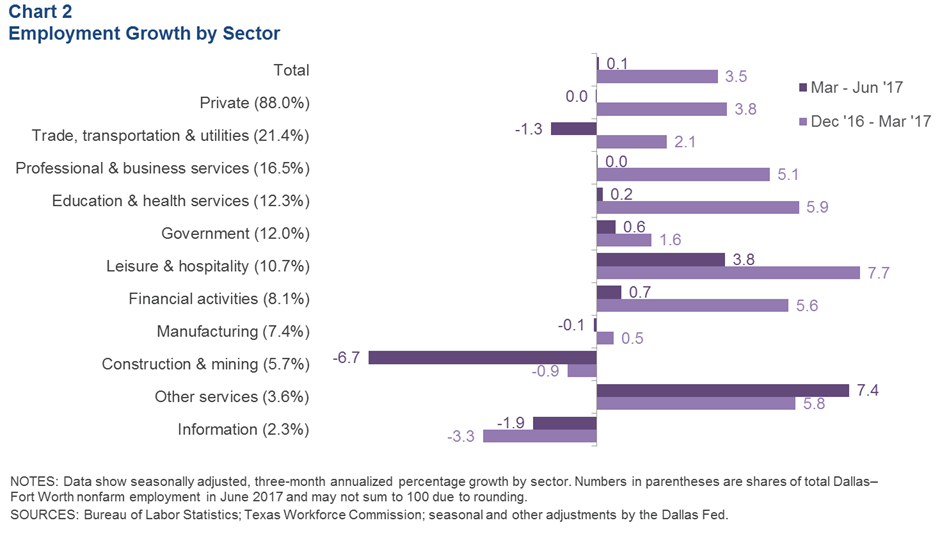
DFW employment was flat from March to June after it increased an annualized 3.5 percent from December 2016 to March (Chart 2). Payrolls contracted an annualized 0.3 percent in Dallas but grew 1.1 percent in Fort Worth from March to June.
Job growth was generally sluggish across sectors from March to June, and some sectors shed jobs. Employment in the construction and mining sector contracted sharply. Payrolls fell in trade, transportation and utilities—the metro’s largest sector, making up over a fifth of the area’s employment. Job growth in other large sectors such as professional and business services, education and health services, and financial activities saw sluggish gains following strong growth in the first three months of 2017. Only payrolls in “other services” and leisure and hospitality continued to see solid gains from March through June.
Major Metro Employment Growth in Texas
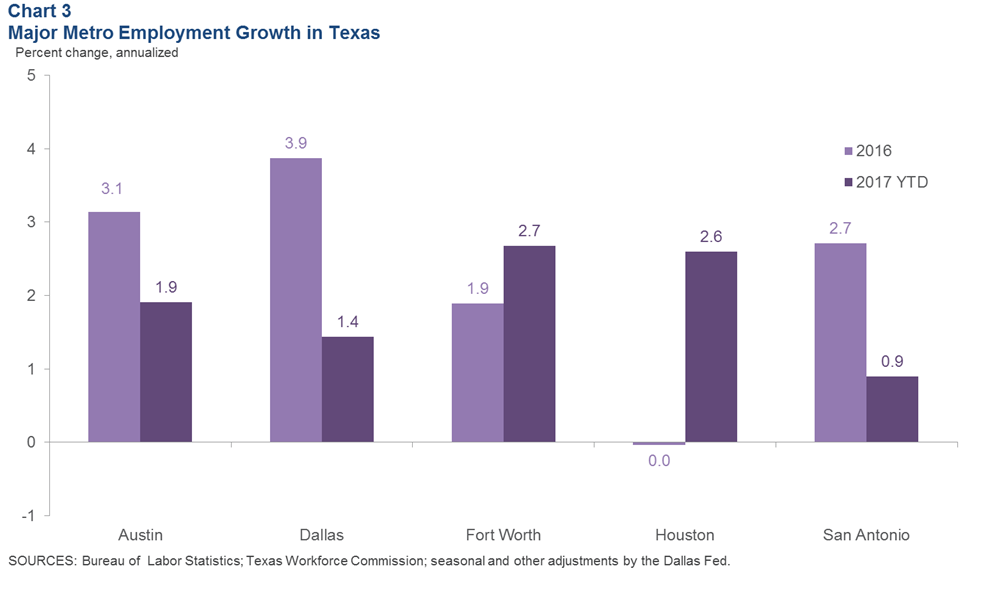
In the first half of 2017, job growth in Dallas moderated to an annualized 1.4 percent, compared with last year’s robust performance of 3.9 percent (Chart 3). In contrast, growth has strengthened in Fort Worth from 1.9 percent in 2016 to an annualized 2.7 percent year to date. Among the major Texas metros, Fort Worth leads in year-to-date job growth, followed by Houston at 2.6 percent and Austin at 1.9 percent.
Business-Cycle Indexes
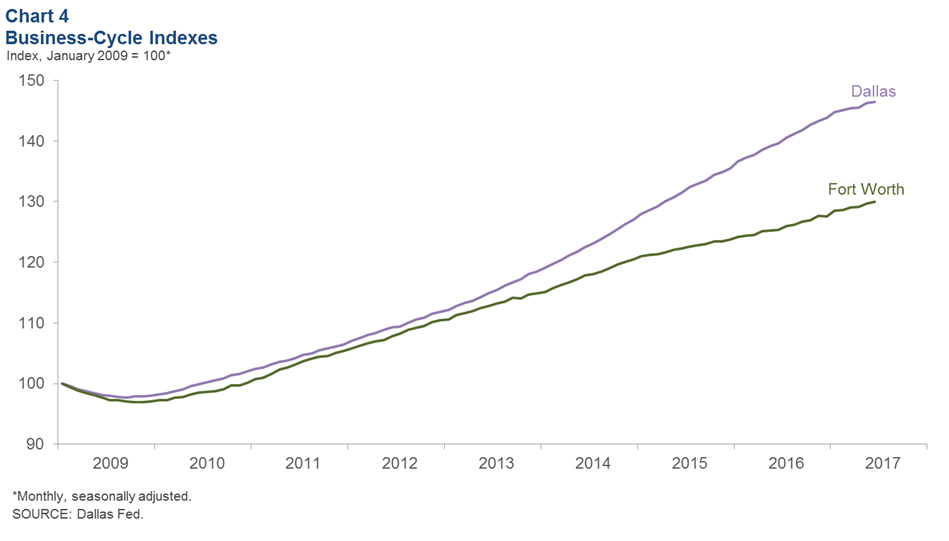
Growth in the Dallas and Fort Worth business-cycle indexes moderated in June (Chart 4). The Dallas index rose an annualized 2.3 percent in June, less than half of May’s 5.7 percent pace. Fort Worth’s index climbed 3.9 percent, slower than May’s 4.3 percent annualized rate. Year over year, the Dallas index was up a solid 5.0 percent and the Fort Worth index was up 3.7 percent.
Residential Construction
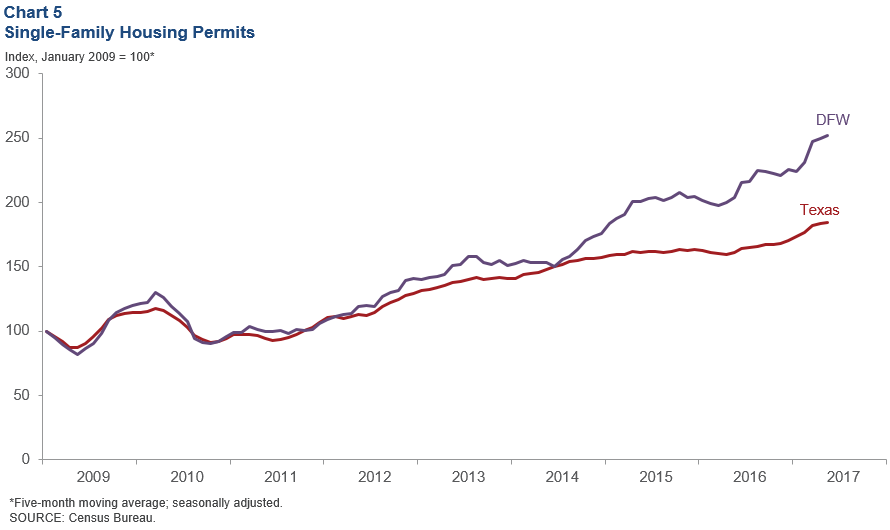
Single-Family Housing Permits
Homebuilding continues to increase in the metroplex, buoyed by strong housing demand. DFW single-family housing permits rose 6.0 percent in May, compared with 2.2 percent statewide. The five-month moving averages also show continued increases (Chart 5). Moreover, total DFW single-family permits were up 23.7 percent in the first five months of 2017 compared with the same period last year, ahead of the 14.8 percent increase for Texas. DFW has outpaced the state in single-family permit issuance since mid-2014. This surge in permits, coupled with tight home inventories and employment gains, suggests that the DFW residential real estate market will see continued growth in the near term.
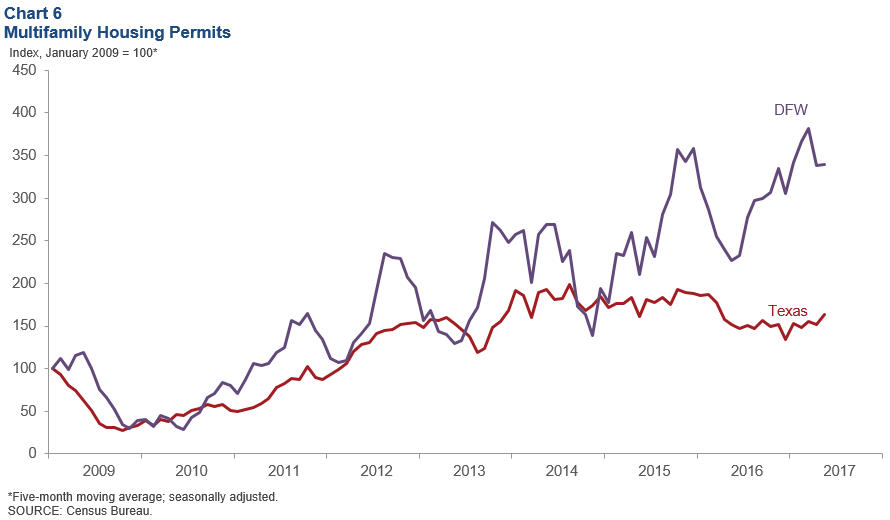
Multifamily Housing Permits
DFW multifamily permit issuance, which leads apartment construction, rose in May following a decline in April (Chart 6). Total DFW multifamily permits were up nearly 50 percent in the first five months of 2017 compared with the same period last year, ahead of the 8.2 percent increase for Texas.
Elevated apartment construction has been matched by solid demand. Dallas ranked third among the major U.S. metros behind New York and Los Angeles in demand for apartments in second quarter 2017, according to data from Real Page Inc. The metro area has been able to fill product nearly as quickly as it has been delivered, keeping occupancy high and rent growth solid. Demand has been driven by the metro’s expanding economy.
NOTE: Data may not match previously published numbers due to revisions.
About Dallas–Fort Worth Economic Indicators
Questions can be addressed to Laila Assanie at laila.assanie@dal.frb.org. Dallas–Fort Worth Economic Indicators is published every month on the Tuesday after state and metro employment data are released.