Dallas-Fort Worth Economic Indicators

The Dallas–Fort Worth economy expanded at a rapid clip in November. The Dallas and Fort Worth business-cycle indexes continued to post above-trend gains, as job growth was strong. Home affordability stayed low in Dallas in the third quarter and dipped in Fort Worth. Home prices rose further in both metros in part due to continued healthy job creation, which has been a driver for the DFW housing market.
Labor Market
Payrolls Expand
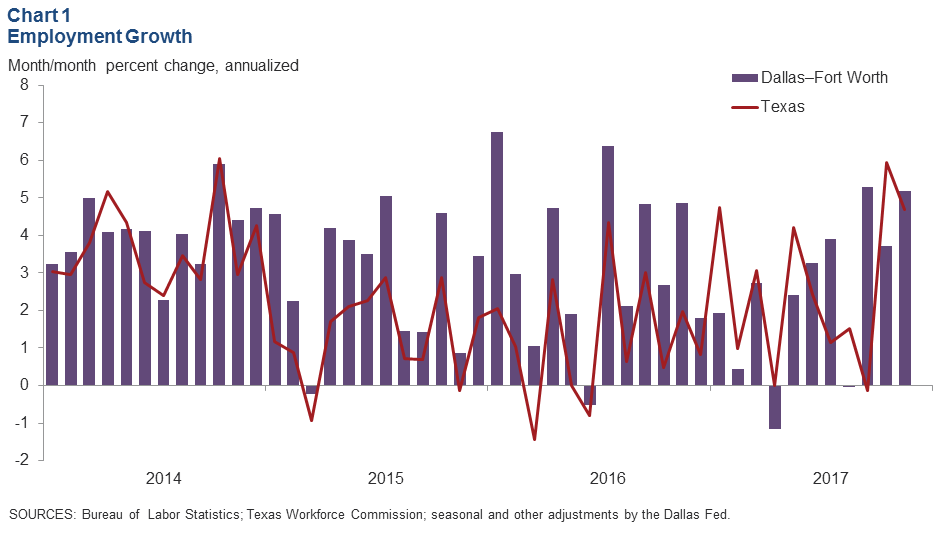
DFW jobs grew at a 5.2 percent annualized rate in November, up from October’s 3.7 percent increase (Chart 1). Payrolls in Dallas rose 6.4 percent and expanded 2.2 percent in Fort Worth for the month. Year-to-date employment in DFW has expanded at a 2.5 percent annual rate, similar to the state’s 2.6 percent growth this year but somewhat slower than the metro’s 3.3 percent growth in 2016 (December/December).
The labor market remained tight. Unemployment in Dallas edged up to 3.3 percent in November but remained well below the state and U.S. rates. The jobless rate in Fort Worth held steady at 4.1 percent. Unemployment dipped to 3.8 percent in Texas—a new record low for the state.
Job Growth Strengthens
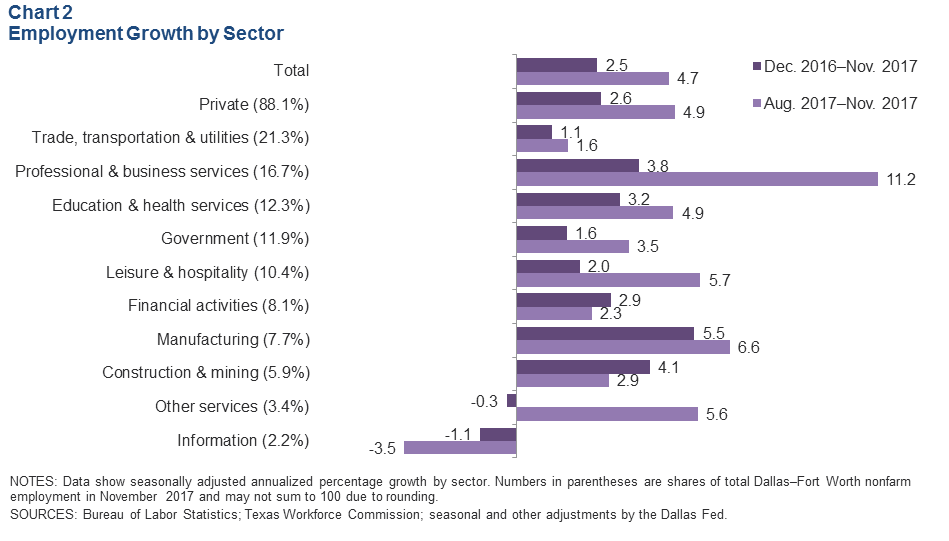
DFW employment growth accelerated to a 4.7 percent annualized rate over the three months through November, compared with the 2.5 percent increase seen year to date (Chart 2). Job gains have been generally broad based and have picked up the pace in most sectors from August to November. Growth (three-month annualized change) in professional and business services employment surged at its fastest rate since early 1999. Employment in other large sectors such as education and health services, leisure and hospitality, and manufacturing has been healthy as well in the past three months. The exception has been information services, where employment has declined both in the past three months and year to date.
Business-Cycle Indexes
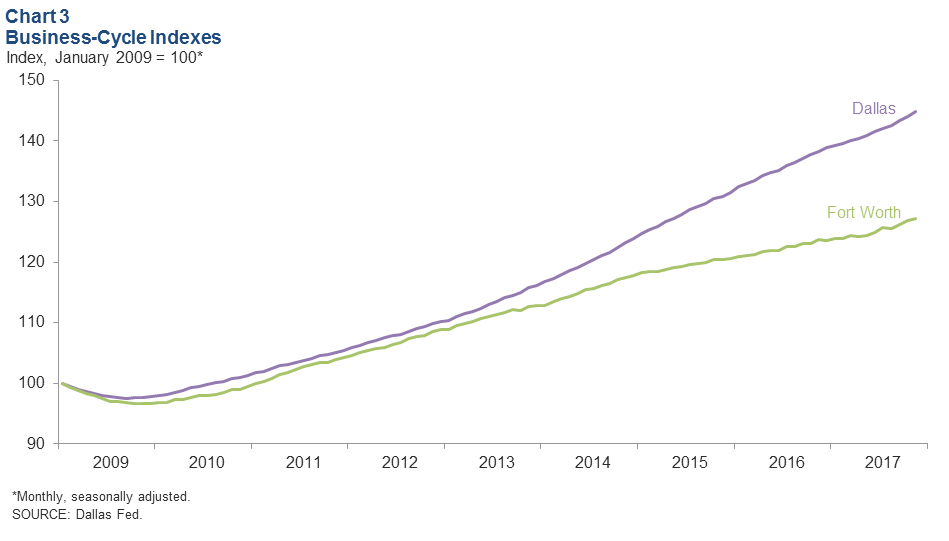
Gains in the Dallas and Fort Worth business-cycle indexes remained robust in November (Chart 3). The Dallas index climbed an annualized 7.3 percent in November following October’s 5.8 percent pace. This is above its long-term trend of growth and is the fastest the index has expanded since mid-2016. Fort Worth’s index climbed 3.4 percent after expanding 5.3 percent in October. Year over year, the Dallas index was up a solid 4.8 percent, and the Fort Worth index rose 2.8 percent in part due to continued job creation and declining unemployment.
Housing Market
Home Prices Continue to Climb
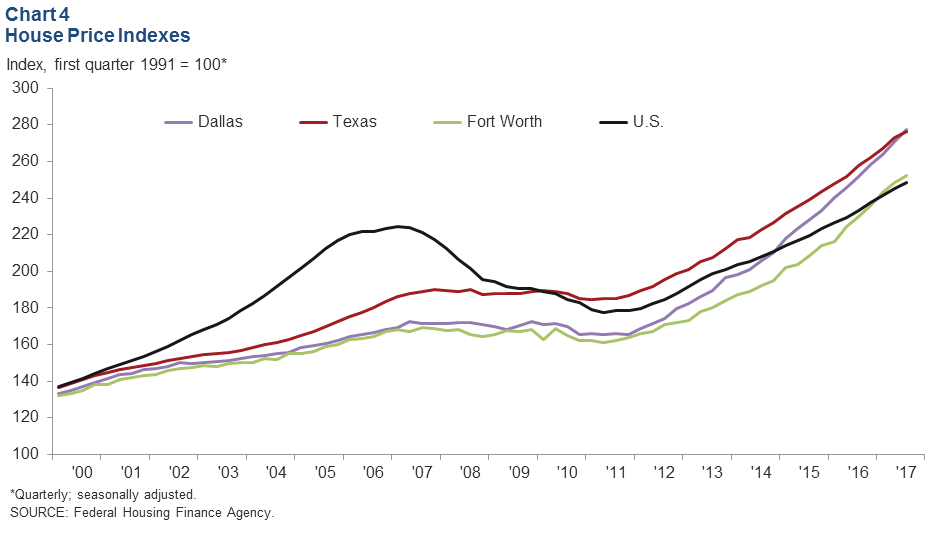
Home price gains in the metroplex continued to outpace those in the U.S. (Chart 4). Prices rose 2.6 percent in Dallas and 1.6 percent in Fort Worth in third quarter 2017, faster than the state’s 1.2 percent and the nation’s 1.4 percent increase, according to the Federal Housing Finance Agency purchase-only house price index. On a year-over-year basis, prices were up 10.4 percent in Dallas and 9.8 percent in Fort Worth—both higher than the Texas rate of 7.1 percent and the nation’s 6.5 percent figure.
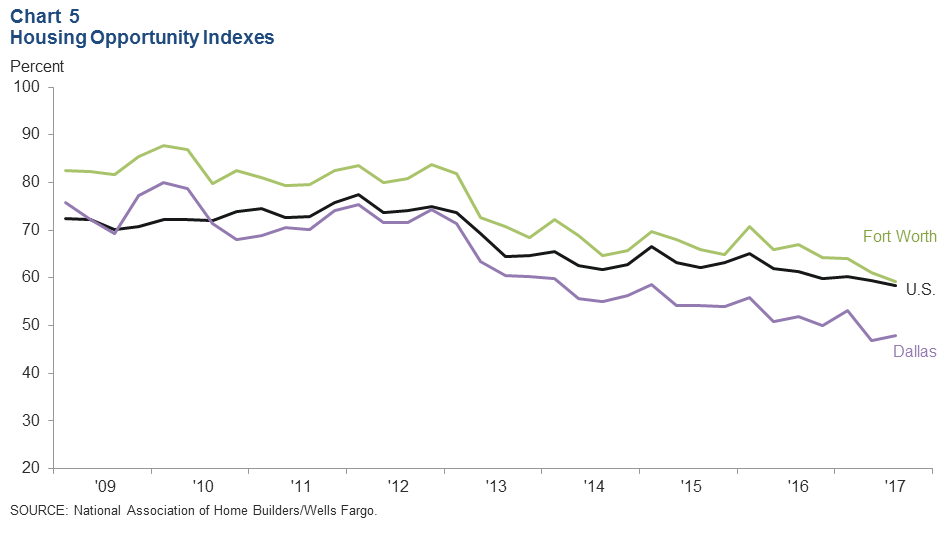
Affordability in Dallas Remains Low
Record home-price appreciation following the Great Recession has eroded housing affordability in the metroplex. According to the National Association of Home Builders/Wells Fargo Housing Opportunity indexes, only 48 percent of the homes (new and existing) sold in Dallas in third quarter 2017 were affordable for a median-income family; this is below the national figure of 58.3 percent (Chart 5). Affordability has been declining in Dallas since 2010, and the index has dropped markedly from its peak set in first quarter 2010. Despite having a lower median home sales price than Austin, affordability in Dallas is the lowest among major Texas metros. Affordability in Fort Worth dipped from 61.2 percent in the second quarter to 59.3 percent in the third, but the metro remains more affordable relative to Dallas and the nation.
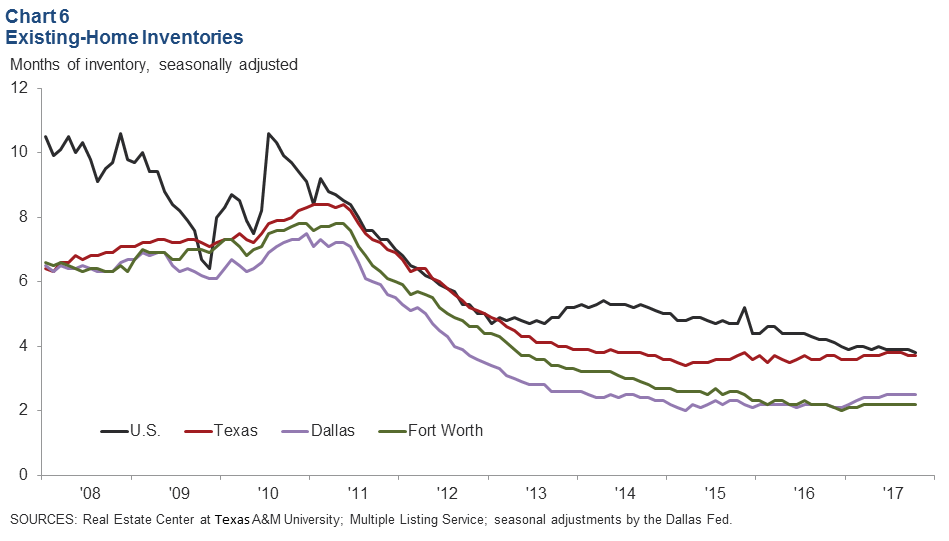
Existing-Home Inventories Still Tight
DFW existing-home inventories remain tight at just over two months, well below the six months’ supply typically associated with a balanced market. In October, inventories were at 2.5 months in Dallas and 2.2 months in Fort Worth (Chart 6). Inventories in both Dallas and Fort Worth are the lowest among Texas major metros and have been under three months since late 2014.
NOTE: Data may not match previously published numbers due to revisions.
About Dallas–Fort Worth Economic Indicators
Questions can be addressed to Laila Assanie at laila.assanie@dal.frb.org. Dallas–Fort Worth Economic Indicators is published every month on the Tuesday after state and metro employment data are released.