Dallas-Fort Worth Economic Indicators

The Dallas–Fort Worth economy expanded modestly in December. The Dallas and Fort Worth business-cycle indexes continued to grow at year end, posting solid growth in 2017. Employment growth in 2017 was slower than in 2016 but accelerated in the second half of the year, providing some momentum for continued sound growth in 2018. Through November, growth in DFW housing permits was well ahead of the state’s pace.
Labor Market
Job Gains Modest in December
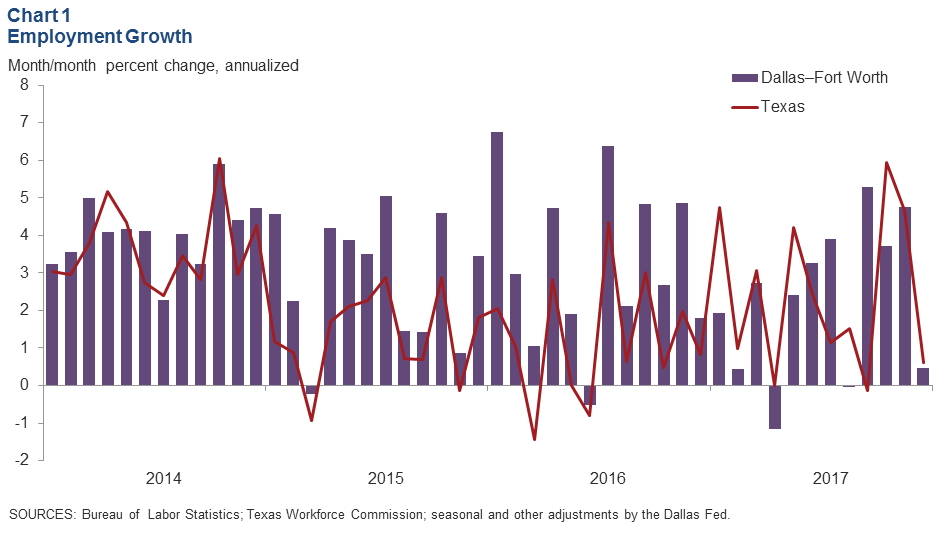
DFW employment ticked up an annualized 0.5 percent in December, similar to the growth at the state level (Chart 1). Payrolls in Dallas dipped 1.1 percent (2,340 jobs) and were more than offset by a 4.4 percent (3,720 jobs) increase in Fort Worth.
The labor market remained tight. Unemployment in Dallas edged up to 3.5 percent in December but was 0.4 percentage points below its December 2016 level, as well as lower than the year-end state and U.S. rates. The jobless rate in Fort Worth held steady at 4.4 percent. Unemployment ticked up to 3.9 percent in Texas and held steady at 4.1 percent in the U.S.
Payroll Gains Broad Based
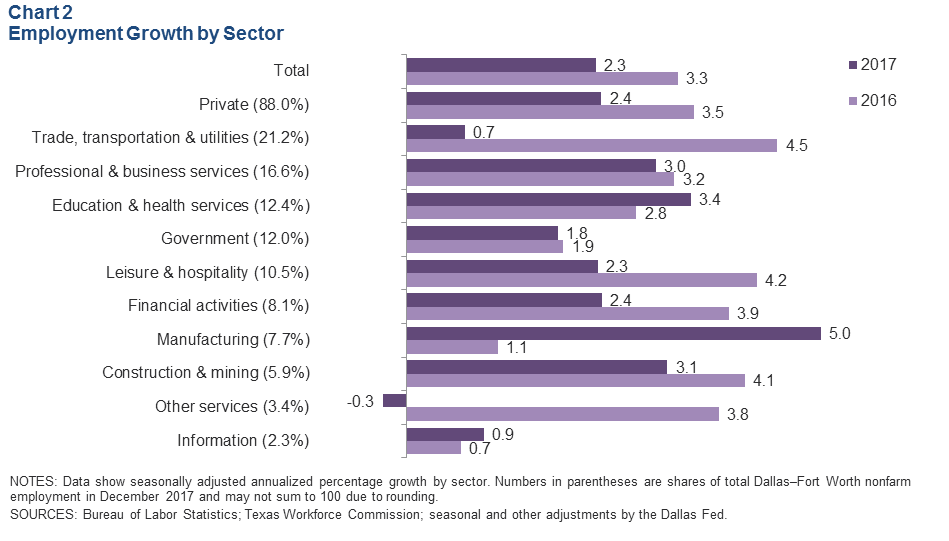
DFW employment growth was broad based but moderated in 2017, with payrolls in most sectors, except for manufacturing, information services, and education and health services, expanding at a slower rate compared with 2016 (Chart 2). Manufacturing payrolls posted the fastest growth among the major sectors last year, followed by education and health services and construction and mining. Employment growth in 2017 may have been limited by the metro’s tight labor market—the unemployment rate in Dallas fell to a 17-year low in October 2017.
Dallas Job Growth Outperforms Fort Worth in 2017
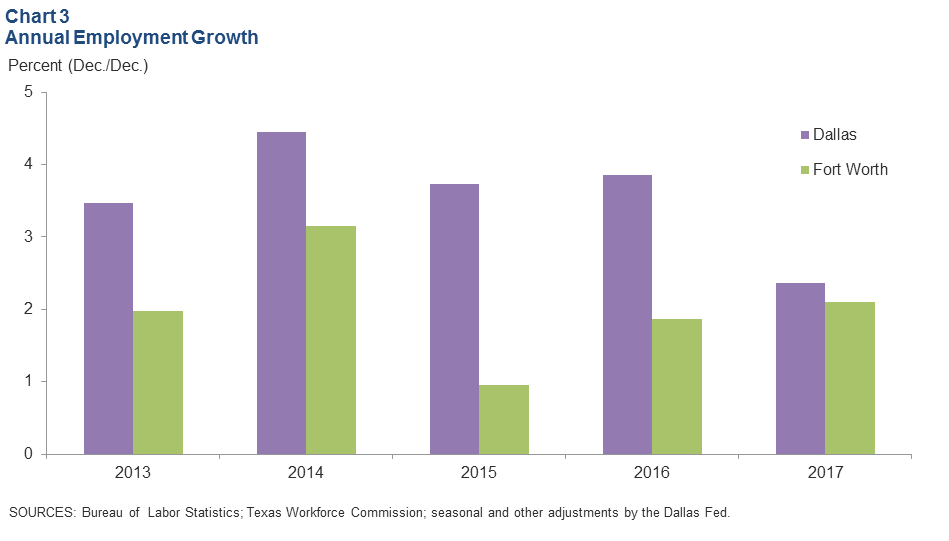
Payrolls in Dallas expanded by 2.4 percent in 2017, once again outpacing Fort Worth’s 2.1 percent increase (Chart 3). Since 2013, employment expansion in Dallas has outperformed that of Fort Worth. Solid job growth in Dallas has been propelled in part by several business relocations, consolidations and/or expansions occurring in the area over the past few years. Growth in Fort Worth slowed in 2015 due to its relatively higher dependence than Dallas on the manufacturing and energy sectors, which were impacted by the oil bust. Growth in Fort Worth picked up slightly in 2017 compared with 2016.
Business-Cycle Indexes
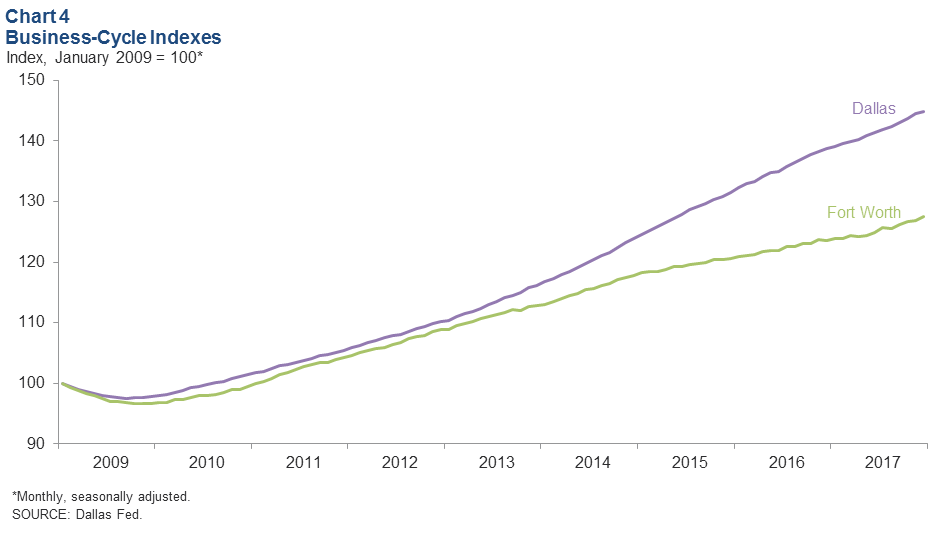
The Dallas Business-Cycle Index continued to grow in December but at a slower rate as job growth weakened and unemployment inched up (Chart 4). The Dallas index rose an annualized 2.5 percent in December, slower than November’s 6.7 percent pace. Growth in the Fort Worth index accelerated to 5.3 percent in December following November’s 1.3 percent increase. In 2017, the Dallas index rose 4.3 percent, while the Fort Worth index was 3.1 percent higher as a result of continued healthy job creation and low unemployment in the metroplex.
Residential Construction
Single-Family Construction Strengthens
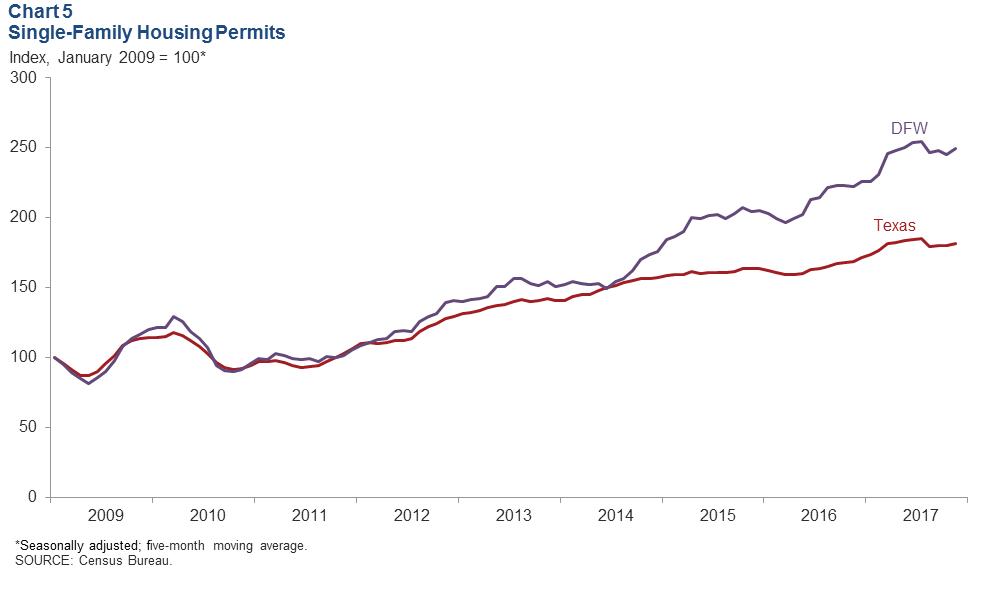
Homebuilding continues to rise in the metroplex, buoyed by strong housing demand. DFW single-family housing permits rose sharply in November, and the five-month moving averages also show continued increases (Chart 5). Through November, total DFW single-family permits were up 17.2 percent compared with the same period last year, ahead of the 11.1 percent increase for Texas. Growth in DFW single-family permit issuance has outpaced the state since mid-2014. This surge in permits, coupled with tight existing-home inventories and solid employment gains, suggests that the DFW residential real estate market will see continued growth in the near term.
Multifamily Construction Remains Elevated
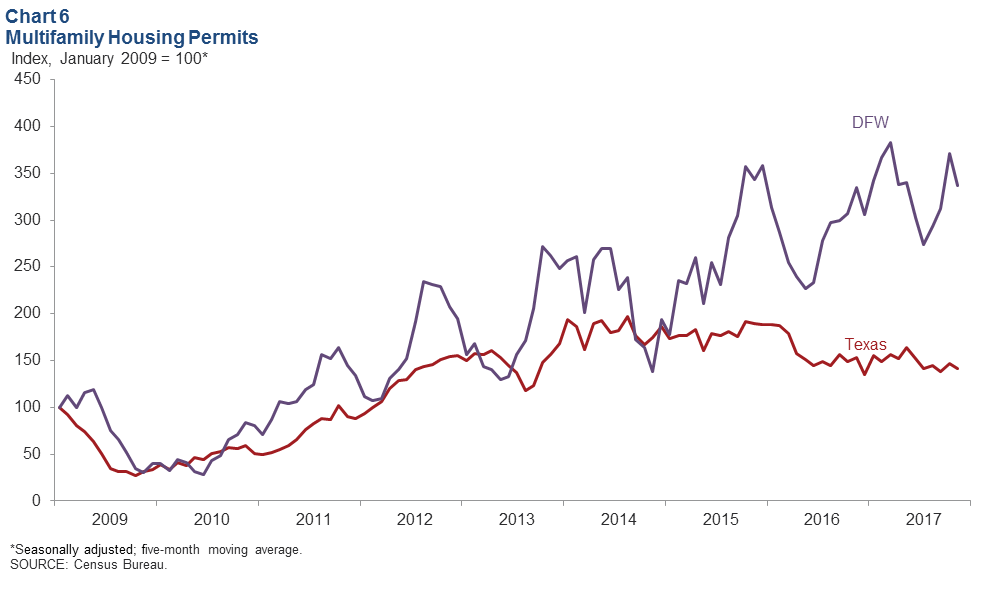
DFW multifamily permit issuance fell in November following an increase in October (Chart 6). Total DFW multifamily permits were up 21 percent in the first 11 months of 2017 compared with the same period last year, well ahead of the 1.4 percent increase for the state. Apartment demand has been driven by the metro’s expanding economy during the past few years. In the latter half of 2017, elevated supply exceeded demand, resulting in a decline in occupancy and moderation in rent growth in the metro area.
NOTE: Data may not match previously published numbers due to revisions.
About Dallas–Fort Worth Economic Indicators
Questions can be addressed to Laila Assanie at laila.assanie@dal.frb.org. Dallas–Fort Worth Economic Indicators is published every month on the Tuesday after state and metro employment data are released.