Dallas-Fort Worth Economic Indicators

July 24, 2020
The Dallas–Fort Worth economy saw further signs of a fledgling recovery in June. Payrolls expanded strongly, and the unemployment rate fell. However, high-frequency data point to a slowing in DFW economic activity since late June that is synchronous with rising new COVID-19 cases and hospitalizations. Apartment and office leasing activity was sluggish in the second quarter due to weak demand, while industrial leasing remained solid.
Labor Market
Payrolls Expand, Unemployment Dips
DFW employment grew a nonannualized 2.6 percent (91,500 jobs) in June following a 2.1 percent increase in May (Chart 1). Payrolls rose a nonannualized 2.4 percent (60,200 jobs) in Dallas and 3.1 percent (31,300 jobs) in Fort Worth. Job growth in DFW surpassed the state’s 1.5 percent nonannualized increase last month. Through June, payroll employment in DFW is down a nonannualized 5.5 percent because of job losses resulting from the COVID-19 pandemic and related stay-at-home orders.
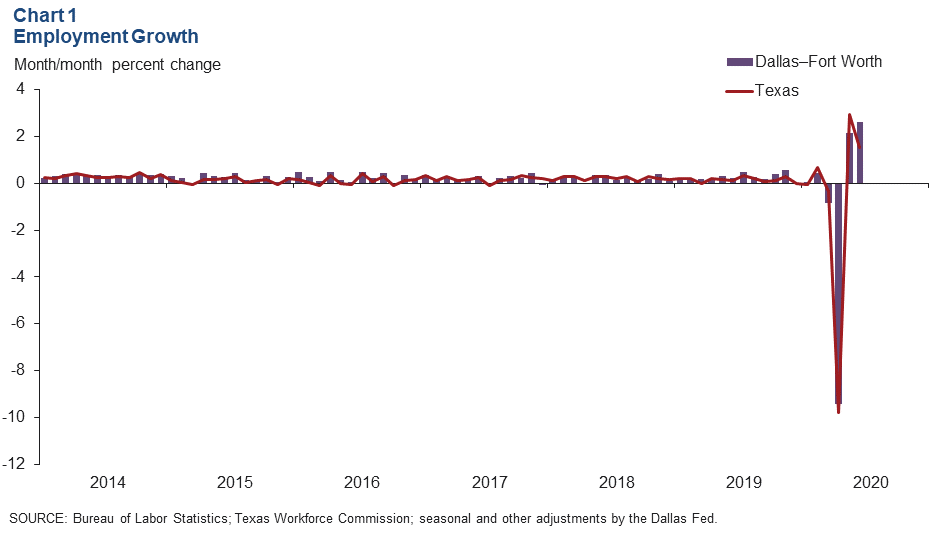
Job gains were widespread, with payrolls in most sectors expanding in June. Employment in the service sector grew strongly, up a nonannualized 3.0 percent (90,300 jobs). Growth in leisure and hospitality—hardest hit by the COVID-19 measures—led the service sector expansion as payrolls increased a nonannualized 15.3 percent (43,100 jobs). “Other” services (3.7 percent, or 4,300 jobs) and trade, transportation and utilities (2.9 percent, or 22,000 jobs)—the metro’s largest sector—also saw sizable gains. Information services and manufacturing were the only major sectors that lost jobs in June.
The unemployment rate fell to a still-elevated 7.1 percent in Dallas and 7.4 percent in Fort Worth in June, lower than the state and national rates of 8.6 and 11.1 percent, respectively.
DFW Mobility and Staffing Decline as COVID Cases Grow
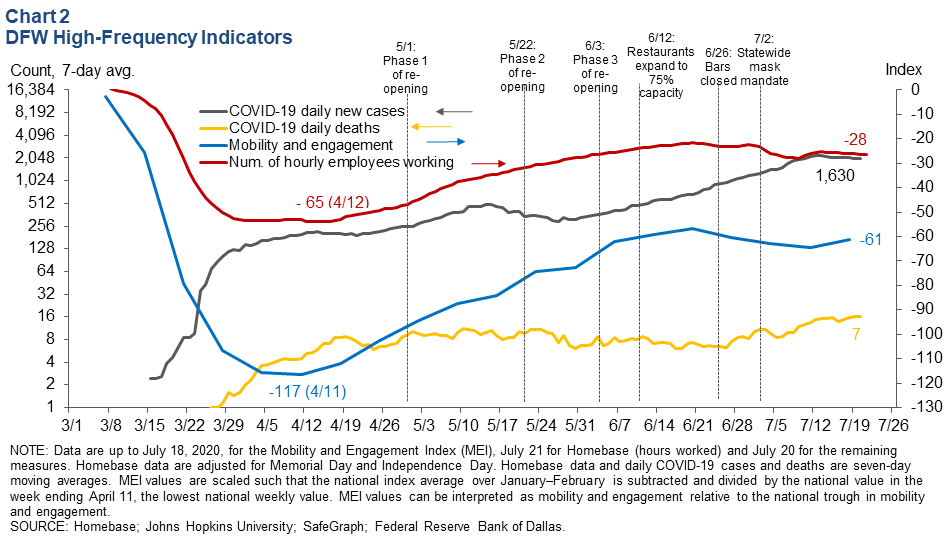
Mobility and staffing have been declining in DFW since late June following a steady increase in COVID-19 cases in the metroplex that began in late May (Chart 2 ). The Dallas Fed’s Mobility and Engagement Index for DFW trended up from mid-April through late June as the economy reopened and individuals left home more often and for longer and traveled farther. The number of hourly employees working also steadily rose over the same period as businesses brought back furloughed workers. This trend reversed in late June amid a resurgence in COVID-19 cases and deaths, likely suggesting that the economic recovery in DFW is losing momentum.
Business-Cycle Indexes
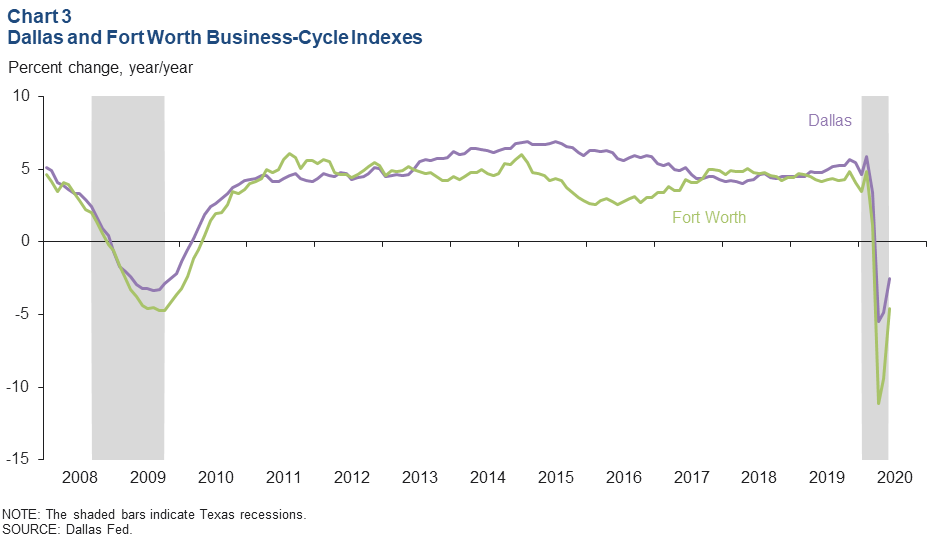
The Dallas and Fort Worth business-cycle indexes showed further improvement in June following a slight rebound in May. The Fort Worth index rose strongly, climbing an annualized 89.9 percent, in part due to a larger employment increase than in Dallas. The Dallas index rose an annualized 41.2 percent, faster than May’s rate. Year over year in June, the index is down 2.5 percent in Dallas and 4.6 percent in Fort Worth (Chart 3).
Real Estate
Apartment Demand Falters amid the Pandemic
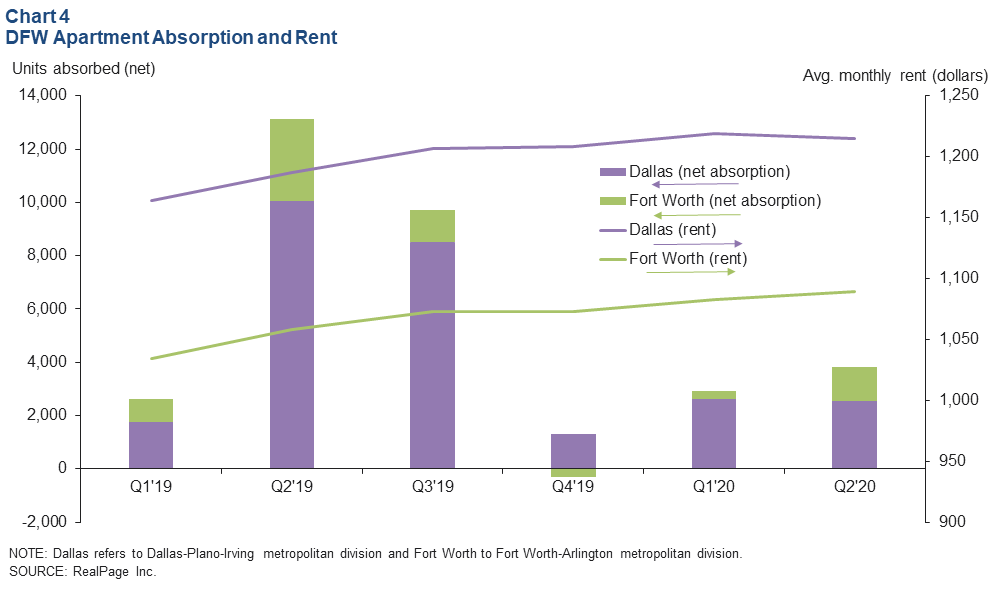
DFW apartment absorption in second quarter 2020 was nearly a third of year-ago levels, coming in at 3,800 units according to data from RealPage Inc. (Chart 4 ). Leasing activity virtually came to a halt in early spring due to stay-at-home orders and slowly regained some momentum in the latter part of the quarter. Demand is seasonally strong in spring and summer months and tapers off as the weather gets colder. Weak demand depressed occupancy and rent growth, with the overall apartment vacancy rate up by nearly a percentage point from second quarter 2019. Rents were little changed, though concessions have increased, and cuts are expected. Construction remained elevated, with roughly 44,000 units under construction.
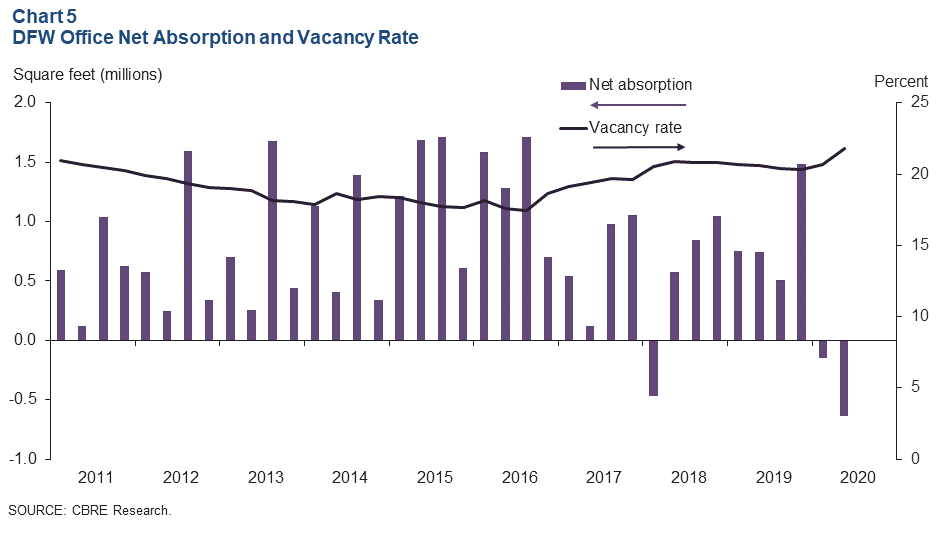
Office Absorption Negative; Vacancy Rates Rise
Demand for office space in DFW remained sluggish in second quarter 2020. Net absorption was negative for the second quarter in a row, partly due to an increase in sublease space. Roughly 640,000 square feet of space was added to the market in second quarter 2020, pushing up the vacancy rate to 21.8 percent, according to data from CBRE Research (Chart 5). Year to date, net absorption has totaled -790,000 square feet and the vacancy rate has risen 1.5 percentage points. The construction pipeline remained full at 4.7 million square feet.
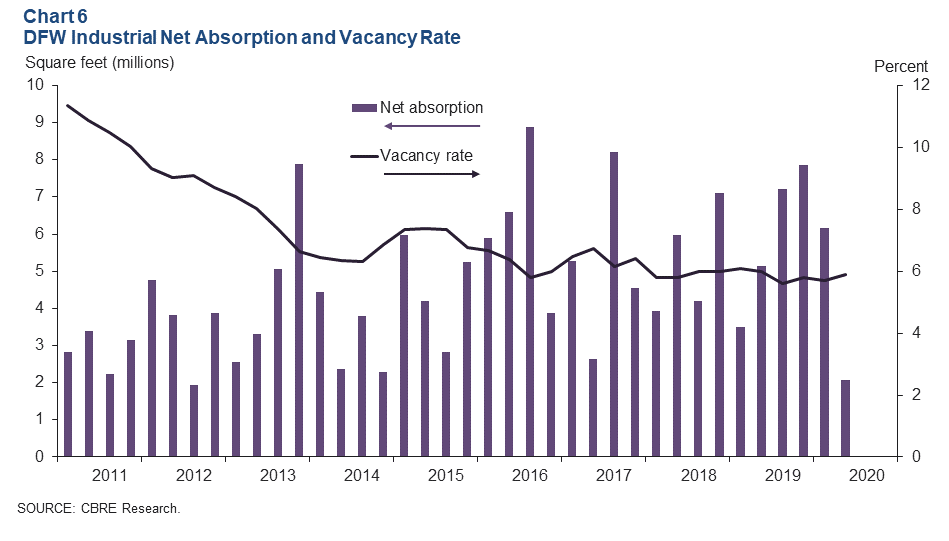
Industrial Demand Remains on Track
Leasing activity for industrial space continued to be solid in the second quarter, driven by demand from consumer goods, e-commerce and third-party logistics firms, according to CBRE. Net absorption was just over 2 million square feet, pushing the total for the first half of the year to 8.2 million square feet, roughly on par with midyear 2019 absorption of 8.7 million square feet (Chart 6). The vacancy rate edged up to 5.9 percent, remaining well below its historical average. Construction stayed elevated at 23.2 million square feet, of which only 19.2 percent was preleased.
NOTE: Data may not match previously published numbers due to revisions.
About Dallas–Fort Worth Economic Indicators
Questions can be addressed to Laila Assanie at laila.assanie@dal.frb.org. Dallas–Fort Worth Economic Indicators is published every month on the Tuesday after state and metro employment data are released.