Dallas-Fort Worth Economic Indicators

December 4, 2020
Dallas–Fort Worth’s recovery from the economic effects of COVID-19 progressed further in October. Payrolls expanded broadly, unemployment dipped and the Dallas and Fort Worth business-cycle indexes rose. Activity in the housing market remained a bright spot, characterized by soaring sales, prices and construction activity. Apartment rent collections in November slightly trailed both October and year-earlier levels.
Labor Market
DFW employment growth strengthened to an annualized 11.1 percent (31,700 jobs nonannualized) in October after increasing 6.3 percent in September (Chart 1). Payrolls rose an annualized 9.9 percent (20,200 jobs nonannualized) in Dallas and 14.2 percent (11,500 jobs nonannualized) in Fort Worth. DFW job growth was broad based and in line with the state’s 10.6 percent annualized increase. This year through October, DFW payroll employment was down an annualized 6.0 percent (192,700 jobs nonannualized) because of losses resulting from the COVID-19 pandemic and related stay-at-home orders.
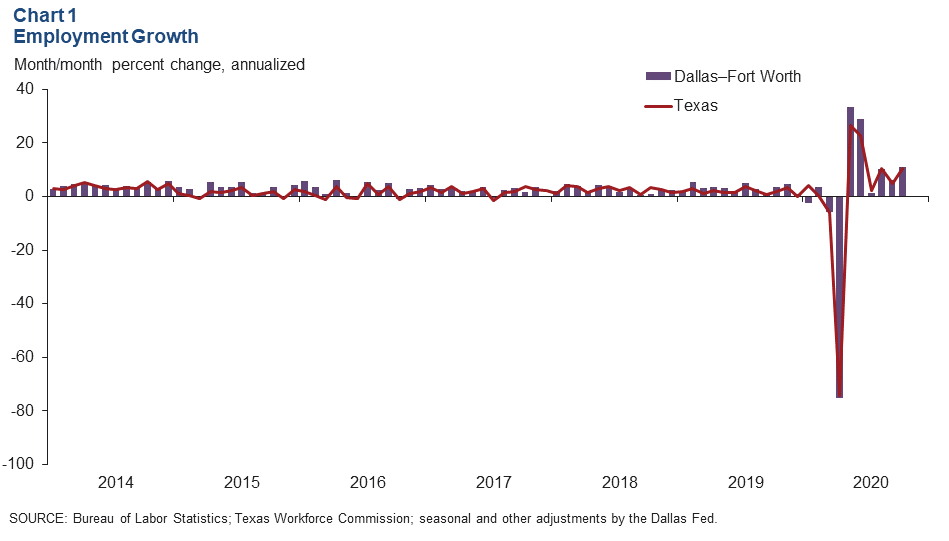
The unemployment rate fell to a still-elevated 6.2 percent in Dallas and 6.4 percent in Fort Worth in October, lower than the state and national rates of 6.9 percent.
Business-Cycle Index
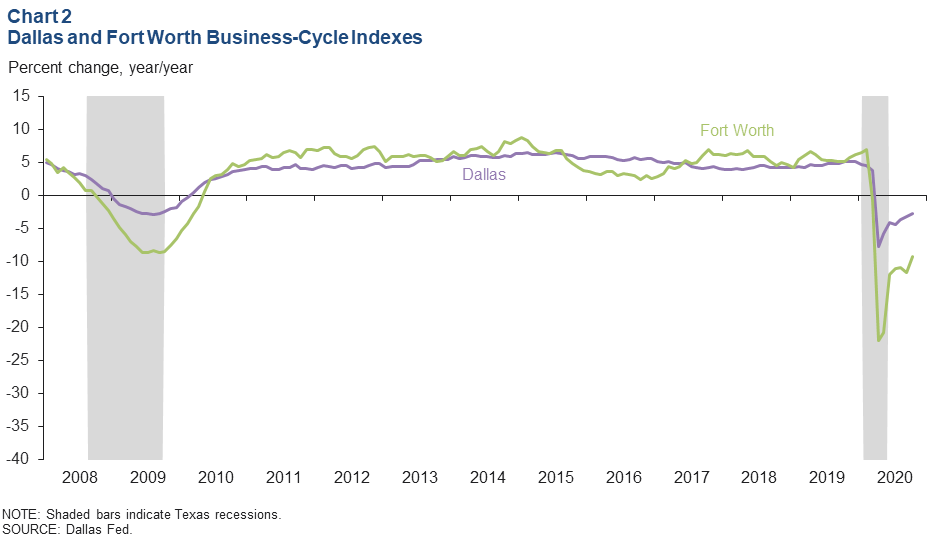
The Dallas Business-Cycle Index expanded in October for the sixth straight month. Meanwhile, the Fort Worth index rebounded somewhat after declining in September. Year over year in October, the indexes were down 2.8 percent in Dallas and 9.3 percent in Fort Worth (Chart 2).
Real Estate
Home Sales Surging
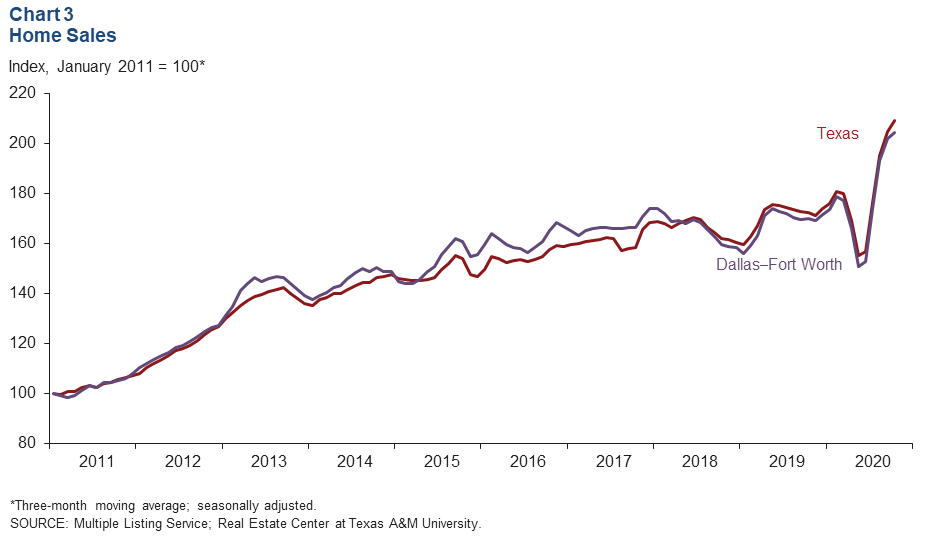
DFW existing-home sales rose further in October, setting new monthly highs. Statewide, home sales expanded strongly as well. The three-month moving averages for both DFW and Texas continued to increase (Chart 3). Sales rose 4.2 percent in DFW and 3.9 percent in Texas in October as record-low mortgage rates and pent-up demand from the economic shutdown supported single-family housing demand. This year through October, both DFW and Texas home sales are 7 percent higher than in the same period last year. According to business contacts, new-home sales have also been robust, outperforming expectations since May, when COVID-19-related shelter-in-place orders were lifted.
Home Prices Soar
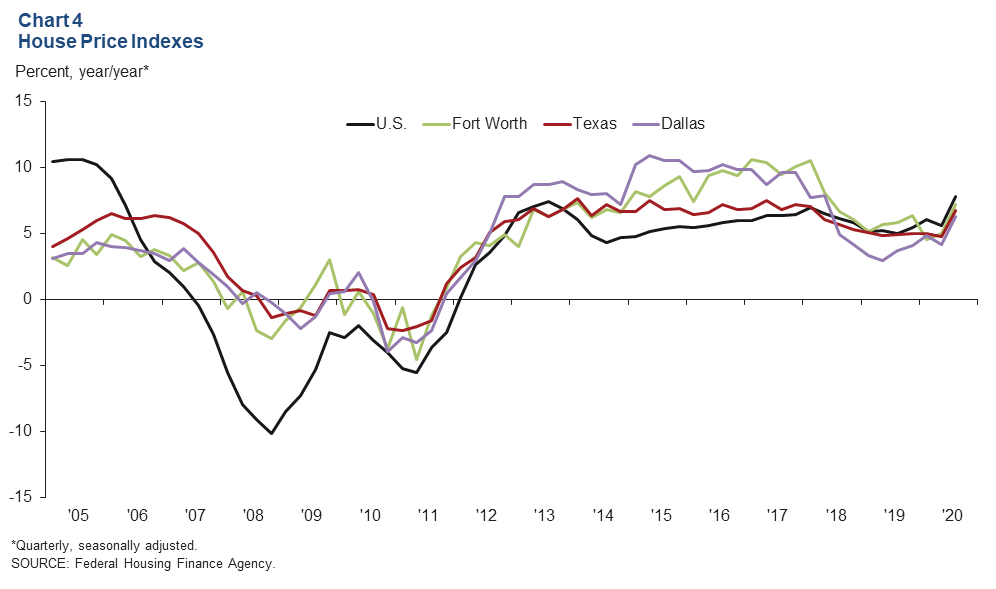
Record home sales and tight inventories continued to boost prices. House prices rose at their fastest pace in three years, increasing 3.0 percent in Dallas and 2.8 percent in Fort Worth in the third quarter, according to the Federal Housing Finance Agency’s Purchase-Only House Price Index. Prices in the quarter were up 6.3 percent in Dallas and 7.2 percent in Fort Worth compared with year-ago levels, while U.S. and Texas prices increased 7.8 percent and 6.7 percent, respectively (Chart 4). Existing-home inventories in Dallas–Fort Worth were under two months of supply in October, well below the six months associated with a balanced market.
Single-Family Construction Ramps Up
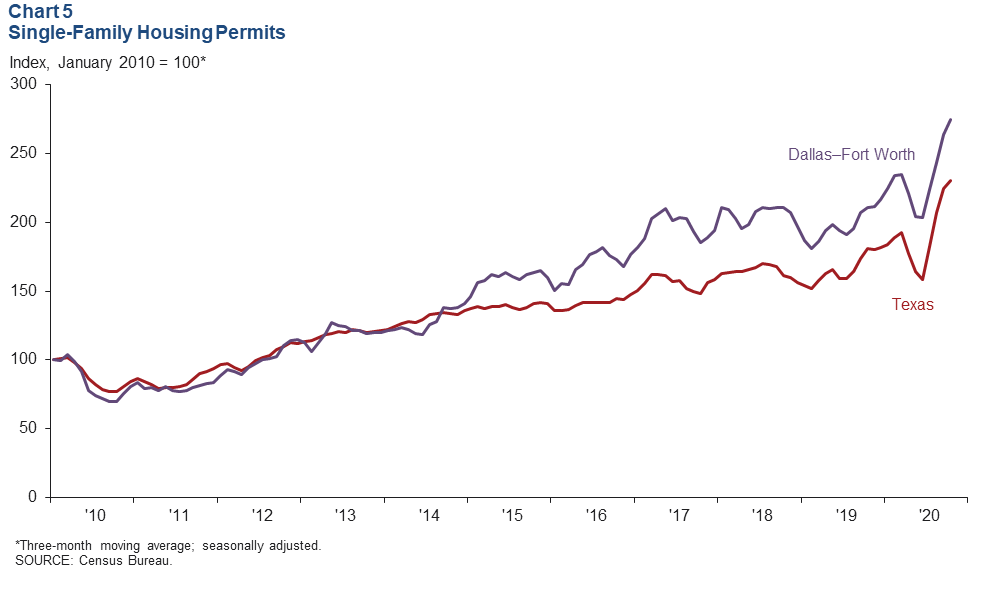
Homebuilding in DFW ramped up, buoyed by robust housing demand. DFW single-family housing permits rose in September and held steady at high levels in October, up 36 percent year over year, and the three-month moving average showed marked growth (Chart 5). Single-family permit issuance fell in the spring as uncertainty over the COVID-19 pandemic weighed on outlooks. After a temporary pause, development activity rebounded strongly, and Dallas Fed business contacts note that firms are moving forward with planned acquisitions and evaluating new deals. This year through October, total single-family permits issued are up 21.3 percent in DFW and 18.5 percent in Texas compared with the same period last year.
Most Apartment Tenants Making Timely Rent Payments
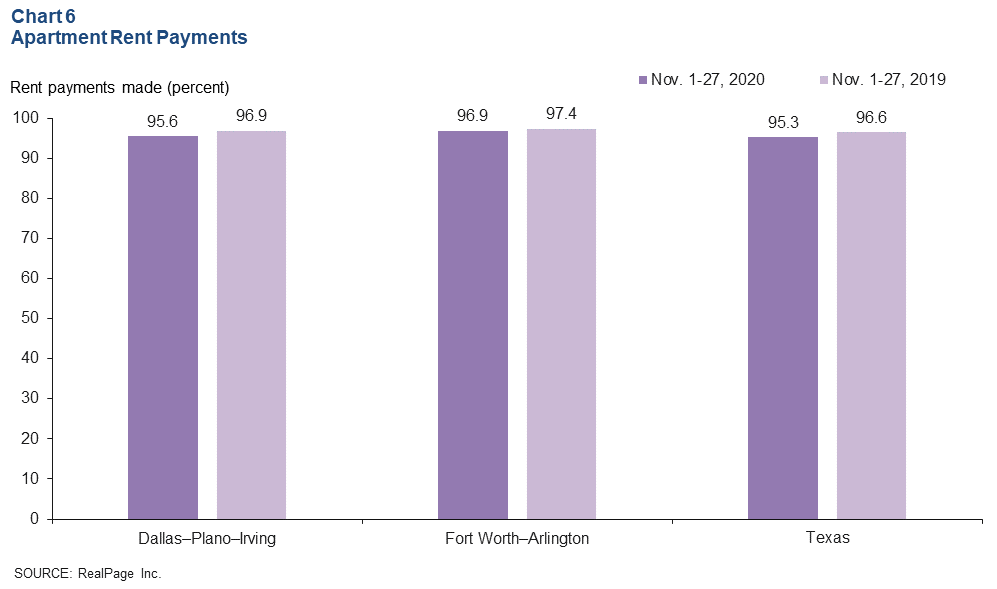
In DFW, most apartment renters continue to make their payments on time despite high unemployment and a lack of new pandemic-driven stimulus payments to individuals. Nearly 96 percent of tenants living in professionally managed market-rate apartments in Dallas and 97 percent in Fort Worth paid their November rent, compared with 95 percent in Texas (Chart 6). The shares trail those in the same period in 2019 by 0.5 percent in Fort Worth and 1.3 percent in Dallas and in Texas. Rent collections for November lagged the shares in October.
NOTE: Data may not match previously published numbers due to revisions.
About Dallas–Fort Worth Economic Indicators
Questions can be addressed to Laila Assanie at laila.assanie@dal.frb.org. Dallas–Fort Worth Economic Indicators is published every month on the Tuesday after state and metro employment data are released.