Dallas-Fort Worth Economic Indicators

September 2, 2021
Recovery in the DFW economy continued at a healthy pace in July. The Dallas and Fort Worth business-cycle indexes expanded, buoyed by strong job growth. With the surge in leasing activity, apartment rents in DFW climbed. Daily COVID-19 cases were rising swiftly in August, though mobility was little changed, and consumer spending remained above prepandemic levels.
Labor Market
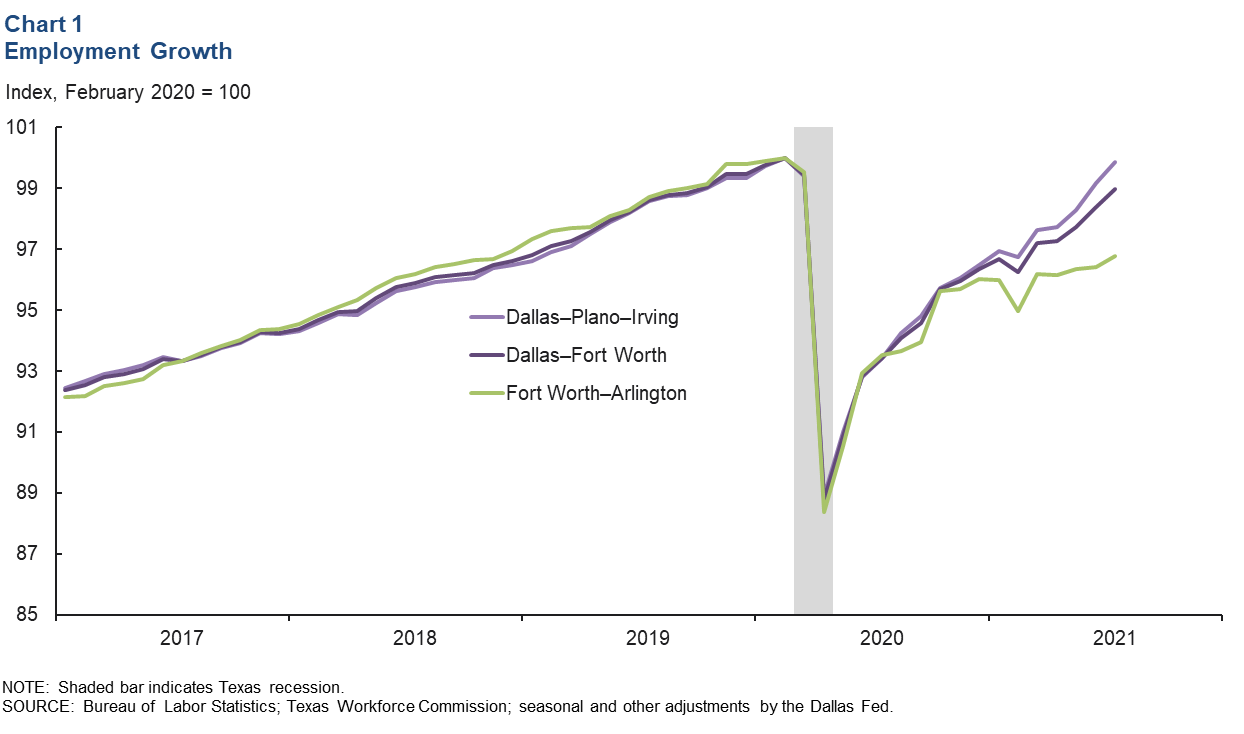
DFW metro-area employment continued to recover at a solid clip. DFW added nearly 23,000 jobs, or an annualized 7.5 percent increase in July after expanding 8.5 percent in June. That brought DFW payrolls to a 91.0 percent recovery of the jobs lost in March and April of 2020 (Chart 1). The Dallas–Plano–Irving metro division had nearly recouped all its lost jobs by July, while the employment recovery in Fort Worth–Arlington trailed with only 72.4 percent of its lost jobs recovered. Total payroll gains in Texas were strong in July as well at an annualized 7.1 percent, straggling the nation’s 8.0 percent increase.
Business-Cycle Indexes
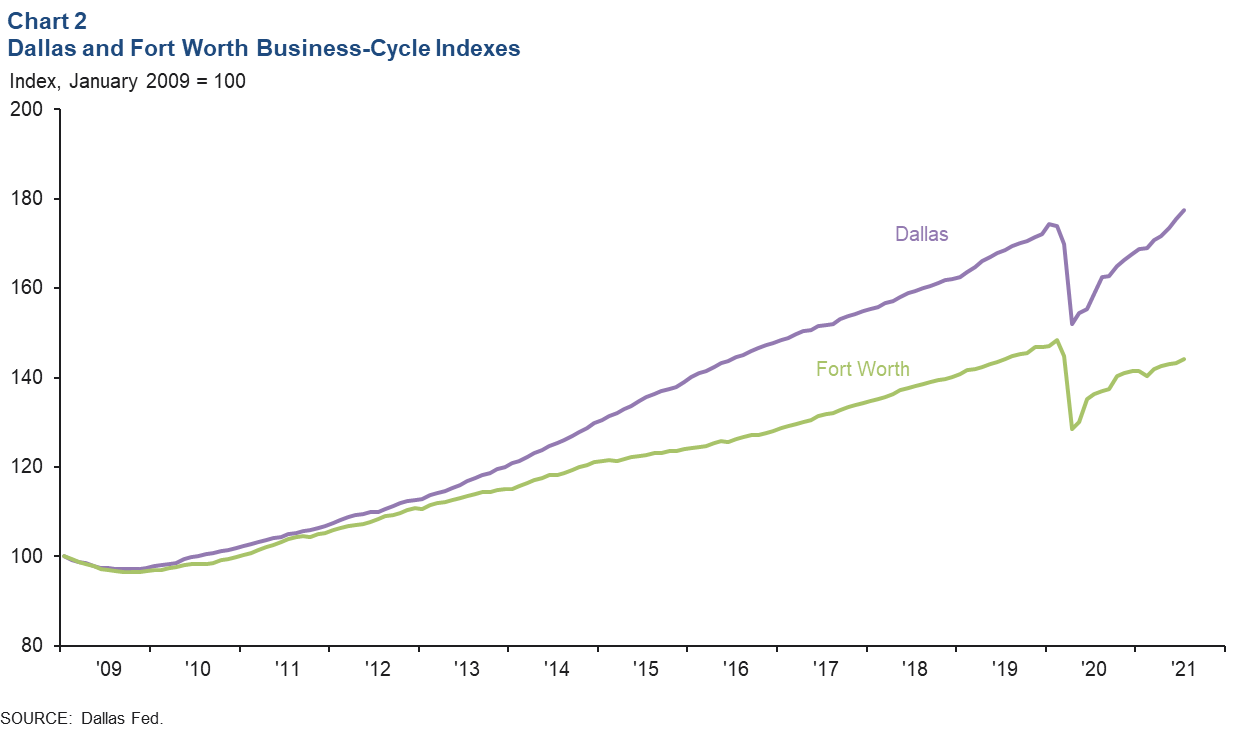
The Dallas and Fort Worth business-cycle indexes—broad measures of economic activity—continued to expand in July, buoyed by recent job gains and unemployment rate declines. The Dallas index rose an annualized 14.3 percent, eclipsing its prepandemic peak and marking the 15th successive month of growth (Chart 2). The Fort Worth index increased 7.7 percent in July, its fifth straight month of expansion; it remains down 2.8 percent from February 2020 levels.
COVID-19 Statistics
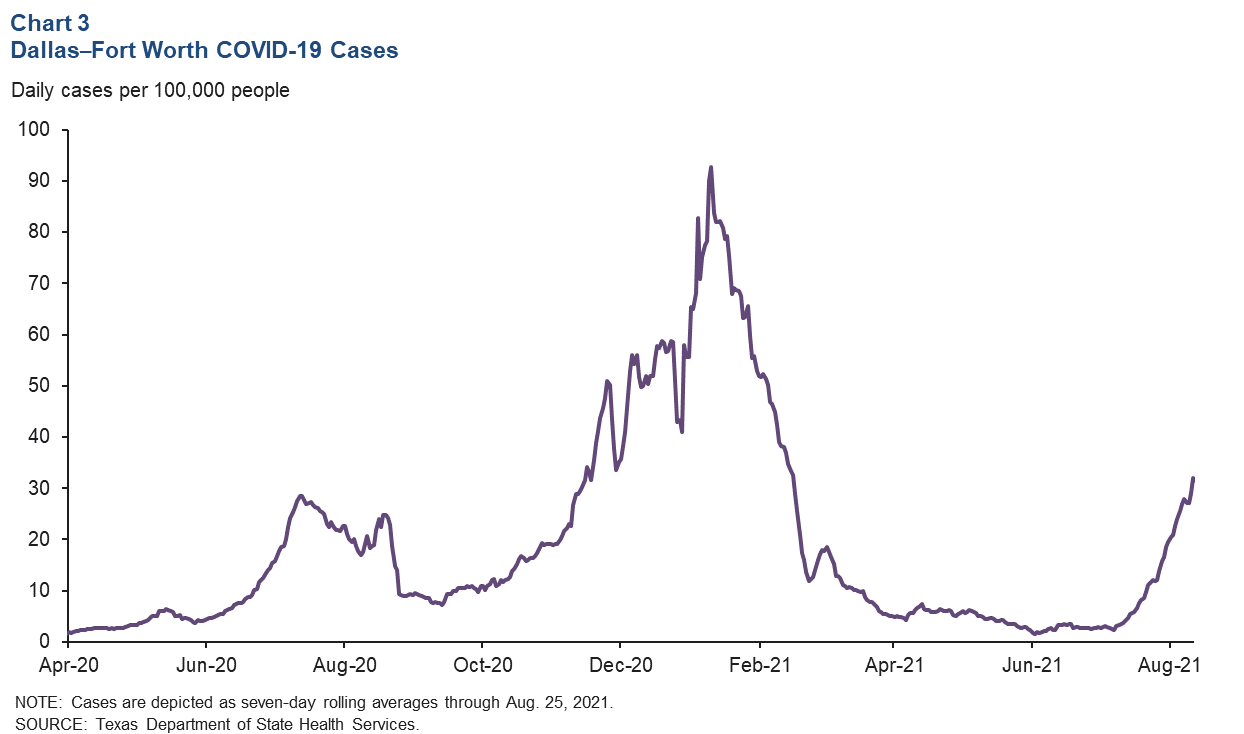
The DFW metro area is currently experiencing its fourth surge of COVID-19 infections. The daily COVID-19 case count has been rising rapidly since July due to the more contagious Delta variant, and the seven-day rolling average as of Aug. 25 was back to its mid-February 2021 levels (Chart 3). Hospitalizations, which trail infections by one to two weeks, are climbing as well; as of Aug. 30, they were up 21 percent in Dallas County and 19 percent in Tarrant County over the previous two weeks, according to data compiled by UT Southwestern.
Consumer Spending
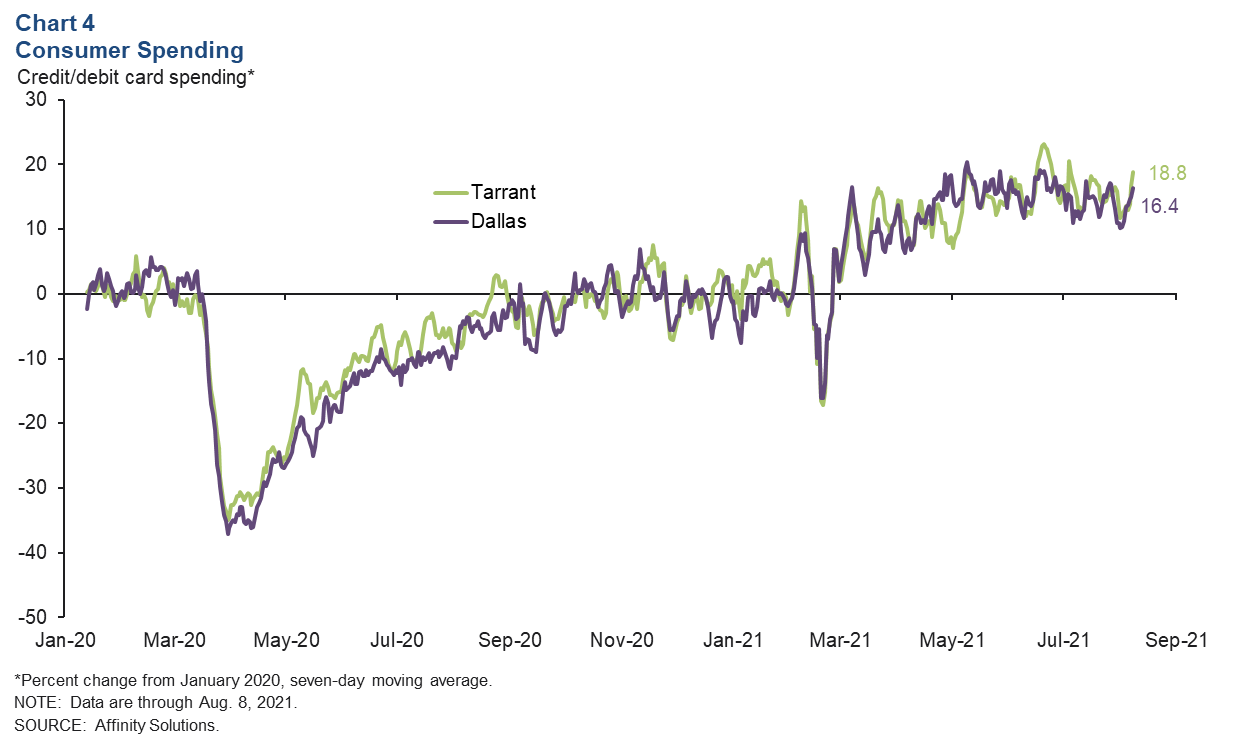
Since late January 2021, consumer spending in DFW has generally been above prepandemic levels, except for the brief decline during the week of Winter Storm Uri in mid-February. Spending in recent weeks has ticked up; as of Aug. 8, it was 16.4 percent higher in Dallas County and 18.8 percent higher in Tarrant County relative to January 2020 (Chart 4).
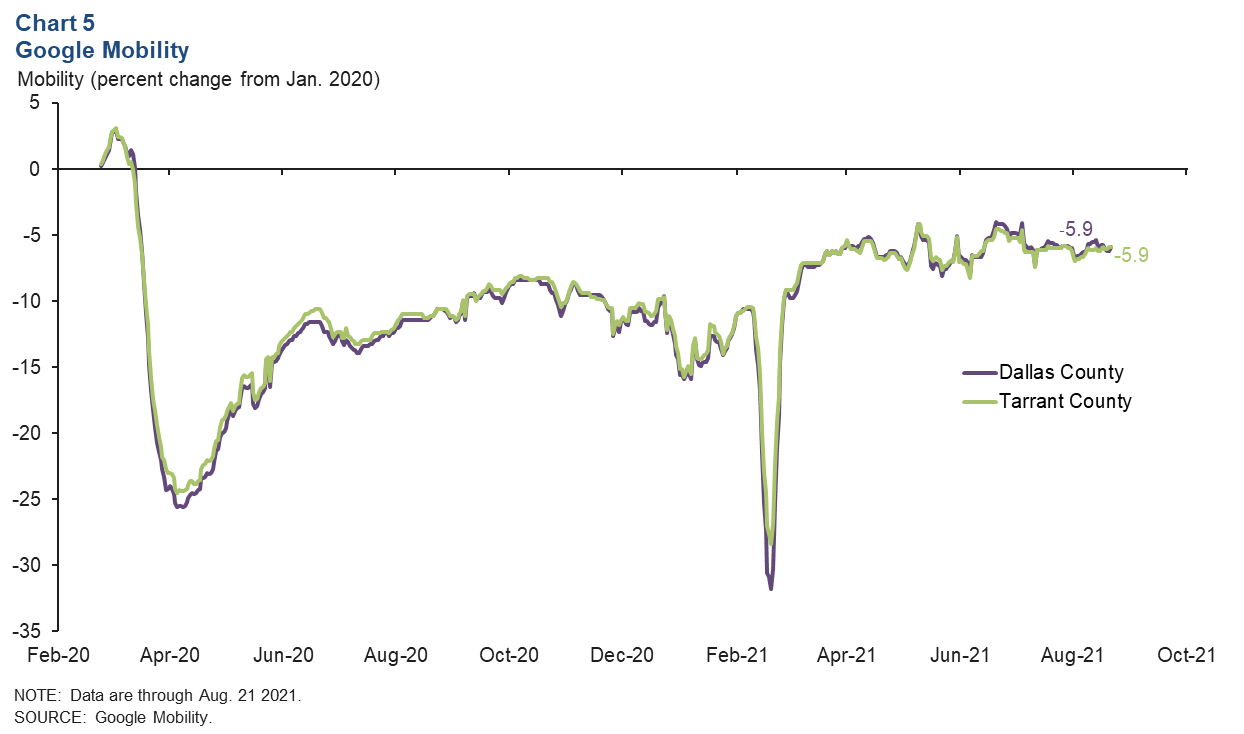
Google Mobility
Google mobility data for Dallas and Tarrant counties showed no signs of slowing in August. As of Aug. 21, Dallas County mobility was down 5.9 percent from January 2020 levels and little changed from its -6.6 percent reading on Aug. 1 (Chart 5). Tarrant County mobility followed a similar pattern, with the index being relatively flat over the same period and down -5.9 percent on Aug. 21 compared with prepandemic levels. This may be due to a combination of schools being back in session and the latest surge in COVID-19 cases.
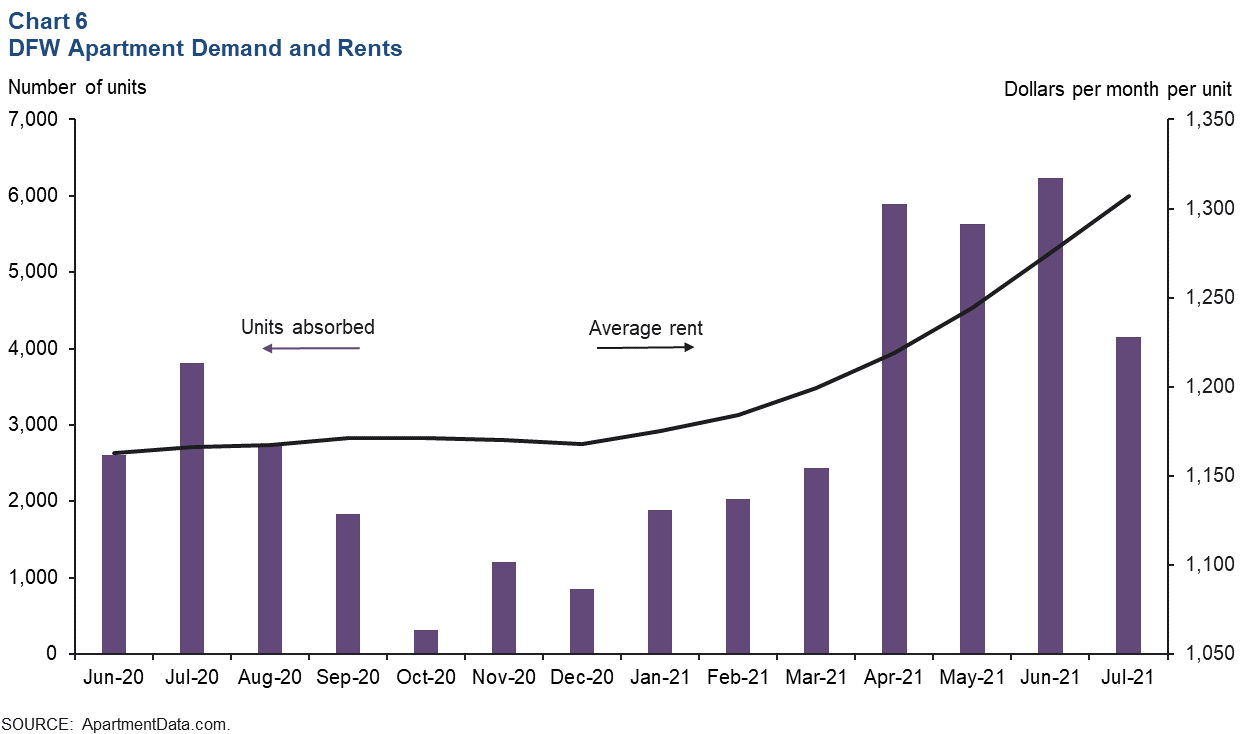
Multifamily
DFW apartment absorption remained strong in July, pushing up occupancy and rents, according to ApartmentData.com. Absorption was solid with a total of 4,146 units absorbed in July after 6,231 units were absorbed in June (Chart 6). Average monthly rents in DFW climbed to $1,307 per unit in July, up 2.5 percent from June and an increase of 12.1 percent from a year ago. Market-wide occupancy rose from 92 percent in June to 92.5 percent in July; however, it remained low in Class A and Class B properties that were in the lease-up phase.
NOTE: Data may not match previously published numbers due to revisions.
About Dallas–Fort Worth Economic Indicators
Questions can be addressed to Laila Assanie at laila.assanie@dal.frb.org. Dallas–Fort Worth Economic Indicators is published every month after state and metro employment data are released.