Dallas-Fort Worth Economic Indicators

April 4, 2022
Dallas–Fort Worth economic growth remained solid in February. Payroll employment grew at a rapid clip, and unemployment held steady for the third straight month. The Dallas and Fort Worth business-cycle indexes expanded further. Apartment leasing and construction continued to be active.
Labor market
Employment gains remain strong
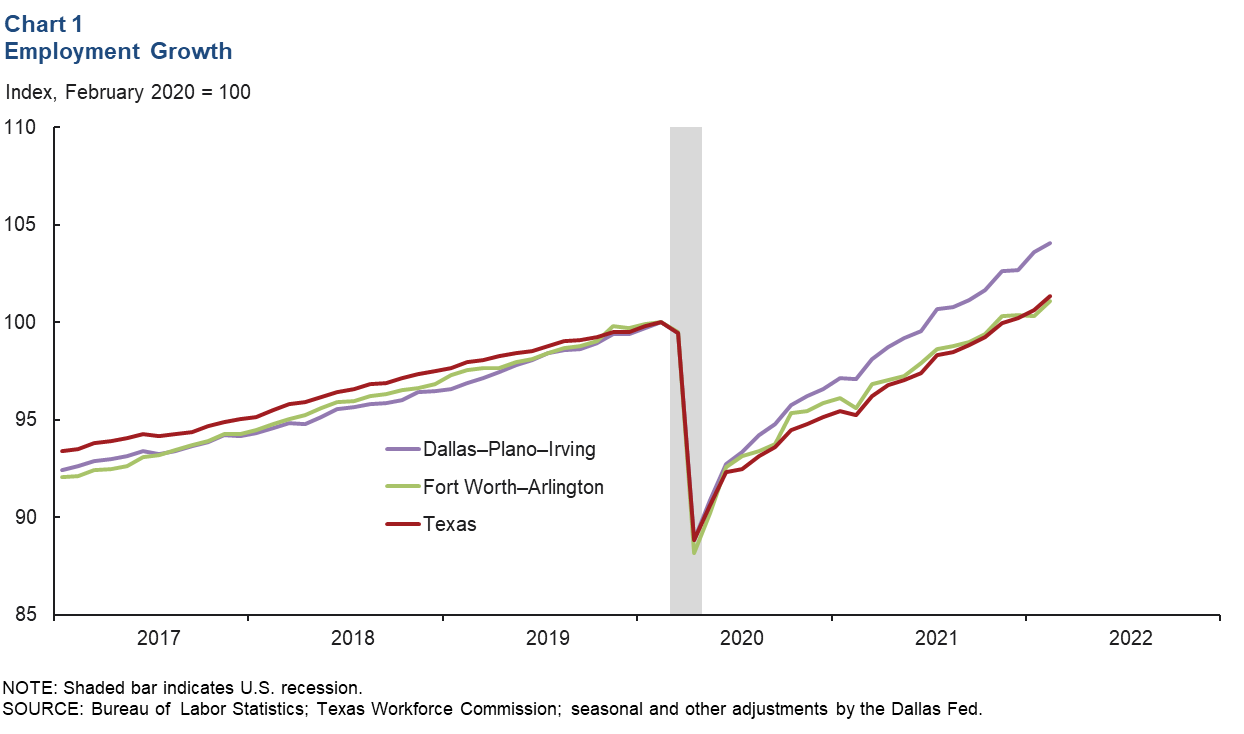
DFW employment rose an annualized 6.3 percent (20,330 jobs) in February. Employment levels expanded 5.2 percent (12,110) in the Dallas–Plano–Irving metro division and 9.2 percent (8,220) in Fort Worth–Arlington. Two years from the onset of the pandemic, DFW employment exceeds the February 2020 peak by 3.2 percent (123,840 jobs). Employment in the Dallas–Plano–Irving metro division was 4.1 percent (111,670) above prepandemic levels, and the Fort Worth–Arlington division’s employment was 1.1 percent (12,170) higher than prepandemic levels (Chart 1). Payrolls in Texas were 1.4 percent (176,760) above their prepandemic high.
Unemployment holds steady
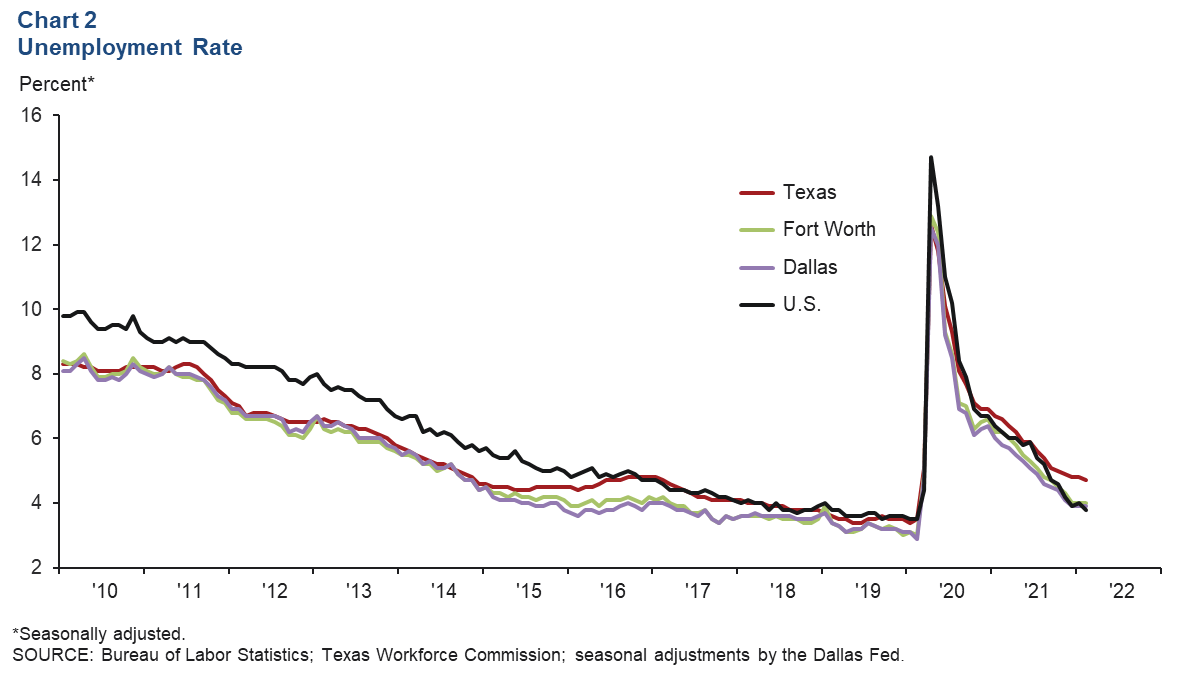
The DFW labor market continued to be tight, with unemployment close to prepandemic lows. In February, the unemployment rate remained at 3.9 percent in Dallas and 4.0 percent in Fort Worth (Chart 2). The jobless rate in Texas and the U.S. dipped to 4.7 percent and 3.8 percent, respectively. Labor force expanded an annualized 4.6 percent in Dallas and 4.2 percent in Fort Worth, faster than the state’s 3.4 percent rise and the nation’s 2.3 percent increase.
Business-cycle index
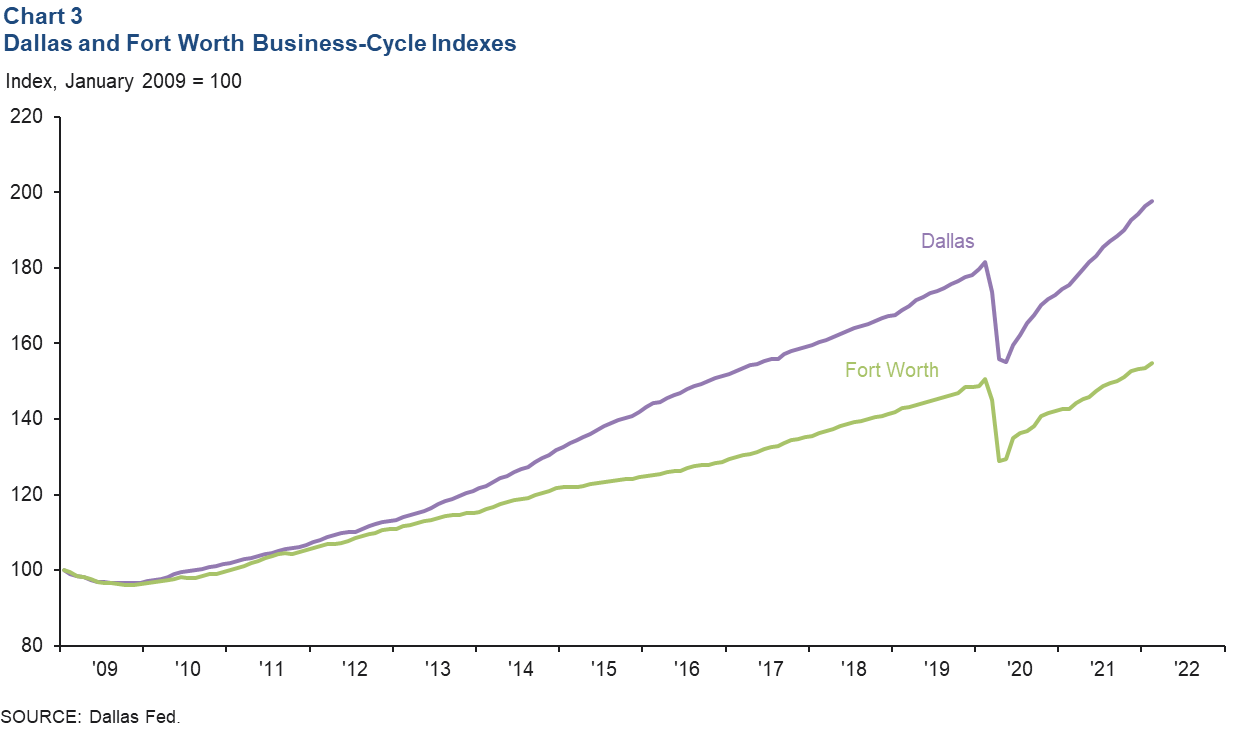
Expansion in the Dallas and Fort Worth business-cycle indexes persisted in February, supported in part by strong job growth. The Dallas index climbed an annualized 9.6 percent, marking the 21st straight month of growth, and was up 8.9 percent from its February 2020 level (Chart 3). The Fort Worth index climbed 9.6 percent (annualized) and eclipsed its prepandemic peak by 2.8 percent.
Multifamily housing
Apartment demand stays solid
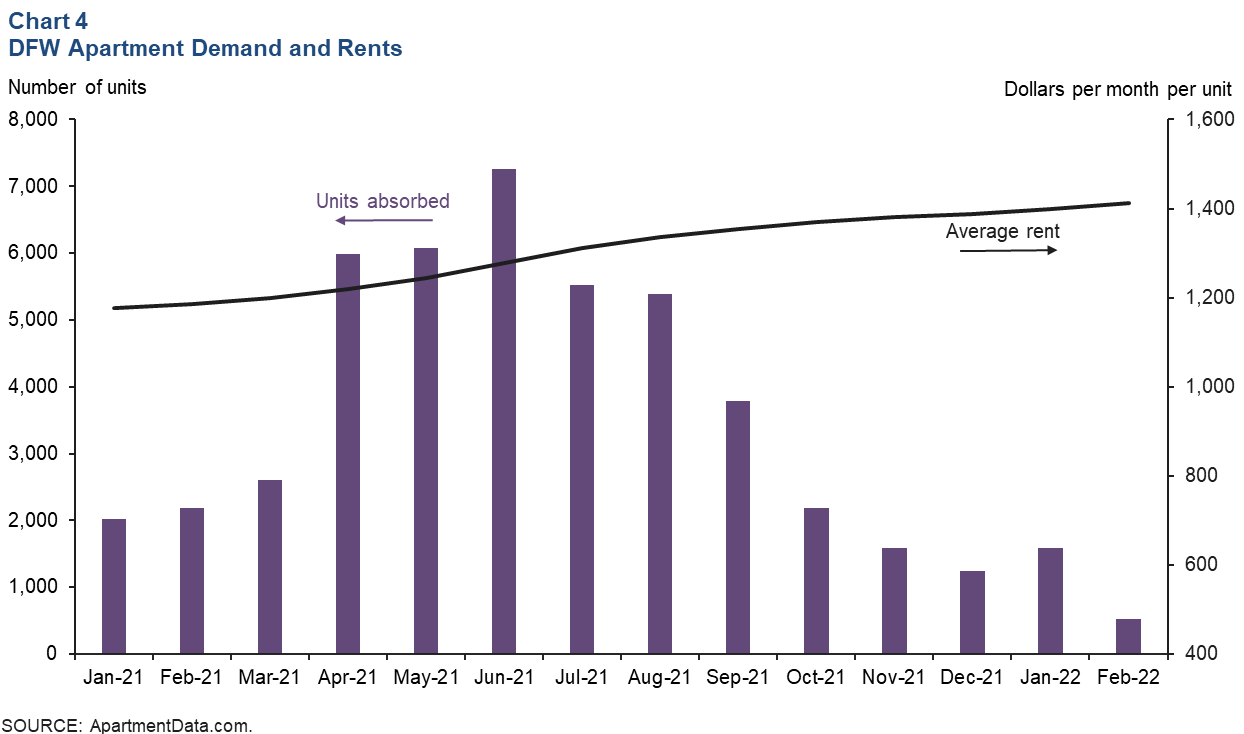
DFW apartment absorption remained positive, further pushing up occupancy and rents, according to ApartmentData.com. A total of 2,100 units were absorbed in the first two months of the year (Chart 4). Average monthly rents in DFW increased to $1,413 per unit in February, up 19.2 percent year over year, and occupancy rose to 93.2 percent—2.7 percentage points higher than February 2021.
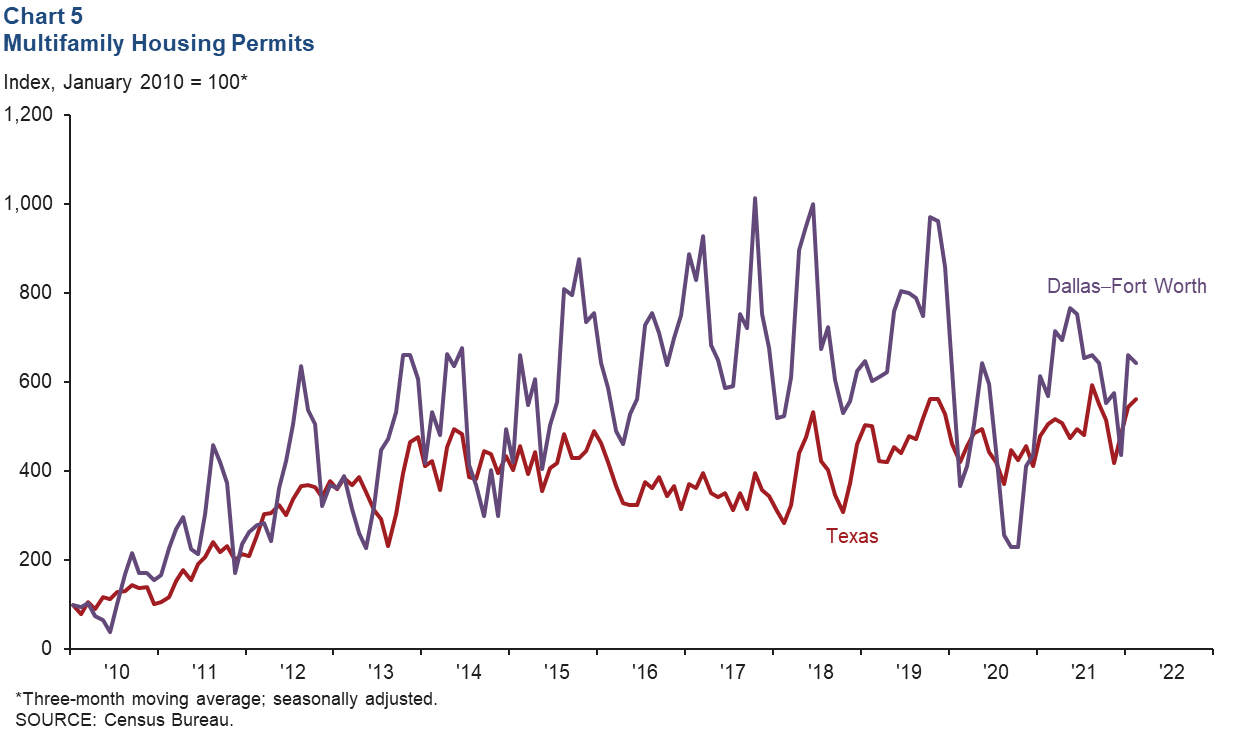
Multifamily construction high
Multifamily permit issuance, which leads apartment construction, fell in February, pulling the three-month average down (Chart 5). However, in the first two months of the year, DFW multifamily permits were up 21.7 percent compared with the same period in 2021. Statewide, multifamily permits were up 1.0 percent over this time frame. DFW multifamily permit issuance rose strongly last year after a brief pause in 2020. DFW remains one of the busiest markets in apartment building among large U.S. metros, with construction being supported by strong employment and population growth.
NOTE: Data may not match previously published numbers due to revisions.
About Dallas–Fort Worth Economic Indicators
Questions can be addressed to Laila Assanie at laila.assanie@dal.frb.org. Dallas–Fort Worth Economic Indicators is published every month after state and metro employment data are released.