Dallas-Fort Worth Economic Indicators

September 28, 2022
Dallas–Fort Worth’s rapid economic growth slowed in August. Payrolls contracted, unemployment was unchanged and growth in the business-cycle indexes slowed. Demand for apartments was sluggish in August, though multifamily permit issuance climbed. Single-family permits fell further but remained highly elevated.
Labor market
Payrolls contract in August
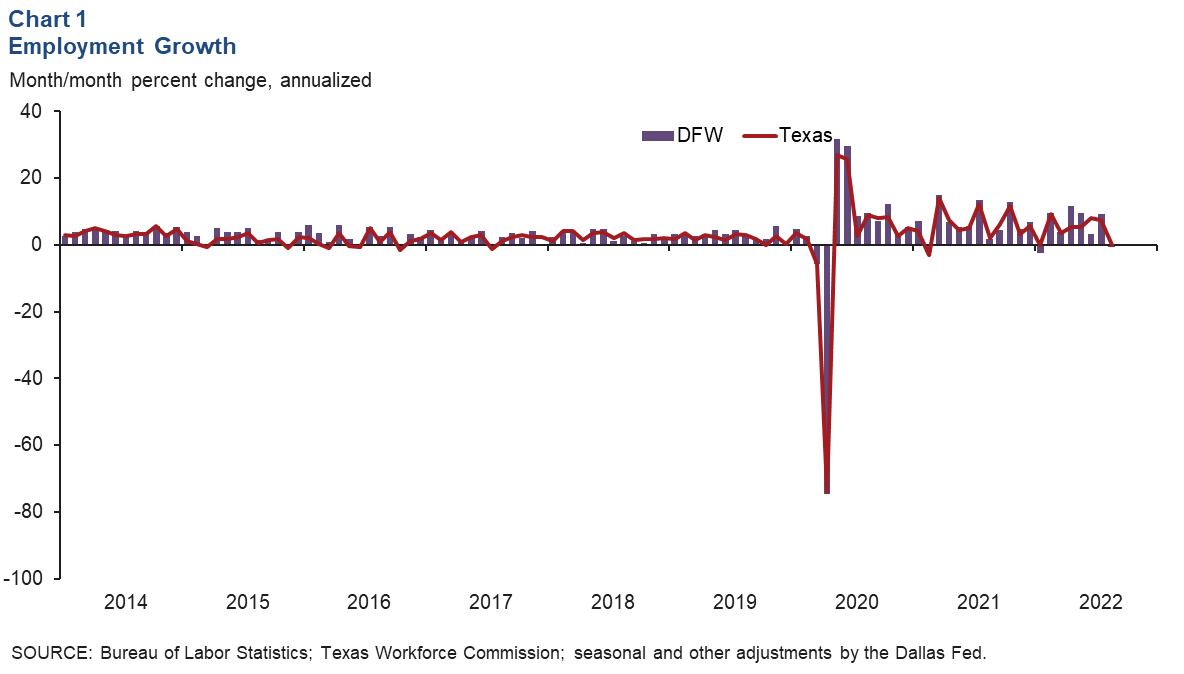
DFW employment fell an annualized 0.6 percent (-1,950 jobs) in August, marking the first month of job losses since January 2022 (Chart 1). Payrolls in Dallas dipped an annualized 0.7 percent (-1,800), and employment in Fort Worth was little changed (-150). Texas’ payrolls held steady in August after growing 7.6 percent in the prior month. Unemployment rates were unchanged at 3.5 percent in Dallas and 3.6 percent in Fort Worth; both remain below Texas’ jobless rate of 4.1 percent.
Employment growth mixed
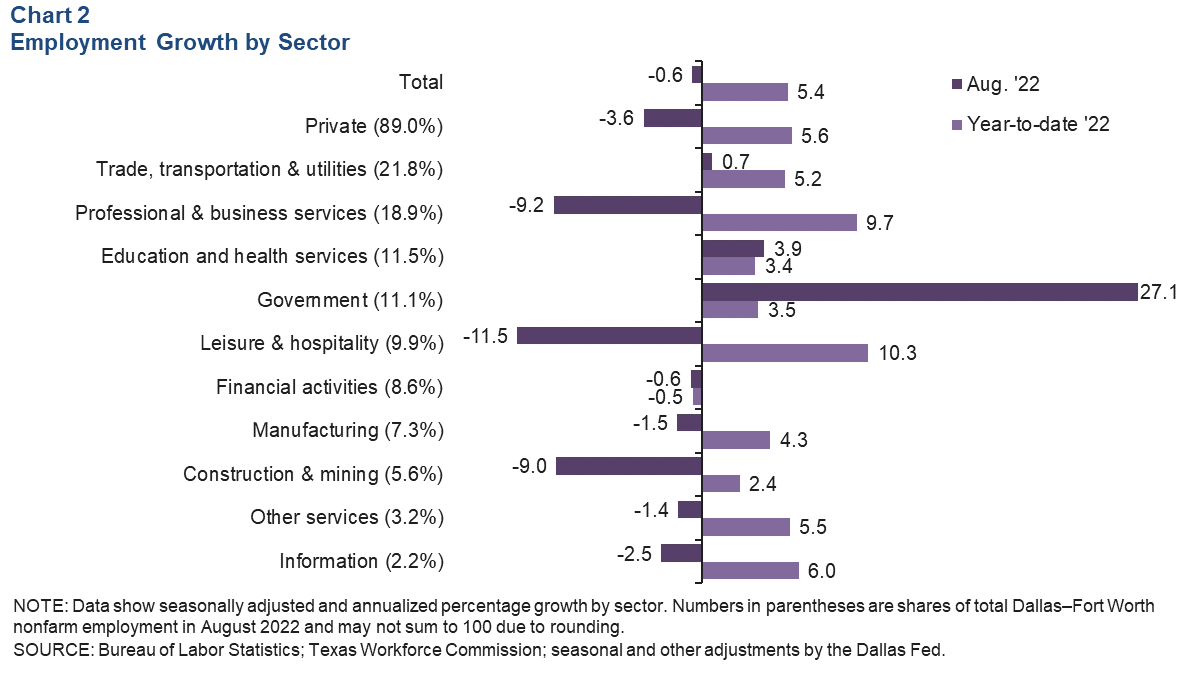
The August deterioration in payrolls was generally broad based across major employment sectors (Chart 2). Declines were led by leisure and hospitality, down an annualized 11.5 percent, or -4,160 jobs, followed closely by professional and business services (9.2 percent, or -6,200 jobs). Government (9,130), education and health services (1,510) and trade, transportation and utilities (500) were the only sectors that added jobs in August. Through August, DFW payrolls have increased a robust 5.4 percent on an annualized basis, with nearly all major sectors posting employment gains.
Business-cycle indexes
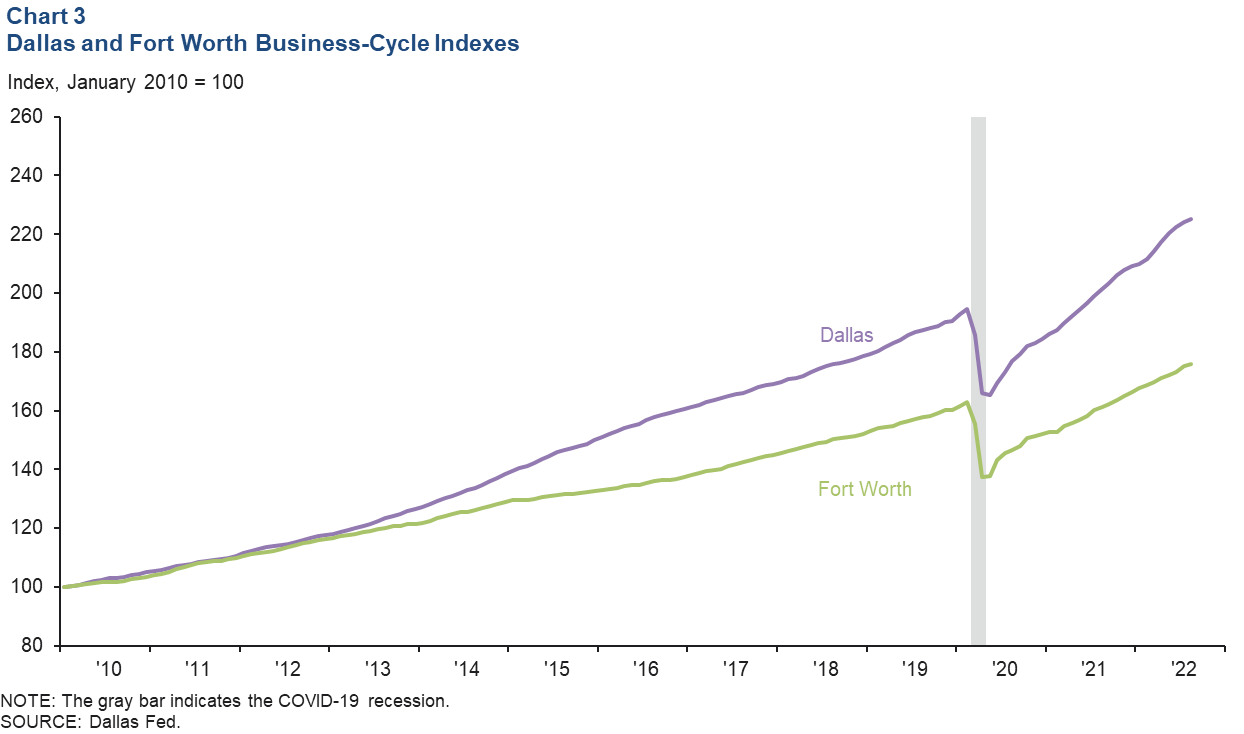
The Dallas and Fort Worth business-cycle indexes continued to expand in August, albeit at a slower pace than in previous months. Growth in the Dallas index was an annualized 5.1 percent—below its long-run average rate of increase (Chart 3). The Fort Worth index rose an annualized 5.2 percent, its slowest pace of increase since February 2021.
Construction and real estate
Apartment demand moderates
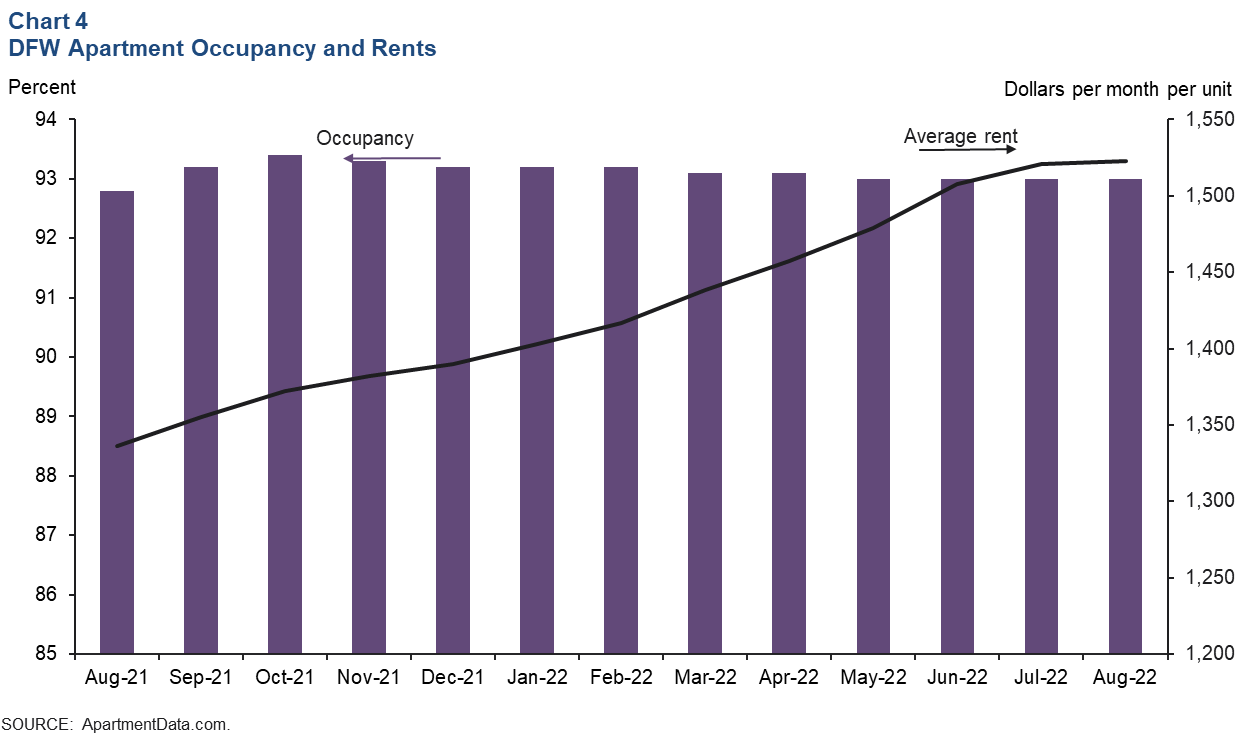
DFW apartment absorption was nearly flat in August. Net absorption was -237 units following increases of 1,155 units in May, 1,194 in June and 760 in July. Average monthly rents in DFW increased to $1,523 per unit in August, up 14.0 percent year over year (Chart 4). Occupancy held steady at 93 percent—little changed from August 2021. While rents continue to inch upward, the pace of increase has moderated in recent months across most categories.
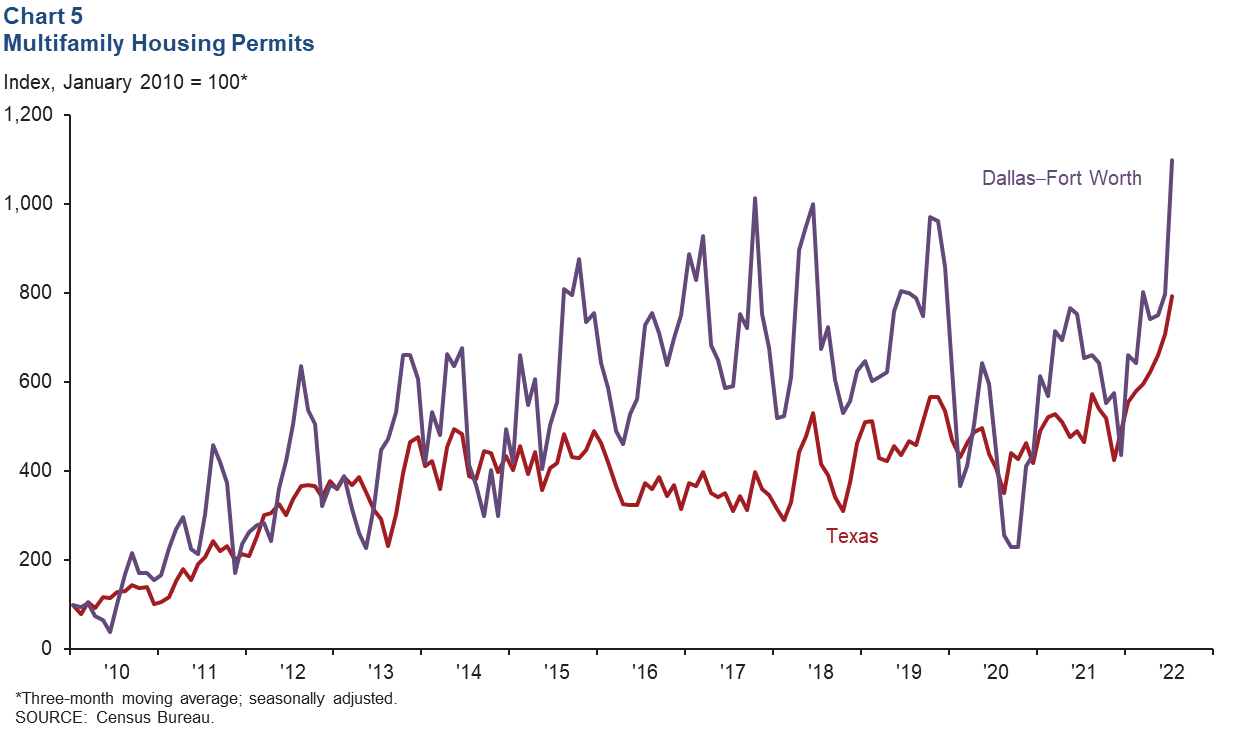
Multifamily construction surges
Multifamily permit issuance, which leads apartment construction, surged in August (Chart 5). In the first seven months of the year, DFW multifamily permits were 31 percent higher than in the same period in 2021. Statewide, multifamily permits were up 38 percent over this period, supported by strong demand and rent growth over the past year. DFW remains among the busiest large U.S. metros in apartment building.
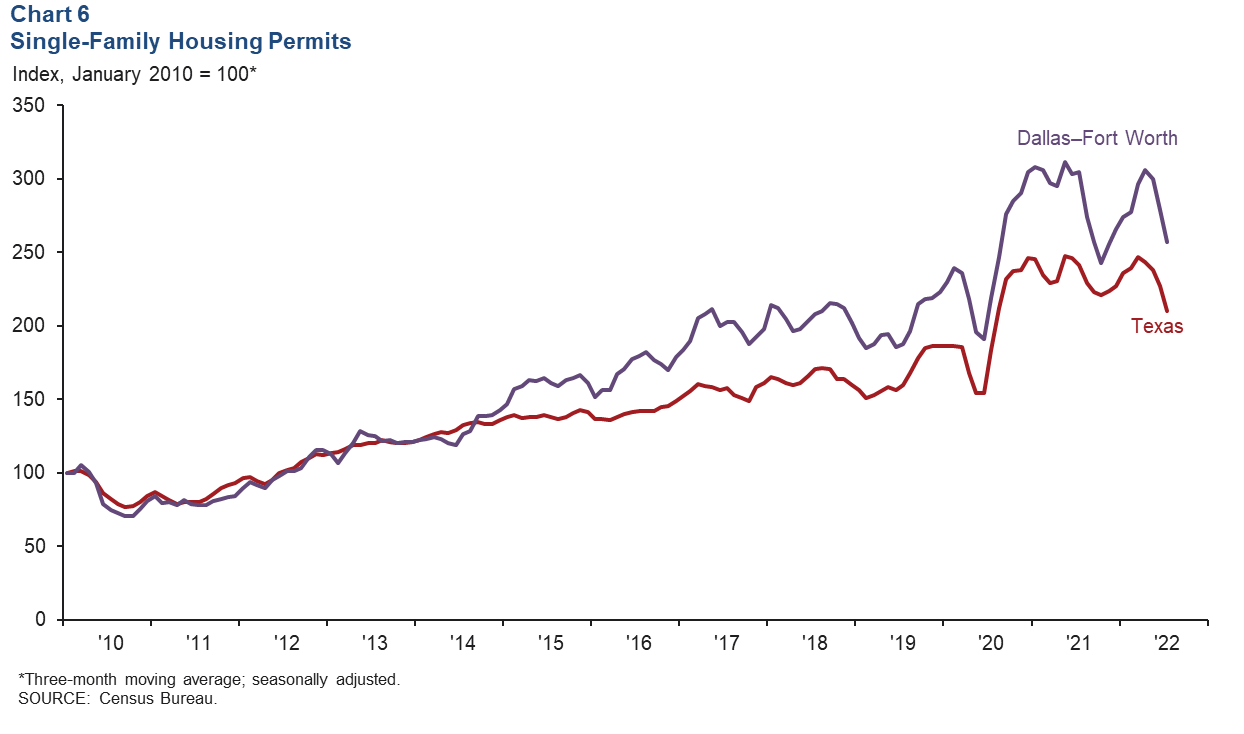
Single-family permit issuance slides
Single-family permit issuance, which leads home construction, fell in DFW for the fourth straight month in July following hefty increases earlier in the year (Chart 6). Homebuilders noted that declining sales and high cancellation rates are partly responsible for moderating activity in recent months. Still, homebuilding remains highly elevated compared with prepandemic levels; through July, single-family permits in DFW and Texas were nearly 50 percent higher compared with the same period in 2019. So far this year, 28,000 single-family permits have been issued in the metroplex.
NOTE: Data may not match previously published numbers due to revisions.
About Dallas–Fort Worth Economic Indicators
Questions can be addressed to Laila Assanie at laila.assanie@dal.frb.org. Dallas–Fort Worth Economic Indicators is published every month after state and metro employment data are released.