Dallas-Fort Worth Economic Indicators

January 11, 2023
| DFW economy dashboard (November 2022) | |||
| Job growth (annualized) Aug.–Nov. '22 |
Unemployment rate |
Avg. hourly earnings |
Avg. hourly earnings growth y/y |
| 5.3% | 3.4% | $33.50 | 1.9% |
Dallas–Fort Worth’s economy expanded in November. Payroll employment grew broadly. Unemployment dipped, and the Dallas and Fort Worth business-cycle indexes expanded. Apartment demand fell again, and home prices and single-family construction weakened due to a sharp pullback in housing demand.
Labor market
Payroll gains strong
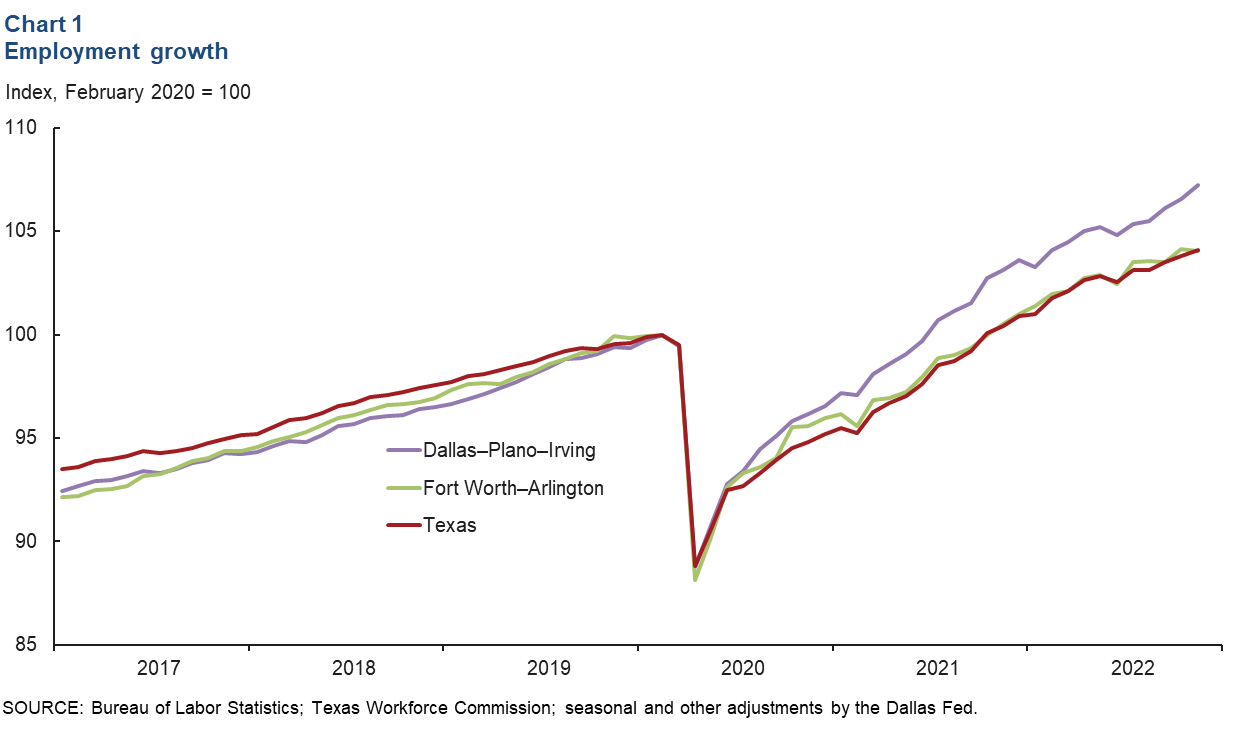
DFW employment grew an annualized 5.3 percent in the three months ending in November (Chart 1). Payrolls rose 6.7 percent in Dallas, 1.8 percent in Fort Worth and 3.9 percent statewide. DFW payroll gains were widespread over the three-month period, with growth led by construction and mining, followed closely by the leisure and hospitality and professional and business services sectors. Employment in information services and government declined. DFW average hourly earnings dipped to $33.50 in November but were up 1.9 percent over the 12-month period.
Unemployment edges down
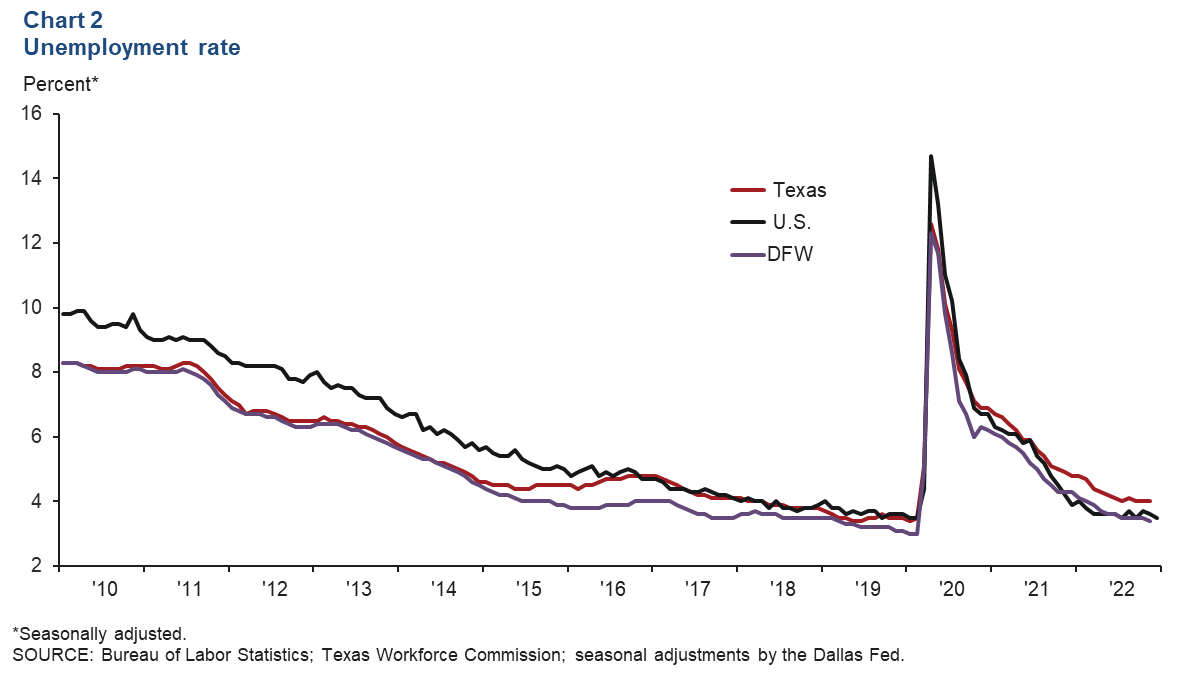
The DFW unemployment rate dipped to 3.4 percent in November, remaining below the Texas and U.S. jobless rates of 4.0 percent and 3.6 percent, respectively (Chart 2). The metro-area labor force rose an annualized 3.4 percent in November—its 11th consecutive increase.
Business-cycle indexes
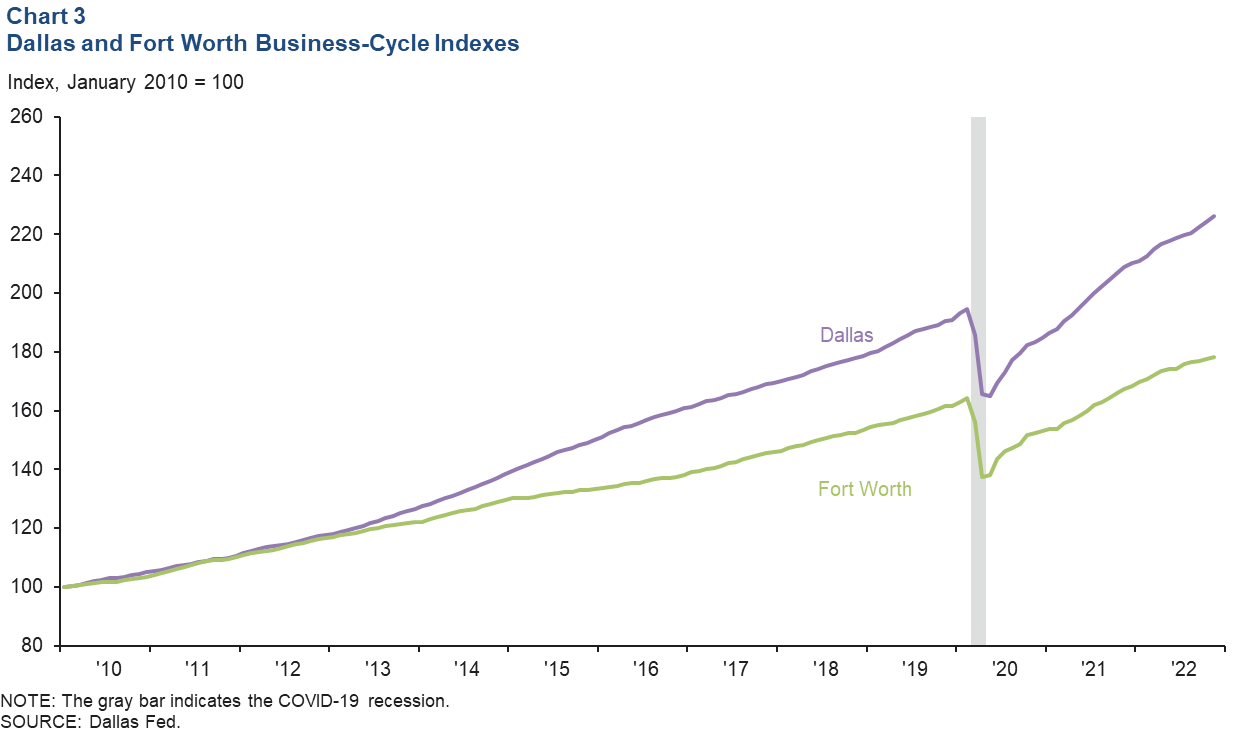
The Dallas and Fort Worth business-cycle indexes continued to expand strongly in November, buoyed by sustained job growth and low unemployment. The Dallas index climbed an annualized 10.4 percent—marking the 30th straight month of growth—and was up 16.2 percent from its prepandemic peak (Chart 3). The Fort Worth index rose an annualized 4.8 percent, 8.7 percent above its prepandemic high.
Housing
Apartment demand slows further
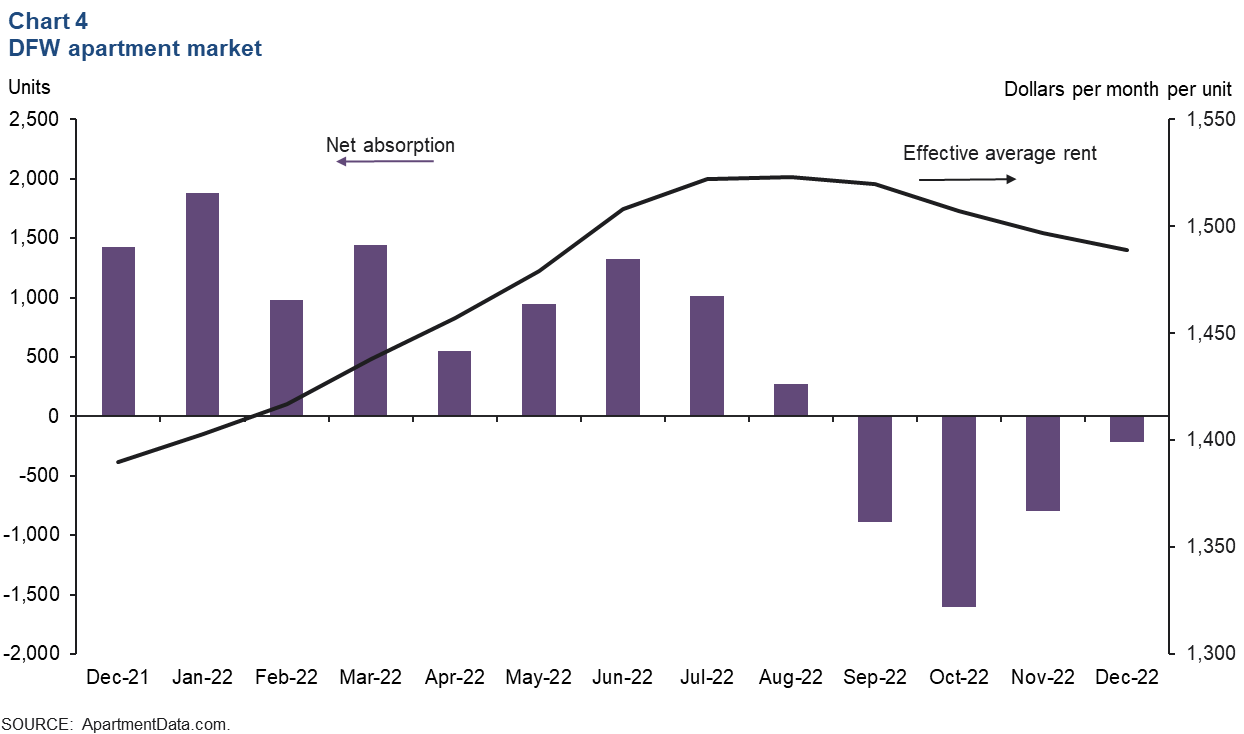
DFW apartment absorption was negative at year-end 2022. Net absorption was -213 units in December following a decline of 793 units in November (Chart 4). As demand moderated, effective monthly rents in DFW dipped further to $1,489 per unit in December. Rents were still up 7.1 percent year over year. Occupancy edged down to 92.3 percent in December from 92.5 percent in October.
Home price appreciation eases
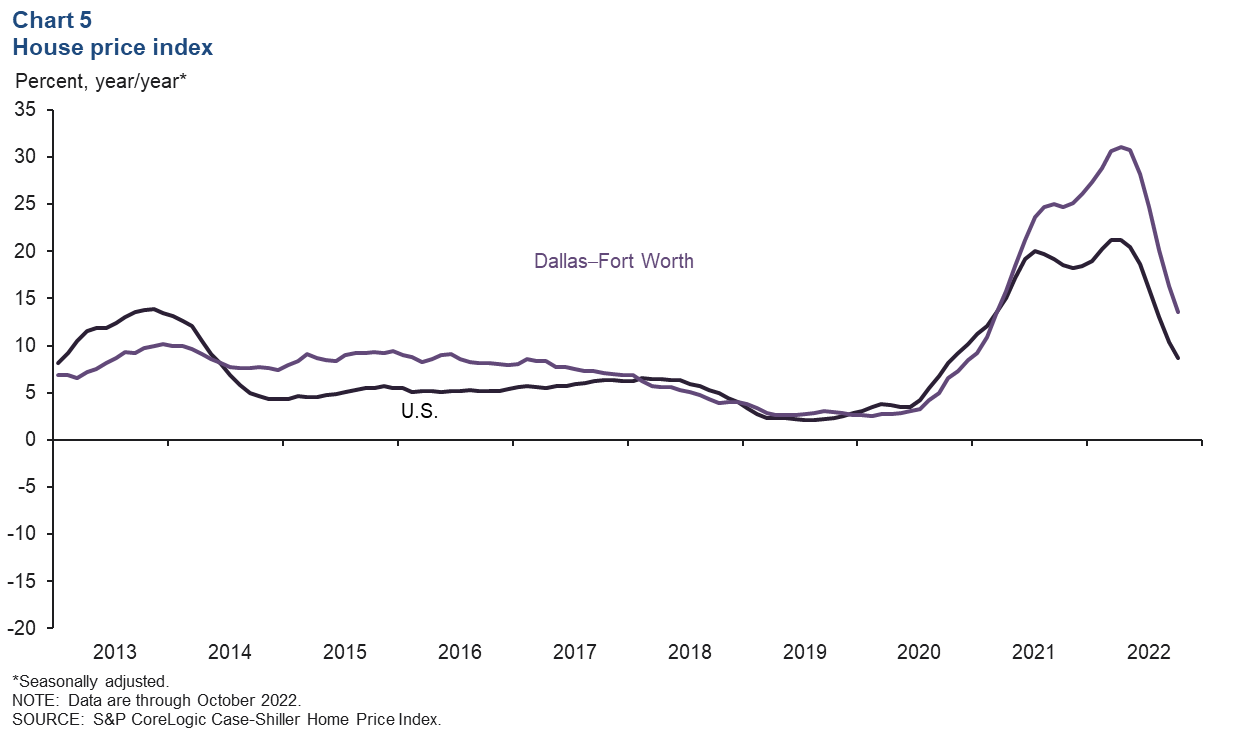
Home sales have steadily declined the past several months as buyers pumped the brakes on making large purchases. Falling sales have pressured home prices, which declined for the fourth straight month in October (the most recent data available). According to the S&P CoreLogic Case-Shiller index, home prices in Dallas fell 0.9 percent in October, while the U.S. 20-city price index was down 0.5 percent. Year-over-year home price appreciation slowed to 13.5 percent in Dallas and 8.7 percent nationally (Chart 5). According to business contacts, the housing market remains weak, dampened by multi-decade-high mortgage rates and elevated home prices.
Homebuilding slips further
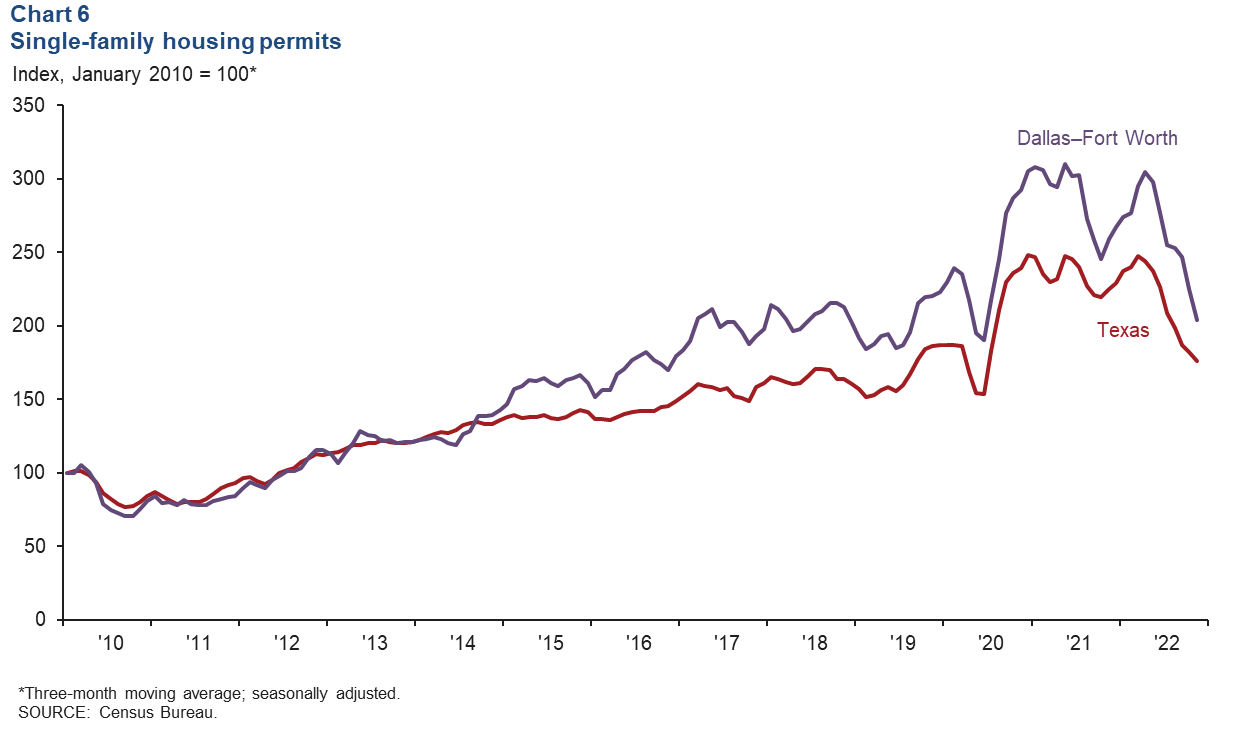
The three-month moving average of single-family permits fell further in DFW and Texas in November after posting hefty increases from summer 2020 through early 2022 (Chart 6). Homebuilders noted that declining sales and high cancellation rates are partly responsible for moderating activity since spring 2022. Still, homebuilding remains above prepandemic levels; through November 2022, single-family permits in both DFW and Texas were 25 percent more than in the same period in 2019 but down 9.0 percent from 2021.
NOTE: Data may not match previously published numbers due to revisions.
About Dallas–Fort Worth Economic Indicators
Questions or suggestions can be addressed to Laila Assanie at laila.assanie@dal.frb.org. Dallas–Fort Worth Economic Indicators is published every month after state and metro employment data are released.