Dallas-Fort Worth Economic Indicators

February 3, 2023
| DFW economy dashboard (December 2022) | |||
| Job growth (annualized) Sept.–Dec. '22 |
Unemployment rate |
Avg. hourly earnings |
Avg. hourly earnings growth y/y |
| 3.6% | 3.4% | $33.50 | 1.8% |
Dallas–Fort Worth’s economy expanded in December as payroll employment grew and unemployment held steady. Home sales continued to slide, and inventories rose. Activity in the office market was tepid, while demand for industrial space remained heightened. Corporate relocations to DFW in 2022 dropped from the highs seen in 2021.
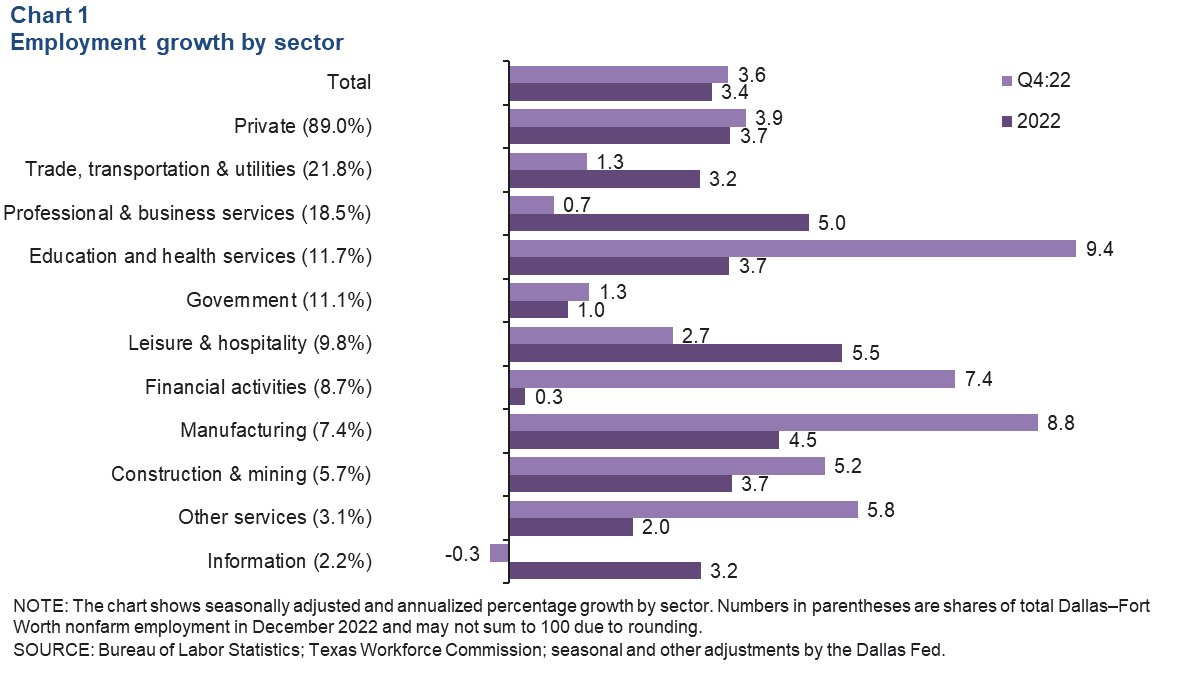
Labor market
DFW employment grew an annualized 3.6 percent in the fourth quarter (Chart 1). Payrolls rose 3.7 percent in Dallas, 3.4 percent in Fort Worth and 3.4 percent statewide. DFW gains were widespread over the three-month period, led by education and health services, and followed closely by the manufacturing and financial activities sectors. Employment in information services declined. DFW employment rose broadly in 2022, up 3.4 percent, or by 133,350 jobs. DFW private average hourly earnings dipped to $33.56 in December but were up 1.8 percent over the 12-month period. Unemployment in DFW held steady at 3.4 percent in December.
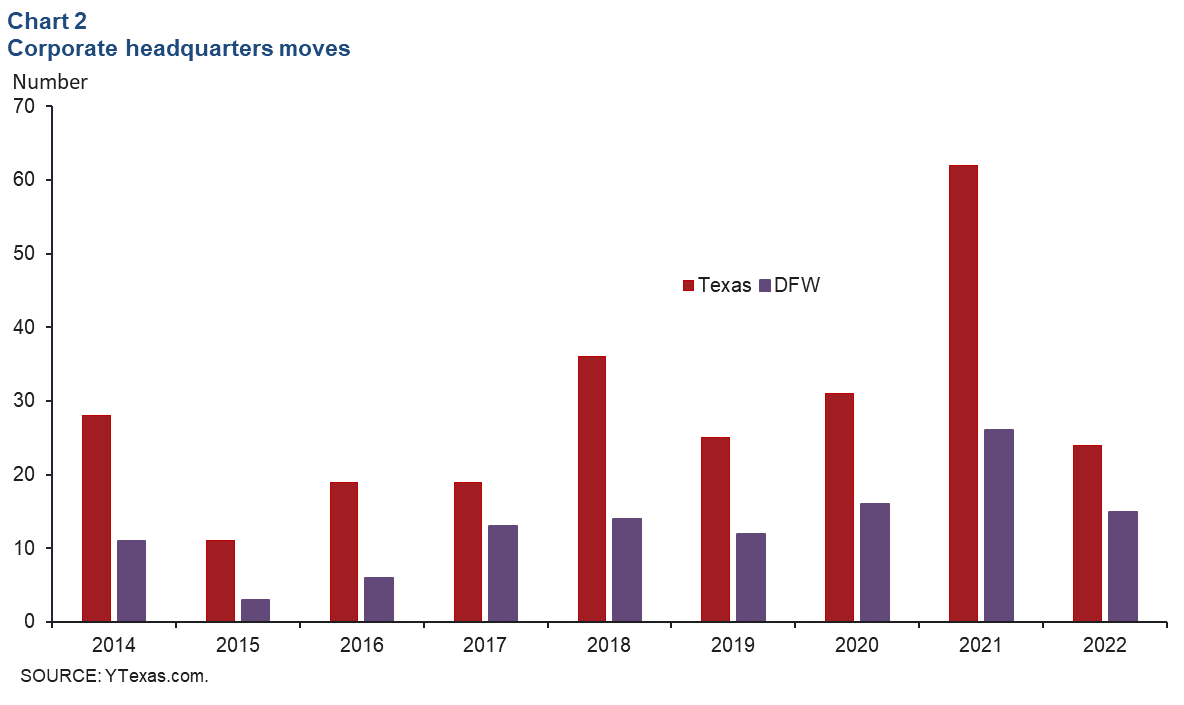
Corporate relocations
Corporate headquarters relocations to Dallas–Fort Worth and statewide dropped sharply last year from record levels in 2021 (Chart 2). According to the Relo Tracker from YTexas, at least 24 businesses moved their headquarters to the state in 2022 and, among them, more than half made DFW their home. The 24 headquarters moves were down from a record 62 in 2021. Last year, 15 companies moved to DFW, compared with 26 in 2021.
Housing
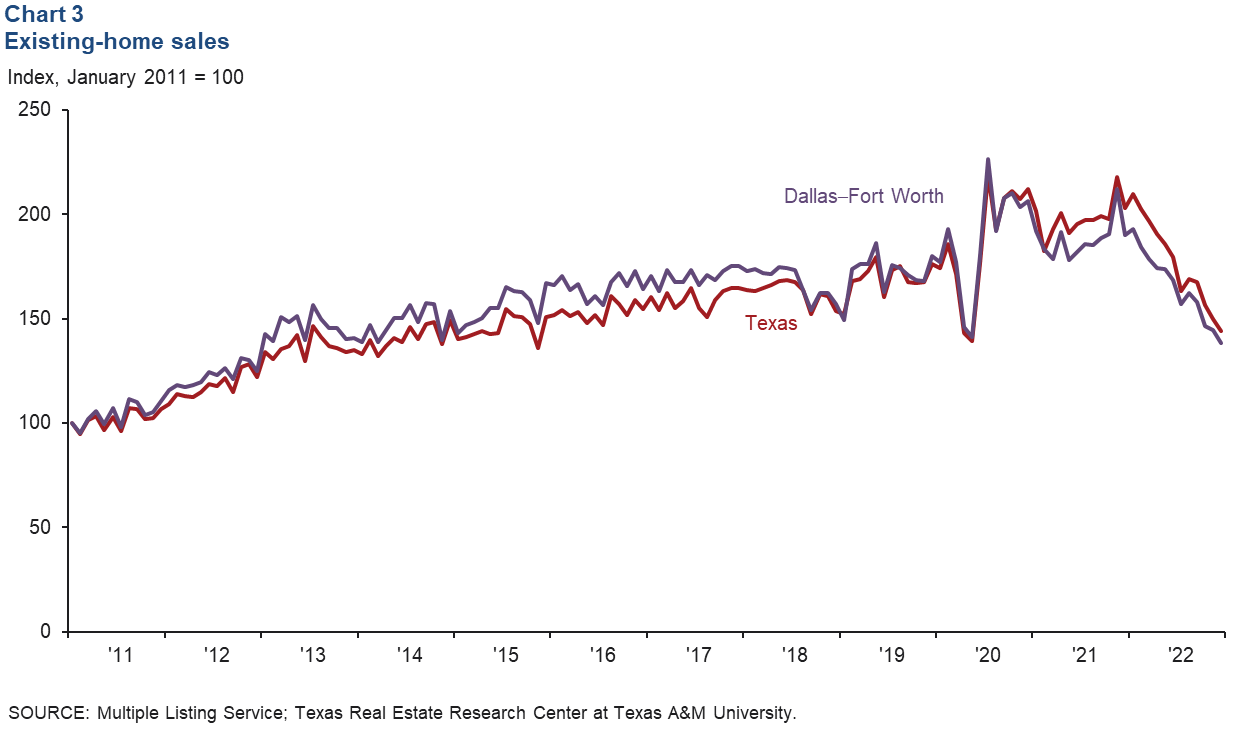
Existing-home sales drop further
Home sales continued to slide at year-end 2022. DFW existing-home sales contracted 4.2 percent in December (Chart 3). Statewide, sales fell at a similar pace (3.9 percent). Home sales last year were 12.4 percent below 2021 totals in DFW and 11.0 percent below in Texas. According to business contacts, sales remain weak in 2023, though they have improved incrementally, dampened by close to multidecade-high mortgage rates and elevated home prices. Contract cancellations have slowed recently but remain high, and incentives have been widespread, including rate buy-downs and price reductions.
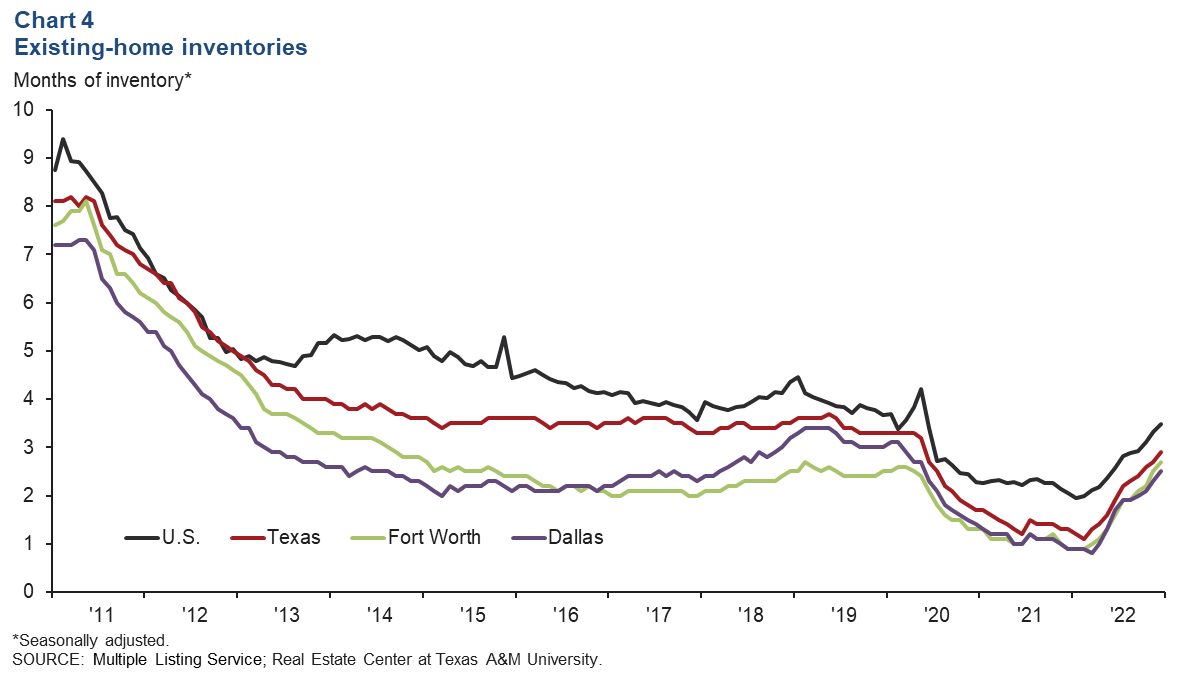
Home inventories steadily increase
With sales slowing, home inventories continued to climb in December. Existing-home inventories rose to 2.5 months in Dallas, 2.7 in Fort Worth, 2.9 in Texas and 3.5 in the U.S. (Chart 4). Despite the increase, inventories in the metroplex, state and nation remained below the six-month benchmark for a normal market.
Commercial real estate
Office vacancy little changed
Demand for office space in DFW remained subdued in 2022 (Chart 5). Net absorption was 703,276 square feet in the fourth quarter, according to data from CBRE Research. In 2022, 1.8 million square feet of office space was absorbed on net, below the 2010–19 average. The vacancy rate was little changed in the quarter at 24.5 percent, equivalent to 57 million square feet of vacant space. Sublease space availability held steady at 9.5 million square feet, concentrated in Class A properties. The volume of space under construction fell to 4.9 million square feet in the fourth quarter.
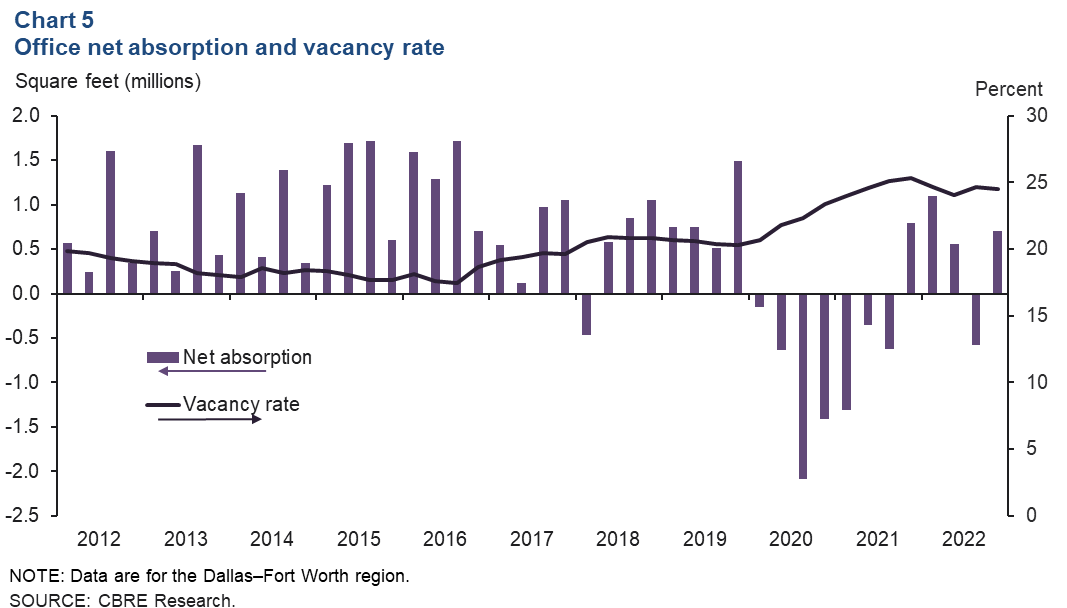
Business contacts noted that leasing activity, a leading indicator of net absorption, slowed in the latter part of the year. The pullback suggests continued sluggish absorption in the early part of 2023.
Industrial leasing stays robust
Industrial leasing’s strong momentum continued in the fourth quarter, driven by demand from logistics firms. Net absorption was a robust 9.6 million square feet—marking the 49th straight quarter of positive absorption, according to CBRE (Chart 6). The vacancy rate dipped to 4.6 percent. The pandemic boosted online sales growth, which has been a boon to distribution hubs such as DFW.
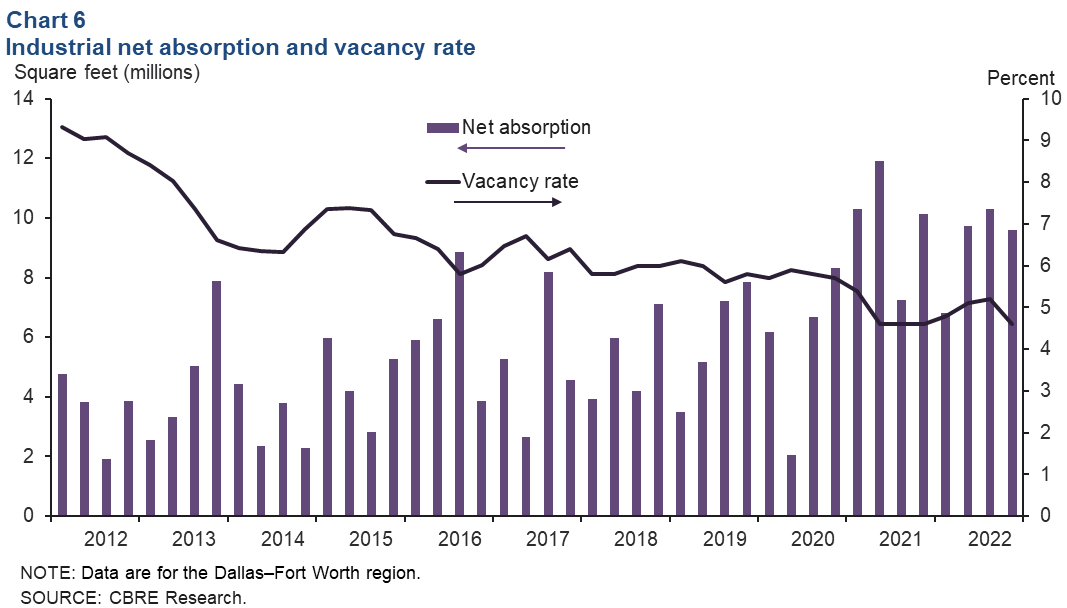
Last year, 36.4 million square feet of industrial space was absorbed, just shy of the 39.6 million record set in 2021. DFW continues to lead the country in industrial development, reaching a new high of 76.9 million square feet at year-end 2022. The North Fort Worth submarket has the highest share of speculative construction, followed by the South Dallas submarket.
NOTE: Data may not match previously published numbers due to revisions.
About Dallas–Fort Worth Economic Indicators
Questions or suggestions can be addressed to Laila Assanie at laila.assanie@dal.frb.org. Dallas–Fort Worth Economic Indicators is published every month after state and metro employment data are released.