Dallas-Fort Worth Economic Indicators

| DFW economy dashboard (March 2023) | |||
| Job growth (annualized) Dec. '22–Mar. '23 |
Unemployment rate |
Avg. hourly earnings |
Avg. hourly earnings growth y/y |
| 3.0% | 3.7% | $33.85 | 3.2% |
The Dallas–Fort Worth economy expanded modestly in March. Job growth slowed, and unemployment ticked up. Activity in the office market stayed weak, while demand for industrial space remained solid.
Labor market
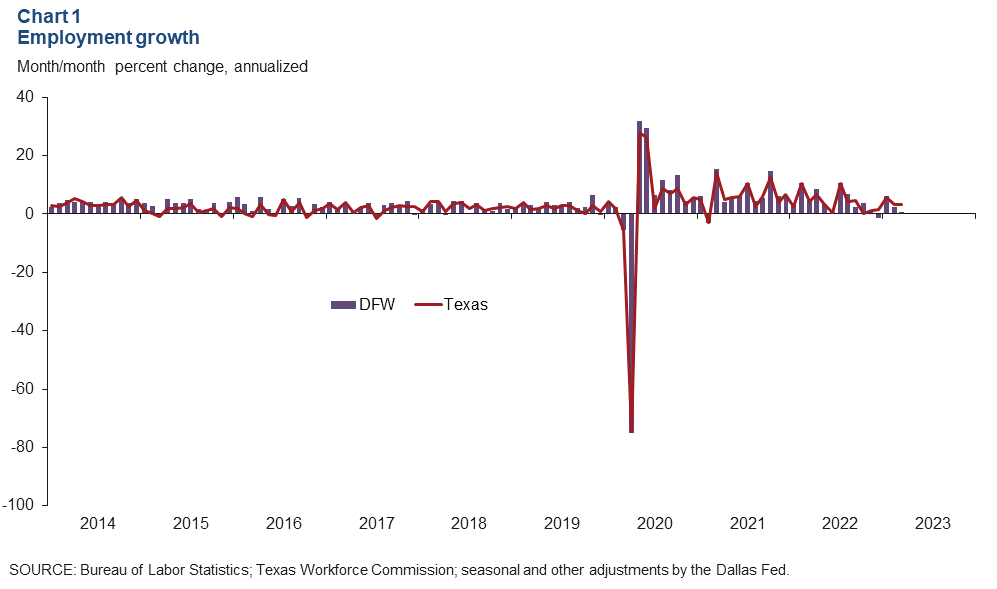
Payrolls rise slightly in March
DFW employment growth slowed to an annualized 0.7 percent in March from 2.5 percent in February (Chart 1). Payrolls in trade, transportation and utilities, construction and mining, and other services declined during the month. Manufacturing payrolls were flat, and employment rose in the other major sectors. DFW private average hourly earnings edged up to $33.85 in March and were up 3.2 percent over the 12-month period.
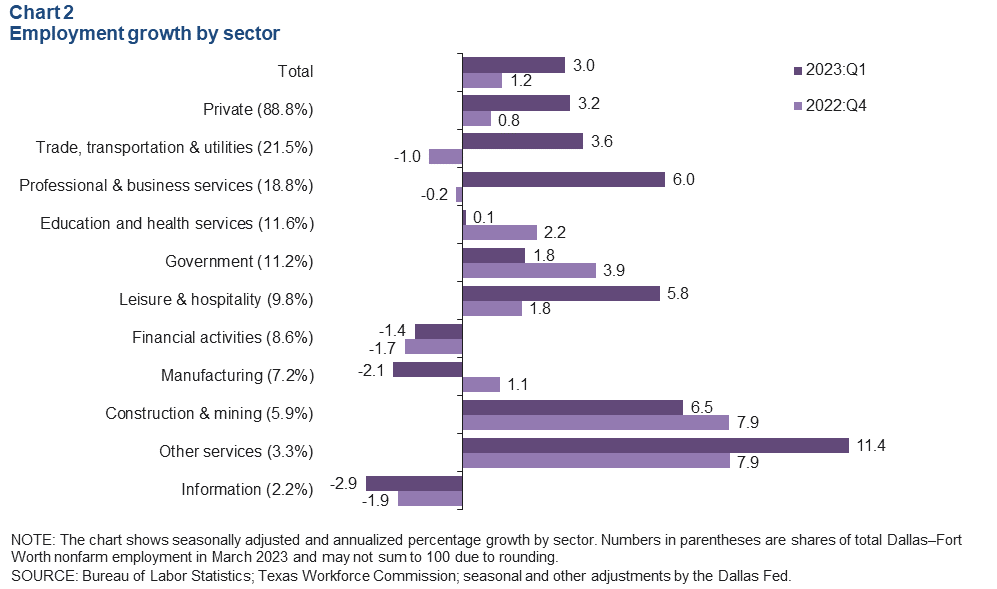
Job growth strong in first quarter
DFW employment grew an annualized 3.0 percent in the first quarter, an acceleration from the fourth quarter’s 1.2 percent increase (Chart 2). Payrolls rose 2.8 percent in Dallas and 3.7 percent in Fort Worth, slightly slower than the state’s 3.9 percent increase. DFW gains were mixed over the three-month period, with declines in the manufacturing, information services and financial activities sectors. Employment in education and health services held steady, while the professional and business services, leisure and hospitality, construction and mining, and other services sectors posted strong gains.
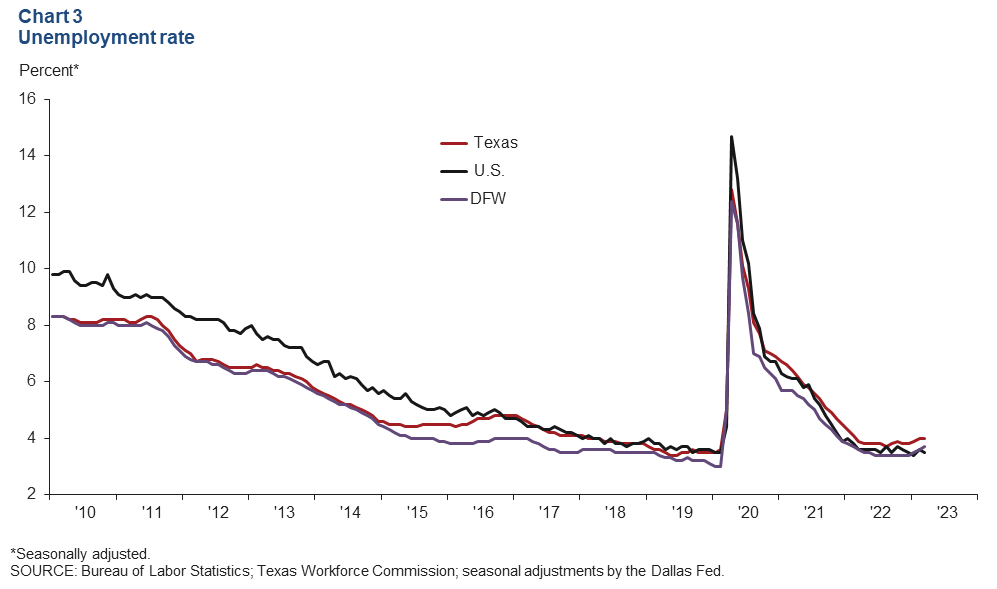
Unemployment ticks up
The DFW labor market continued to be tight, though unemployment edged up in March. The unemployment rate ticked up to 3.7 percent in DFW (Chart 3). The jobless rate in Texas held steady at 4.0 percent in March, and in the U.S., it dipped to 3.5 percent. The labor force expanded an annualized 7.0 percent in DFW—faster than the state’s 5.1 percent rise.
Commercial real estate
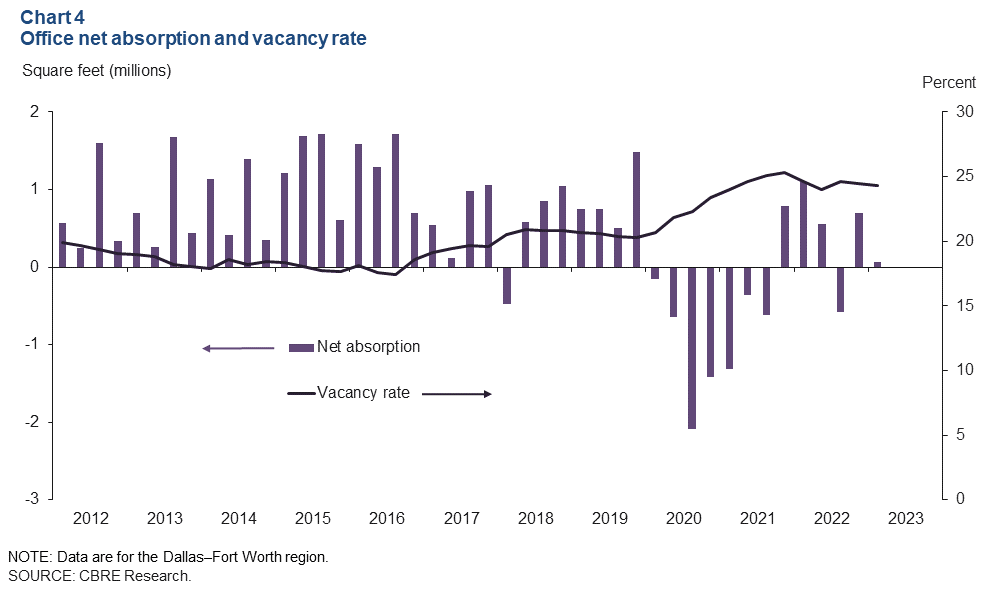
Office vacancy little changed
Demand for office space in DFW remained subdued in the first quarter (Chart 4). Net absorption was a mere 68,892 square feet, according to data from CBRE Research. The vacancy rate was little changed in the quarter at 24.3 percent, equivalent to 56 million square feet of vacant space concentrated in Class A properties in the far North Dallas, Dallas Central Business District and Las Colinas submarkets. Sublease space availability ticked up to 9.8 million square feet, representing 15.0 percent of total availability. The volume of space under construction rose slightly to 5.0 million square feet in the first quarter. Business contacts noted that leasing activity, a leading indicator of net absorption, remains sluggish, suggesting continued weakness in the remainder of 2023.
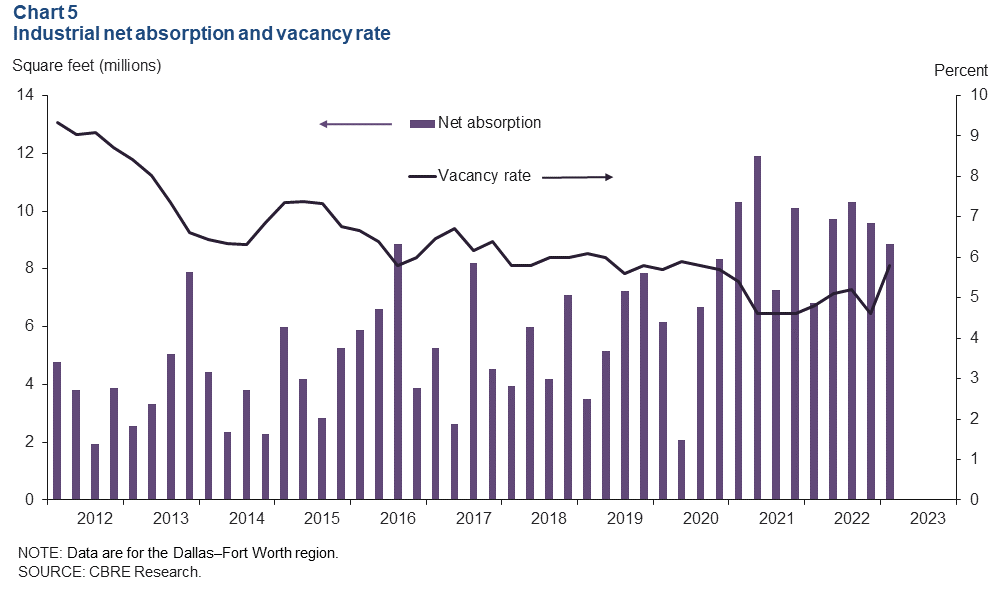
Industrial leasing stays robust, but vacancy rises
The strong momentum in industrial leasing continued in the first quarter, driven by demand from third-party logistics firms. Net absorption was a robust 8.9 million square feet—marking the 50th straight quarter of positive absorption, according to CBRE (Chart 5). The vacancy rate climbed 116 basis points to 5.8 percent due to the elevated level of deliveries, which totaled 19.6 million square feet. DFW continues to lead the country in industrial development at 62.9 million square feet under construction. Though still elevated, the figure is down from year-end 2022. The North Fort Worth submarket has the highest level of speculative construction, followed by the East Dallas submarket. Together, these two submarkets make up just under half of the speculative space being constructed.
NOTE: Data may not match previously published numbers due to revisions.
About Dallas–Fort Worth Economic Indicators
Questions or suggestions can be addressed to Laila Assanie at laila.assanie@dal.frb.org. Dallas–Fort Worth Economic Indicators is published every month after state and metro employment data are released.