Dallas−Fort Worth Economic Indicators
| DFW economy dashboard (April 2026) | |||
Job growth (annualized)
Jan.–Apr. '26 |
Unemployment rate |
Avg. hourly earnings |
Avg. hourly earnings growth y/y |
1.4% |
4.2% | $37.45 | 2.9% |
Expansion in the Dallas–Fort Worth economy continued. Payroll employment was little changed in April, after strong growth in March. The unemployment rate rose. Average hourly earnings in DFW rose and remained higher than the state as well as year-ago levels. Retail sales tax collections dipped, and existing home sales continued a three-month climb in April. The Dallas Consumer Price Index increased in March.
Labor market
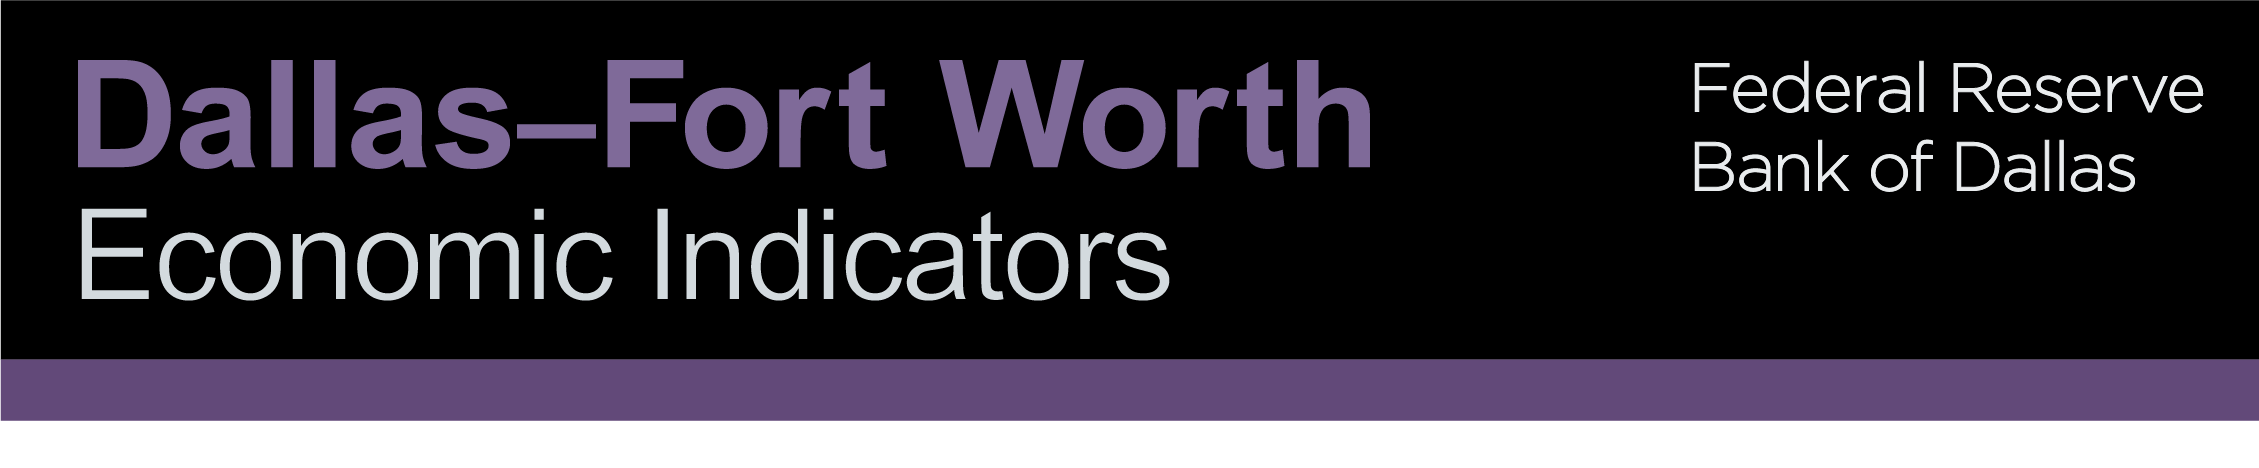
Employment largely flat in April
Employment in Dallas−Fort Worth was little changed at an annualized -0.1 percent in April after rising 4.8 percent in March (Chart 1). Employment in Texas rose 1.6 percent in April. Dallas−Fort Worth job growth in the three months ending in April was 1.4 percent. Job gains over the three-month period were seen in professional and business services, trade, transportation and utilities, education and health services, information, government and financial activities. Meanwhile, employment declined in the leisure and hospitality, manufacturing, and construction and natural resources sectors.
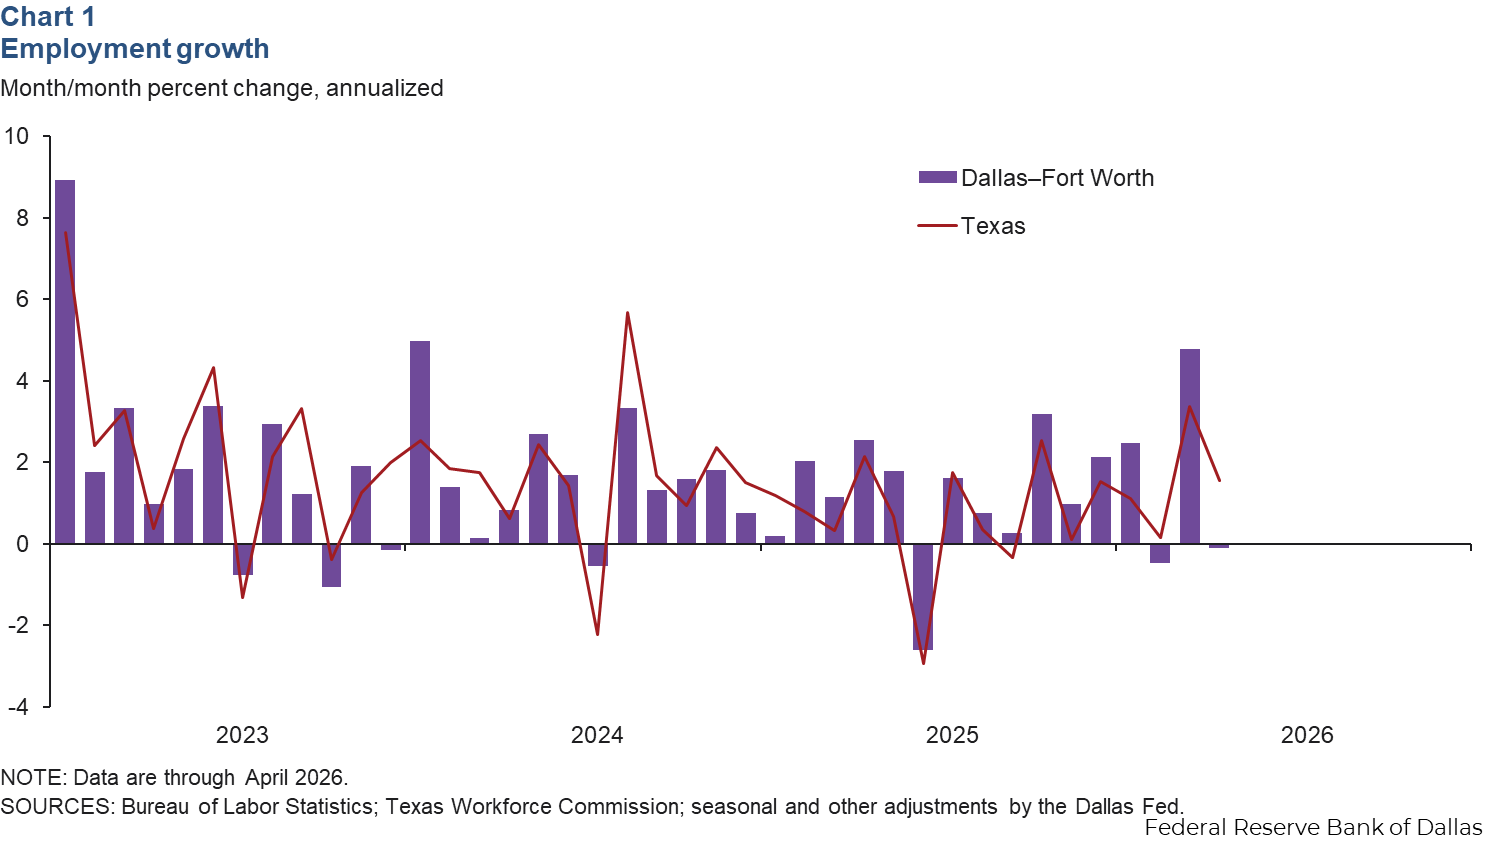
Unemployment rate increases
The Dallas−Fort Worth unemployment rate rose to 4.2 percent in April (Chart 2). The April jobless rate was 4.2 percent in Dallas and 4.0 percent in Fort Worth, lower than Texas’ jobless rate of 4.3 percent. The U.S. unemployment rate was unchanged at 4.3 percent in April.
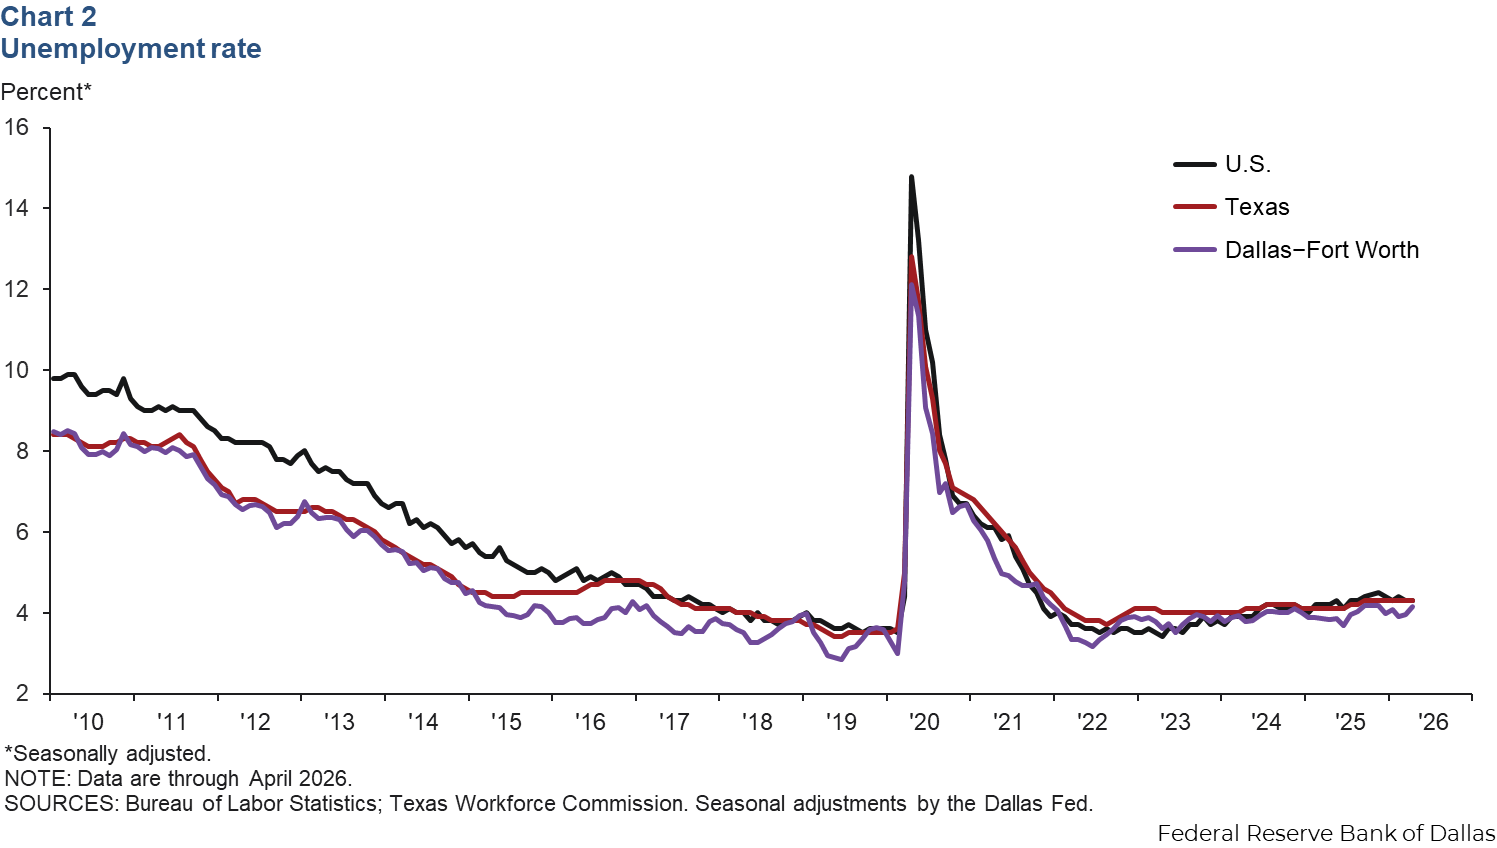
Earnings increase in April
The average nominal hourly wage in Dallas−Fort Worth edged up to $37.45 in April from $37.21 in March. Hourly wages in the region were above the state ($34.88) and national ($37.41) figures (Chart 3). Year over year, hourly earnings were up 2.9 percent in the metro area, greater than the state’s 1.9 percent increase but less than the nation’s 3.6 percent increase.
Consumer spending
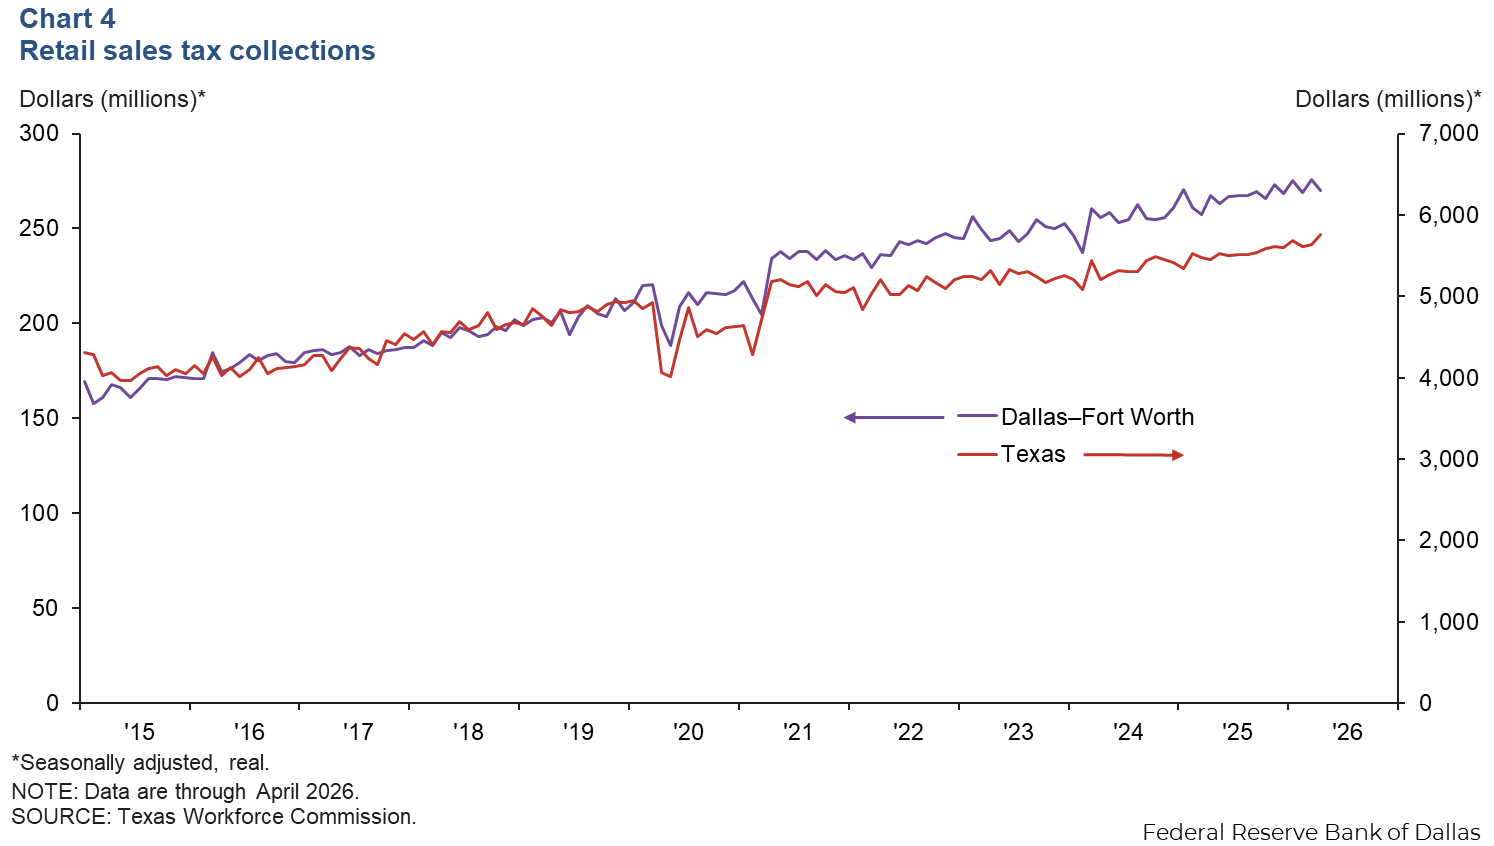
Sales and use tax receipts, a proxy for consumption, dipped in Dallas–Fort Worth in April. The region’s sales tax collections fell 2.0 percent month over month to $270 million (Chart 4). Sales tax collections were down 2.1 percent in Dallas and 0.4 percent in Fort Worth. Meanwhile, state sales tax collections rose 2.1 percent in April. Year-over-year sales tax collections were up 1.0 percent in Dallas–Fort Worth and 5.6 percent in Texas.
Inflation
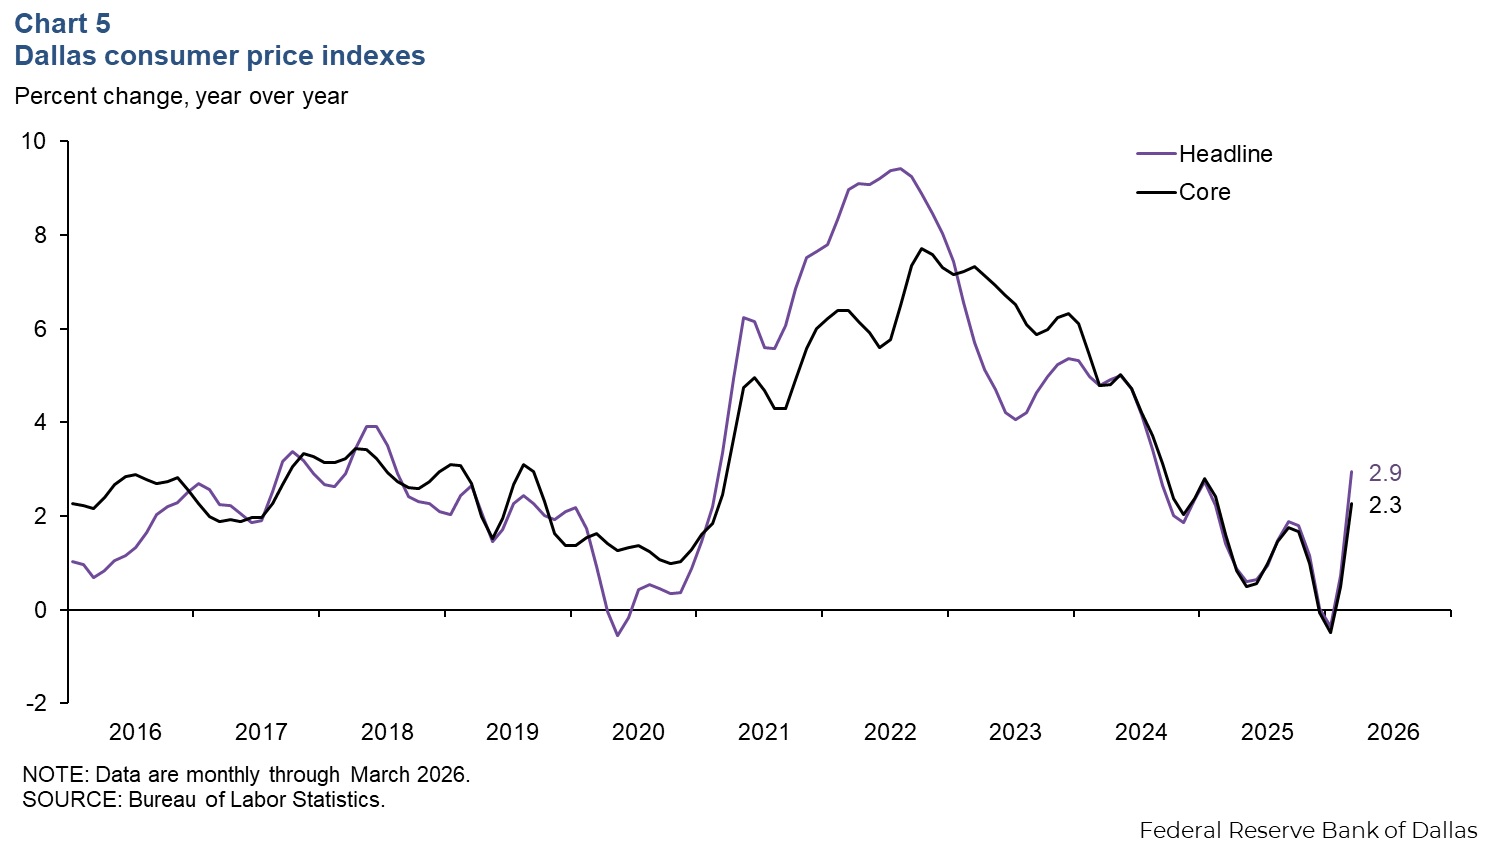
The 12-month growth in the headline consumer price index (CPI) for Dallas was 2.9 percent in March (Chart 5). Core CPI for Dallas rose 2.3 percent. The 12-month change in food prices slowed to 2.8 percent in March from 3.0 percent in February. Shelter prices were down 0.6 percent, while energy prices rose 11.6 percent. In comparison, U.S. CPI rose faster than Dallas CPI over the 12 months ending in April at 3.8 percent for headline and 2.7 percent for core, with food prices registering a 3.2 percent increase and energy rising 17.5 percent.
Housing
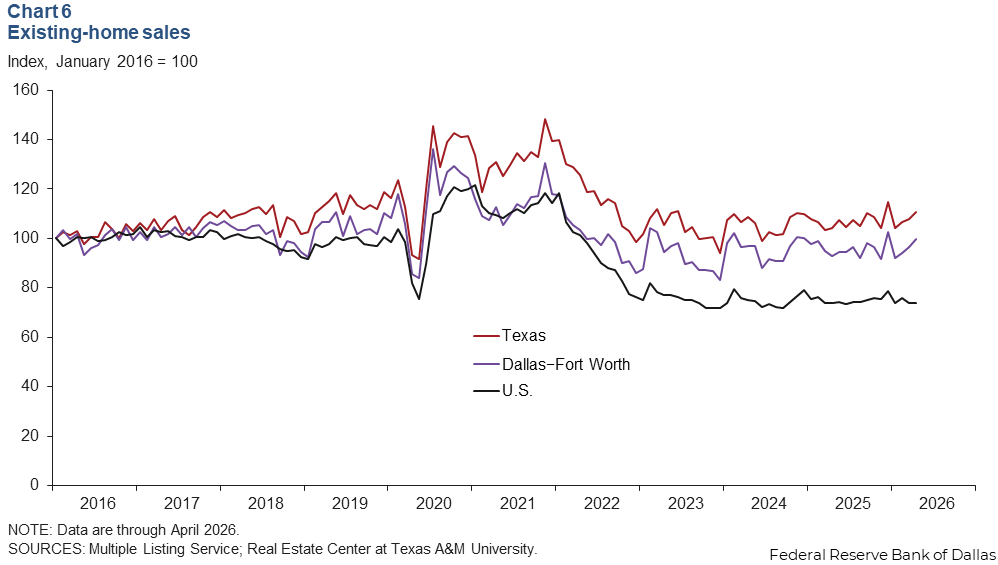
Housing demand rose. DFW existing-home sales increased 3.5 percent in April after rising 2.6 percent in March (Chart 6). Statewide, sales grew 2.7 percent in April, while they were relatively flat nationally. Year over year, existing-home sales were up 7.3 percent in DFW, 6.3 percent statewide and held steady nationally.
NOTE: Data may not match previously published numbers due to revisions.
About Dallas–Fort Worth Economic Indicators
Questions or suggestions can be addressed to Dylan Council. Dallas–Fort Worth Economic Indicators is published every month after state and metro employment data are released.