El Paso Economic Indicators

April 21, 2021
While still not fully recovered from the COVID-19 pandemic, the El Paso economy grew in March at its quickest pace since June 2020. The business-cycle index expanded, buoyed by strong employment growth. The El Paso metro area’s vaccination rate remained above that of the state’s. Trade volumes continued to reflect pandemic-related supply chain disruptions. Industrial, manufacturing, and auto production and sales activity showed signs of monthly improvement.
Business-Cycle Index
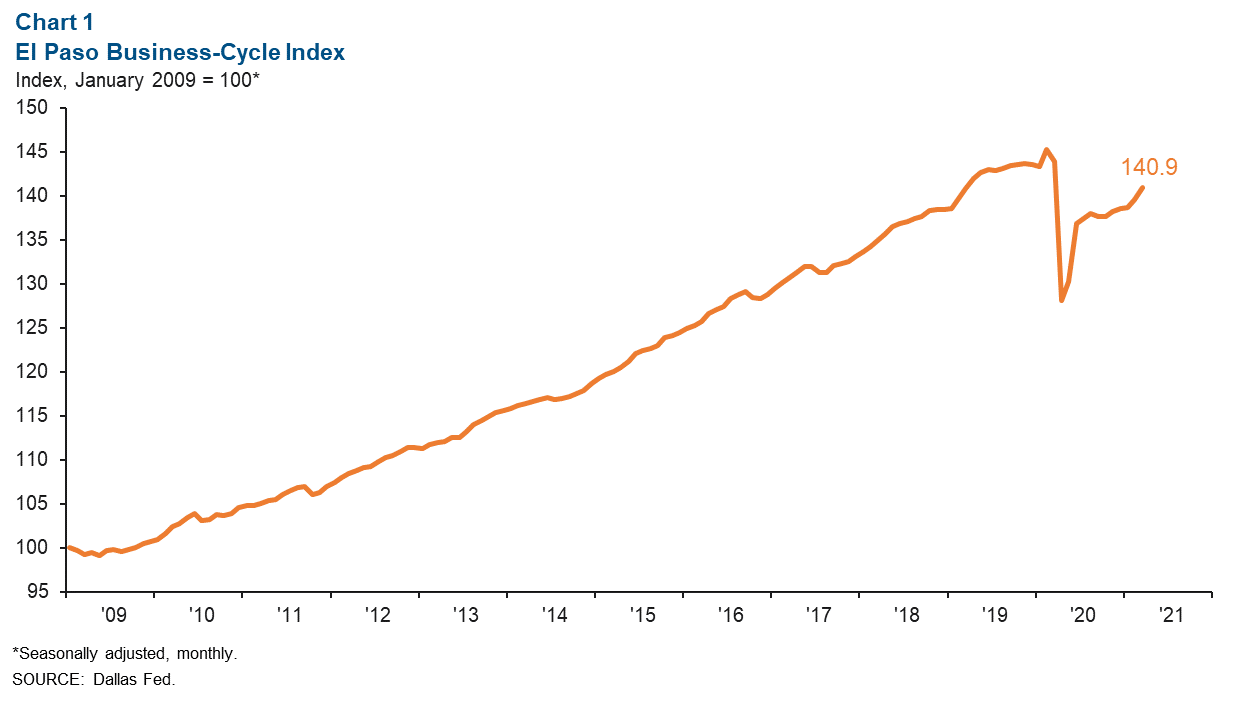
The El Paso Business-Cycle Index rose an annualized 12.7 percent in March, supported by job gains (Chart 1). Year over year, the index was down 2.1 percent.
Labor Market
In March, El Paso employment expanded an annualized 5.7 percent, or 1,460 jobs (Chart 2). Employment growth was largely driven by leisure and hospitality (982 jobs), professional and business services (365), and education and health services (228).
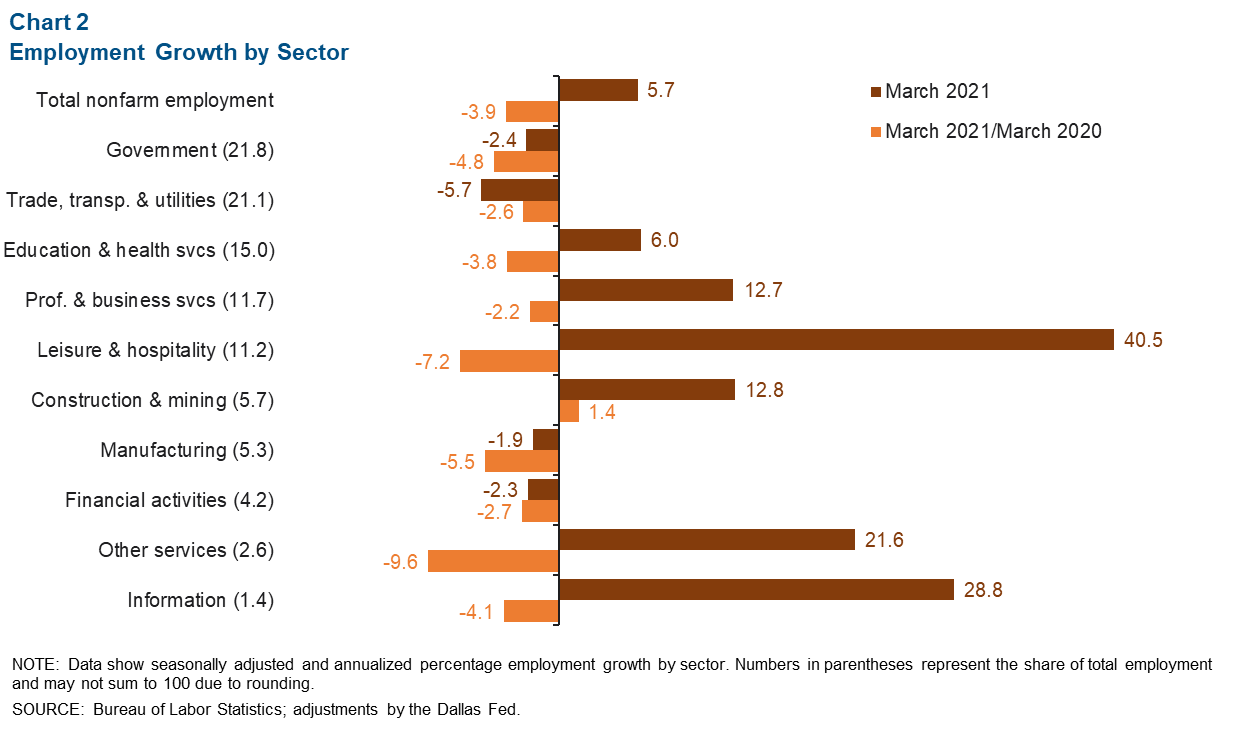
Year over year in March, payrolls in El Paso were down by 12,800 jobs. Only the construction and mining sector saw growth, adding approximately 250 jobs during the period. Job losses were widespread across sectors, including government (-3,448 jobs), leisure and hospitality (-2,744), education and health services (1,875), and trade, transportation and utilities (-1,800).
In March, the unemployment rate edged down from 7.8 to 7.7 percent but remained above that of Texas (6.9 percent) and the U.S. (6.0 percent).
Weekly Vaccination Rates
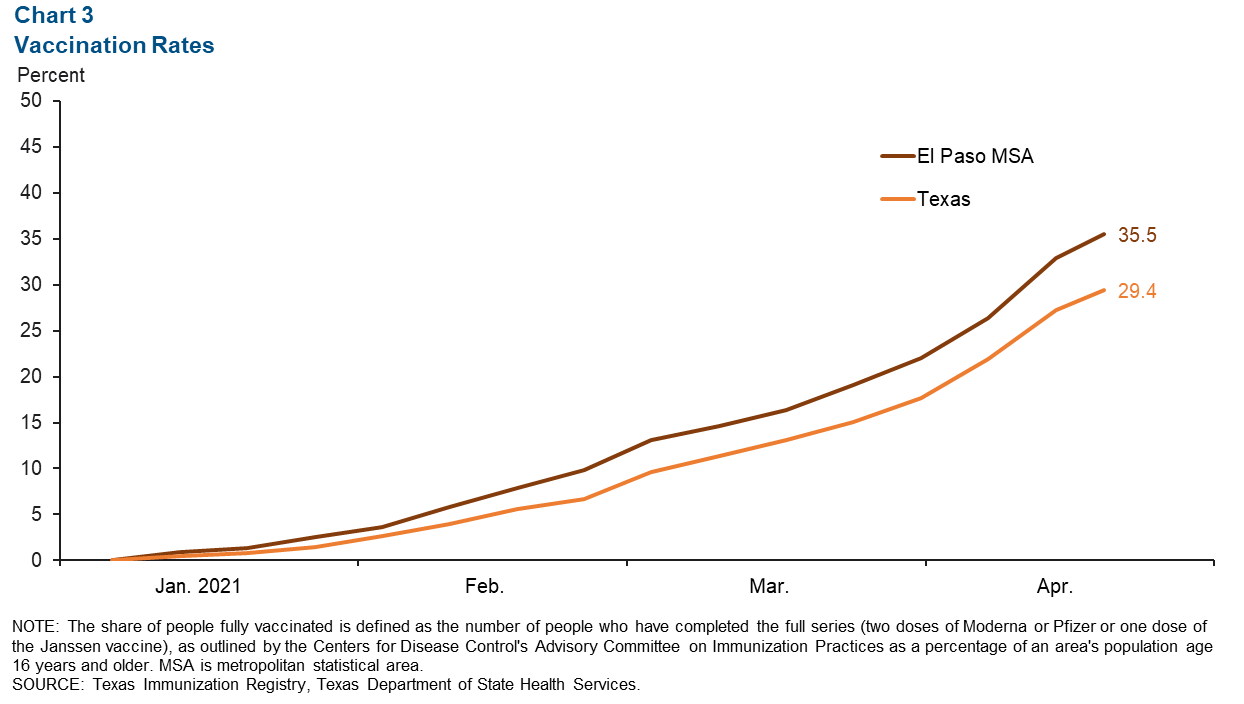
COVID-19 vaccines are critical to not only saving lives but also the pace of economic recovery. As of April 19, the rate of residents vaccinated fully in the El Paso metropolitan statistical area was almost 36.0 percent, while Texas’ vaccination rate was 29.4 percent (Chart 3).
Trade
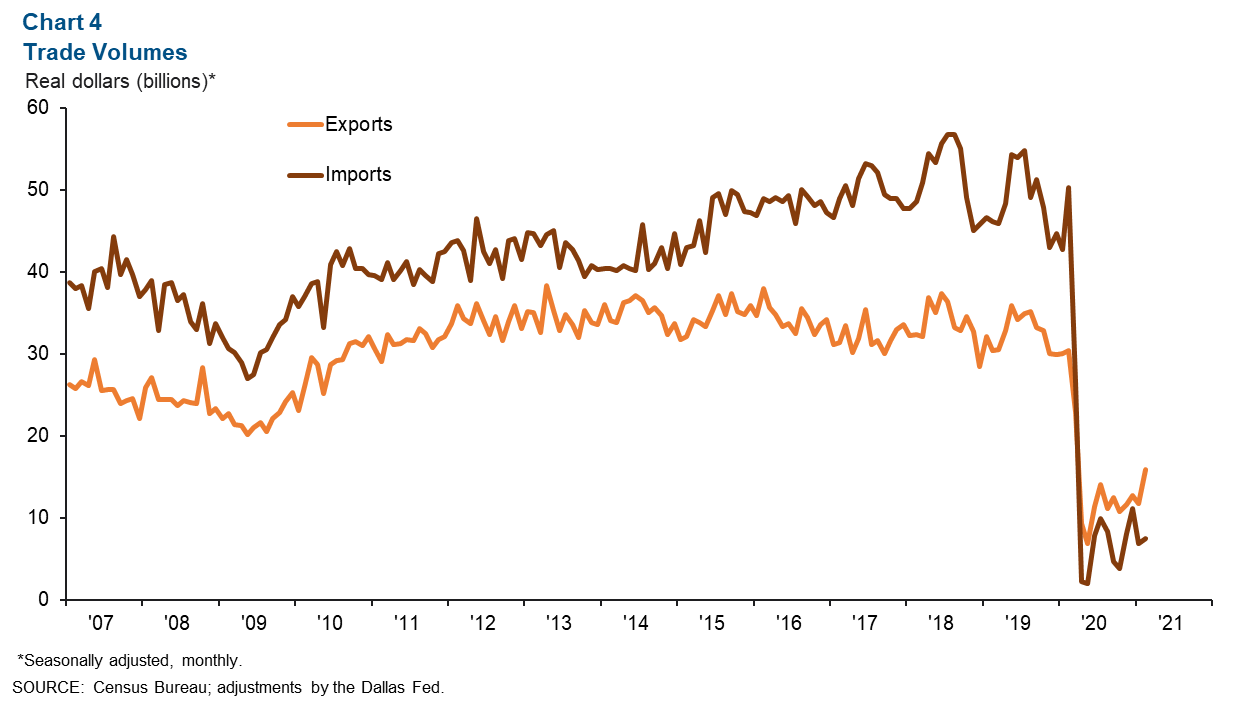
Annualized trade volumes through El Paso totaled $23.4 billion in February, down almost 71.0 percent from $80.6 billion a year earlier (Chart 4). However, monthly trade volumes rose 25.4 percent, with exports growing 35.3 percent and imports increasing 8.7 percent. Annualized exports totaled $15.9 billion in February, a year-over-year decrease of 47.6 percent, while imports totaled $7.5 billion, an 85.0 percent decline from February 2020.
Industrial Production and Maquiladora-Related Activities
The U.S. industrial production index rose from 104.1 in February to 105.6 in March and was up 1.0 percent year over year (Chart 5). Mexico’s industrial production index ticked up from 97.9 in January to 98.3 in February but was down 3.1 percent compared with a year ago. The Institute for Supply Management (ISM) manufacturing index was 64.7 in March, up from February’s figure of 60.8. March’s figure indicates continued expansion in the manufacturing sector for the 10th month in a row—above the threshold of 50. ISM survey responses highlighted manufacturers’ concerns about meeting increased demand amid supply-related issues, such as extended lead times, labor and material shortages, rising commodities prices, and transportation and logistics challenges.
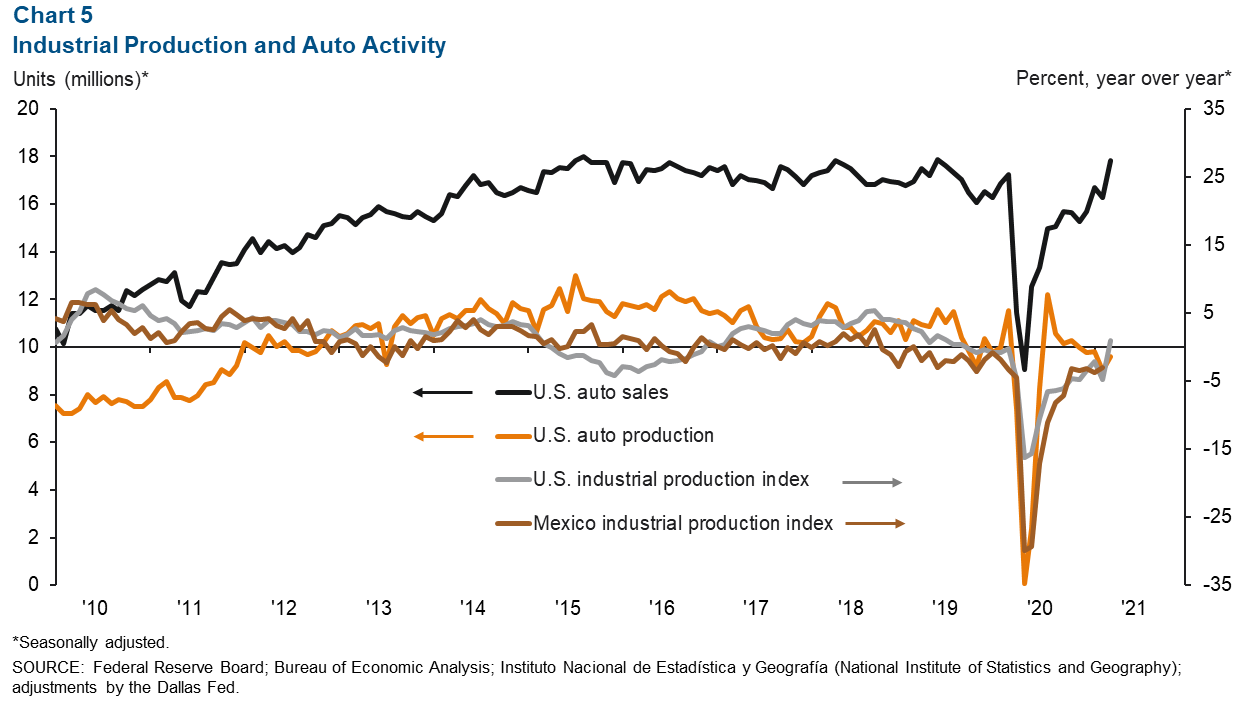
U.S. auto and light-truck production rose from 9.0 million units in February to 9.6 million units in March and was 30.2 percent higher than March 2020’s production figure of 7.4 million units. Meanwhile, monthly auto sales also increased in March, totaling 17.8 million, and were up 56.0 percent from a year prior. Auto sales are closely linked to the local economy because roughly half of maquiladoras in Juárez are auto related.
NOTE: Data may not match previously published numbers due to revisions. The El Paso metropolitan statistical area includes El Paso and Hudspeth counties.
About El Paso Economic Indicators
Questions can be addressed to Keighton Hines at keighton.hines@dal.frb.org. El Paso Economic Indicators is published every month after state and metro employment data are released.