El Paso Economic Indicators

July 23, 2021
The El Paso economy continues to recover from the economic effects of the COVID-19-pandemic. In June, the business-cycle index expanded at its fastest monthly annualized rate in 11 months. Due to maintained international border restrictions, northbound and southbound crossing volumes were still below prepandemic levels, but southbound traffic showed continual monthly improvements. Monthly trade volumes remained uneven. Industrial conditions on both sides of the border advanced, while manufacturing and auto activity retreated.
Business-Cycle Index
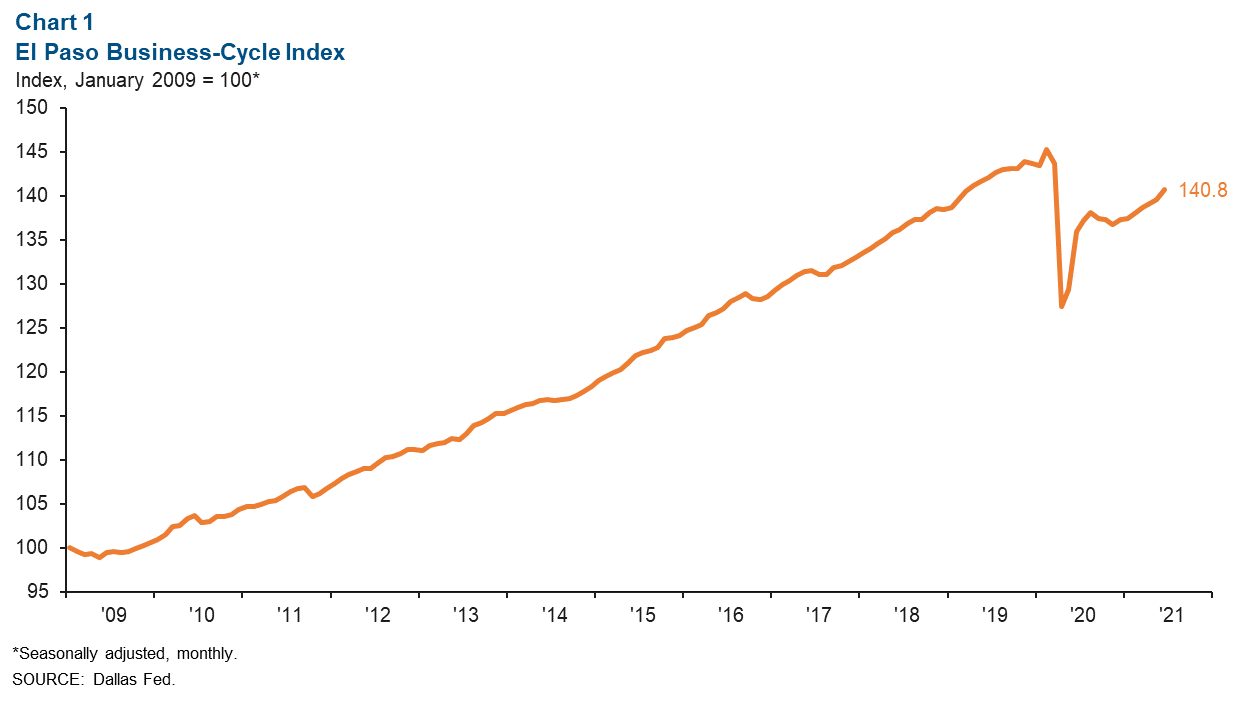
The El Paso Business-Cycle Index rose an annualized 10.4 percent in June, buoyed by employment growth and a decline in the unemployment rate (Chart 1). Compared with prepandemic levels (February 2020), the index is down 3.1 percent.
Labor Market
In June, El Paso employment expanded an annualized 8.1 percent, or 2,024 jobs (Chart 2). Gains were largely driven by government (1,348 jobs), trade, transportation and utilities (377), and leisure and hospitality (224).
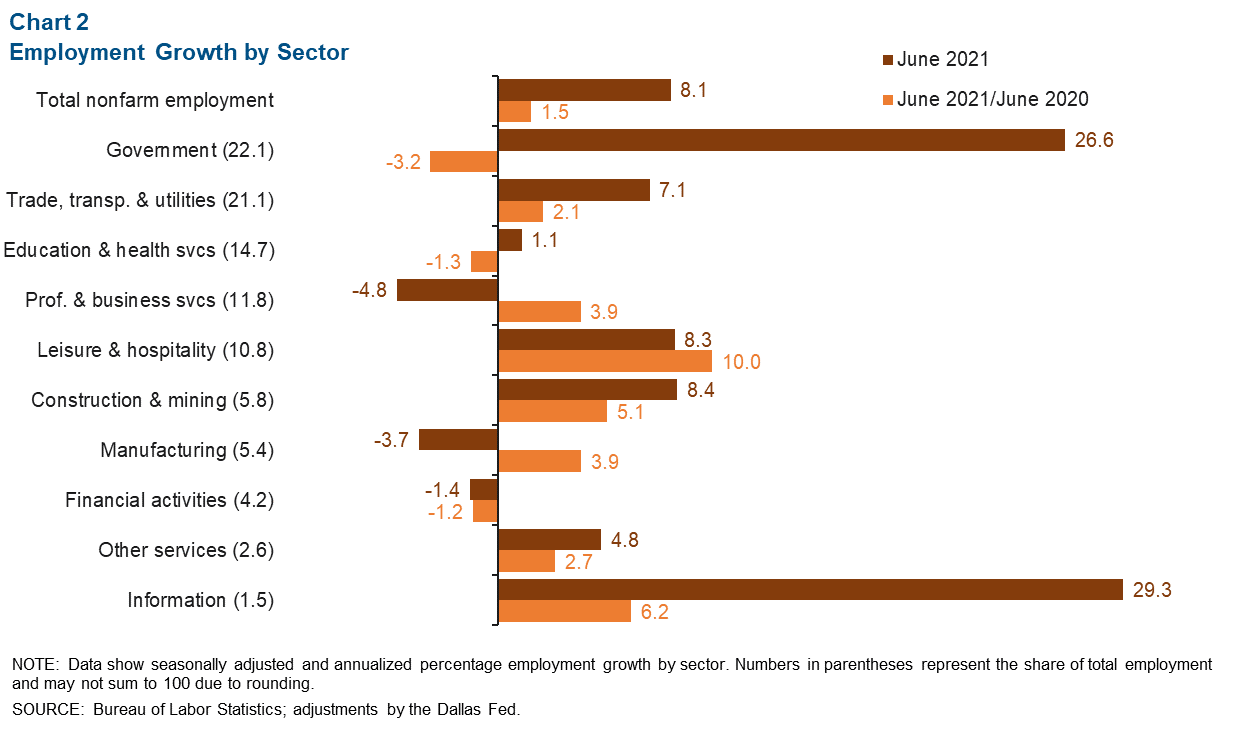
Year over year in June, El Paso payrolls were up 1.5 percent, or 4,769 jobs. Sectors that experienced job growth included leisure and hospitality (3,092 jobs), professional and business services (1,372), and trade, transportation and utilities (1,363). The metro’s largest sector, government, saw employment losses during this period (-2,293 jobs), as did education and health services (-610), and financial activities (-160).
El Paso’s seasonally adjusted unemployment rate fell from 7.0 percent in May to 6.7 percent in June. Comparatively, the jobless rate in Texas also fell from 6.6 to 6.5 percent, while the U.S. figure rose from 5.8 percent to 5.9 percent.
International Bridge Traffic Volumes
Northbound Travel Remains Well Below Prepandemic Levels
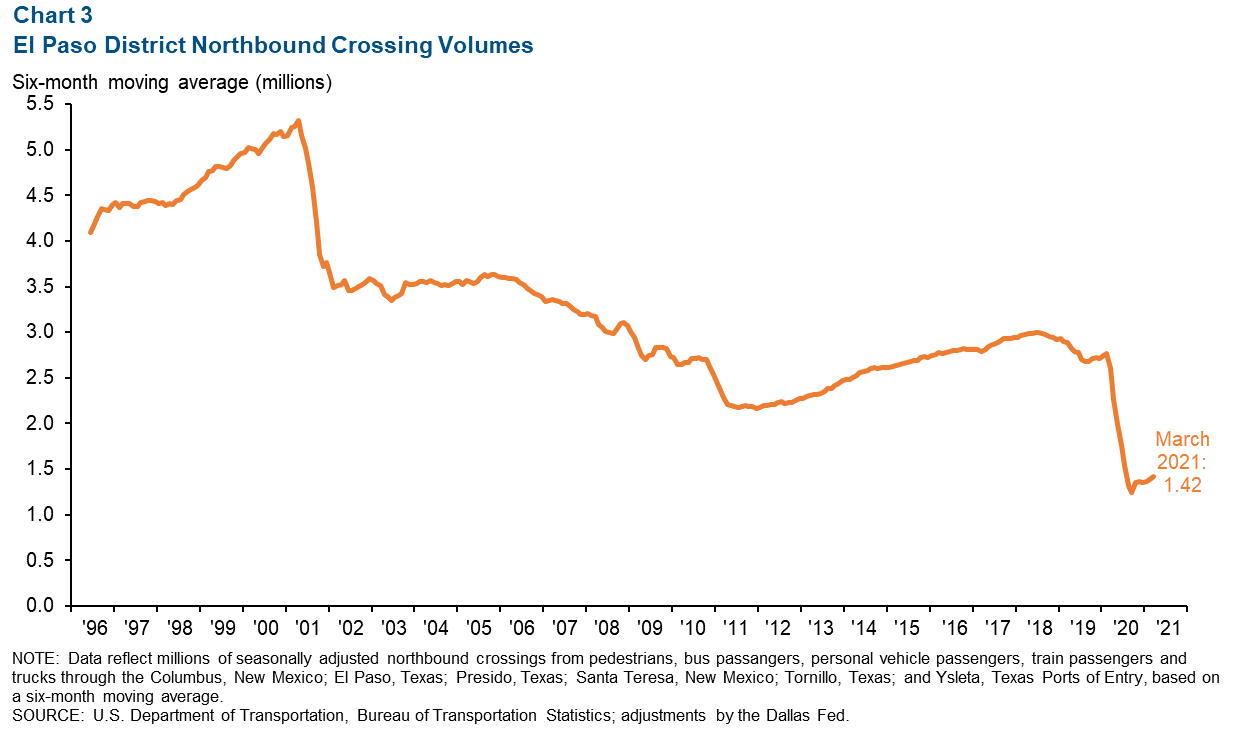
Following the closure of the U.S.–Mexico border for nonessential travel on March 21, 2020, both northbound and southbound El Paso international bridge traffic plunged and has not yet fully recovered. According to the latest figures, March 2021 El Paso District northbound crossings were just 1.42 million, 45.3 percent below March 2020’s volumes (Chart 3). The El Paso District is defined as Columbus, New Mexico; El Paso, Texas; Presidio, Texas; Santa Teresa, New Mexico; Tornillo, Texas; and Ysleta, Texas Ports of Entry.
Southbound Traffic Continues to Recover
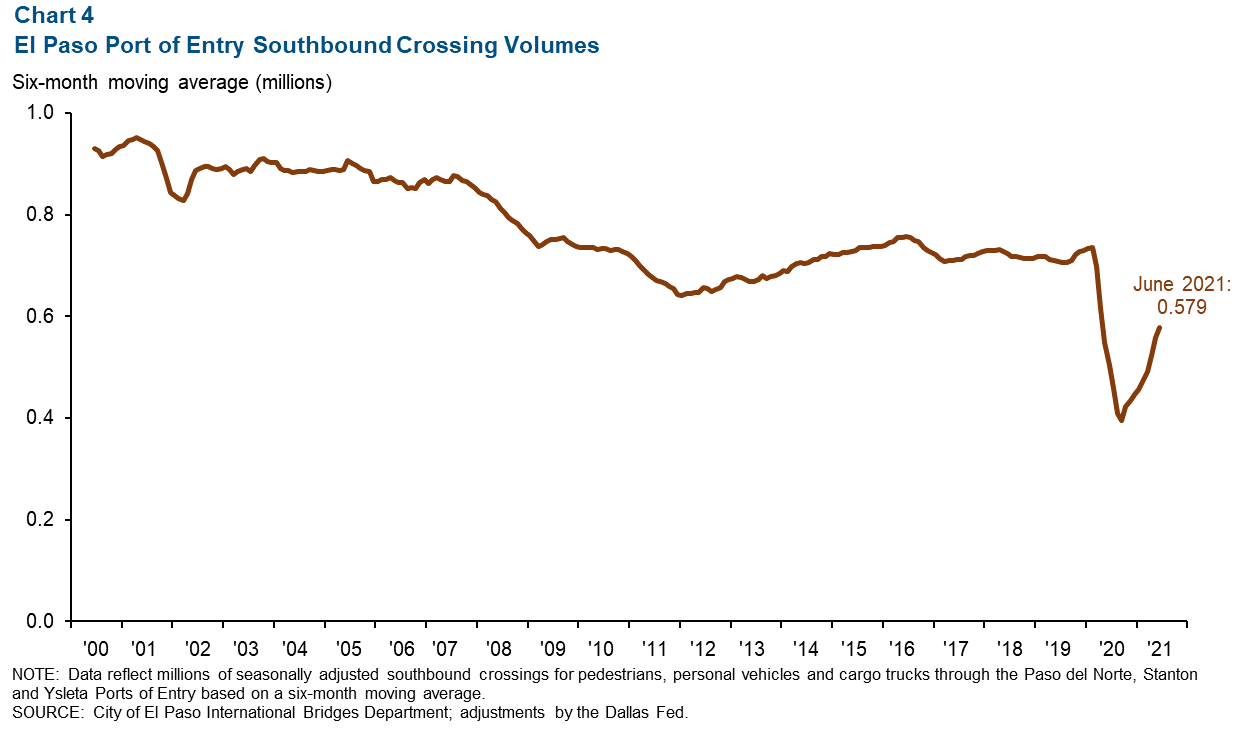
U.S. Customs and Border Protection does not collect comparable data for southbound crossings. However, the City of El Paso’s International Bridges Department compiles and publishes data on southbound bridge traffic through the Paso del Norte, Stanton and Ysleta Ports of Entry. Although not yet at prepandemic levels, southbound traffic volumes at these El Paso ports of entry were approximately 579,000 crossings, up 15.1 percent on a year-over-year basis in June 2021 (Chart 4). As the recovery continues and restrictions are lifted, both northbound and southbound bridge traffic volumes through the El Paso international bridges are expected to increase.
Trade
Annualized monthly trade through the El Paso trade district fell 6.6 percent to $111.2 billion in May (Chart 5). This decrease was driven by declines in imports of 6.7 percent ($4.7 million) and exports of 6.5 percent ($3.2 million).
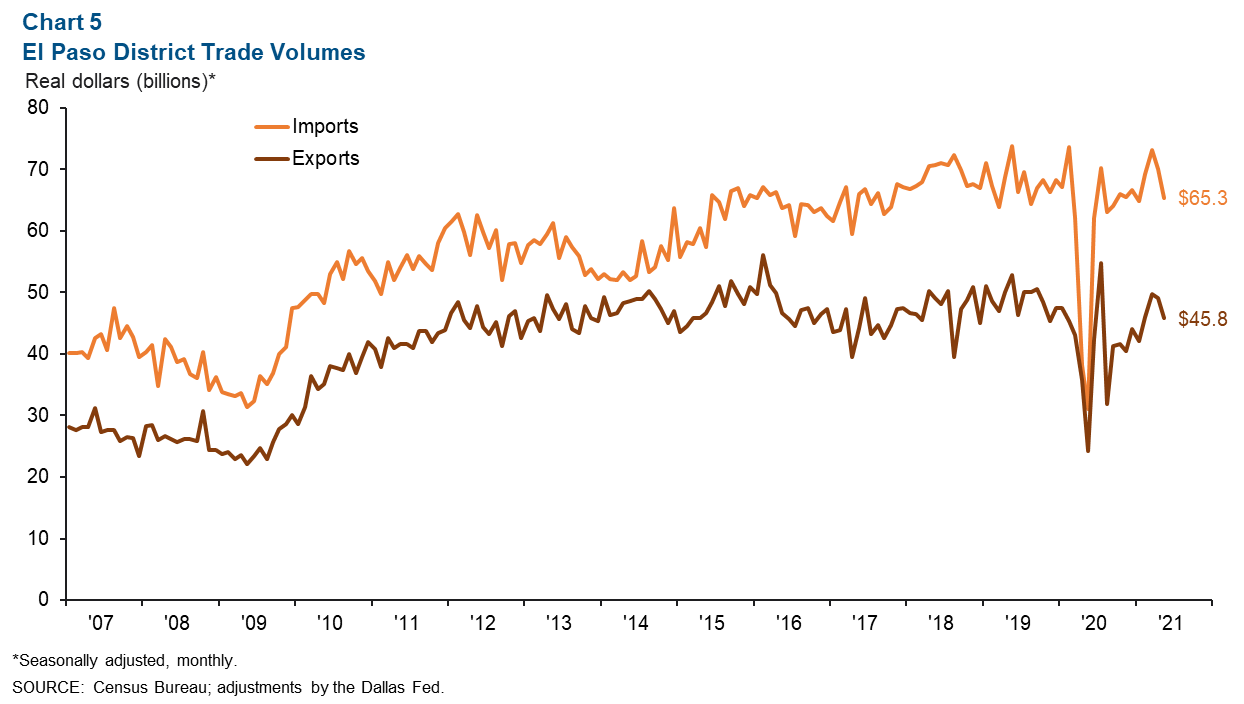
On a year-over-year basis, May 2021 trade through the El Paso District grew 101.5 percent, or by $56.0 million. Relative to prepandemic levels of May 2019, El Paso District trade shrank 12.1 percent in May 2021, or by -$15.3 million.
Industrial Production and Maquiladora-Related Activities
The monthly U.S. industrial production index rose from 99.7 in May to 100.1 in June and grew 9.8 percent from a year ago, although it expanded at a slower year-over-year pace than the previous month (16.1 percent)(Chart 6). Mexico’s industrial production index rose slightly from 98.6 in April to 98.8 in May and was 36.6 percent higher than a year prior. The Institute for Supply Management (ISM) manufacturing index ticked down to 60.6 percent in June from 61.2 in May but was up 16.1 percentage points from a year ago. ISM survey responses indicated that manufacturers continue to face raw material and labor shortages, rising commodity prices and transportation challenges and are struggling to meet elevated demand.
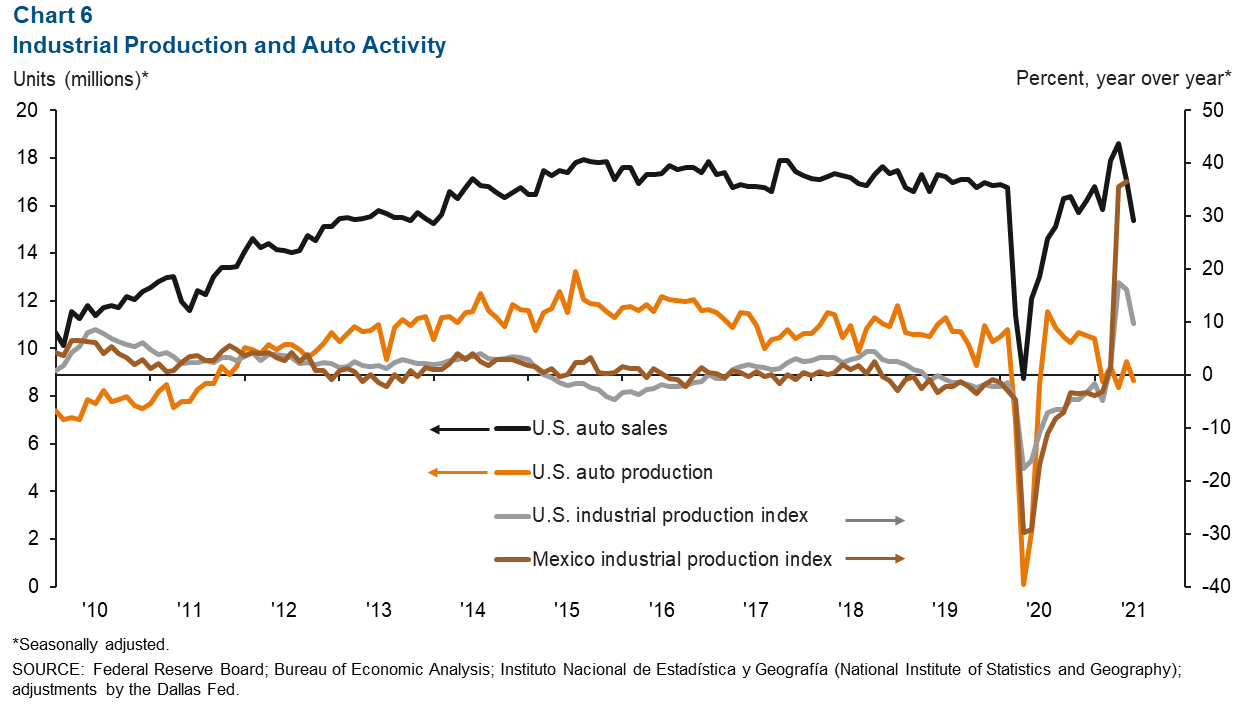
U.S. auto and light-truck production declined from 9.4 million units in May to 8.7 million units in June. Monthly auto sales also fell from 17.0 million in May to 15.4 million in June. Auto sales are closely linked to the local economy because roughly half of maquiladoras in Juárez are auto related.
NOTE: Data may not match previously published numbers due to revisions. The El Paso metropolitan statistical area includes El Paso and Hudspeth counties.
About El Paso Economic Indicators
Questions can be addressed to Keighton Hines at keighton.hines@dal.frb.org. El Paso Economic Indicators is published every month after state and metro employment data are released.