El Paso Economic Indicators

September 22, 2021
The El Paso economy’s pace of recovery from the pandemic-induced recession slowed in August. While employment levels in the metro slipped, unemployment fell and the business-cycle index rose. Home sales have slowed since February 2021, while home prices continue to set new highs. El Paso Trade District volumes were flat in July compared with prepandemic levels. Industrial and manufacturing activity expanded at a slower pace, but monthly auto sales fell for the fourth straight month in August.
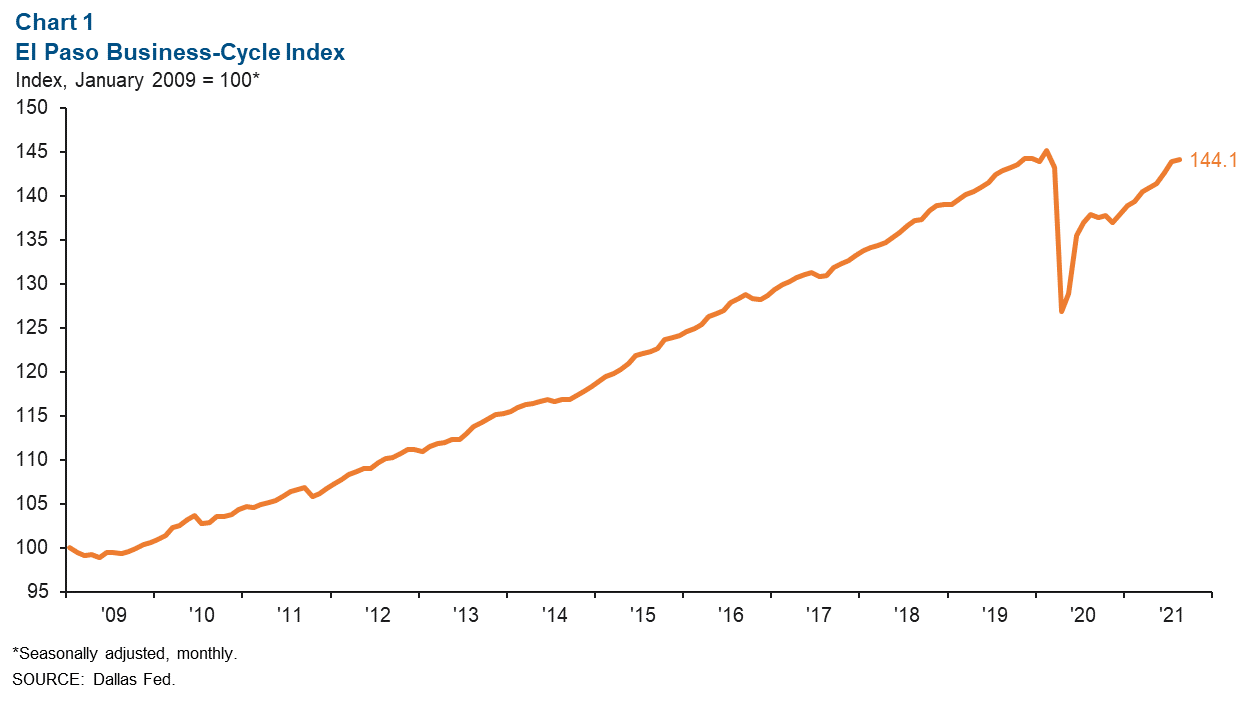
Business-Cycle Index
The El Paso Business-Cycle Index rose an annualized 2.3 percent in August (Chart 1). Compared with prepandemic levels (February 2020), the index is down only 0.7 percent.
Labor Market
In August, El Paso employment fell an annualized 0.8 percent, or a loss of 223 jobs (Chart 2). Job losses were driven largely by government (-602 jobs), and leisure and hospitality (-252). Sectors that saw monthly job gains included education and health services (472 jobs), construction and mining (242), and information (100).
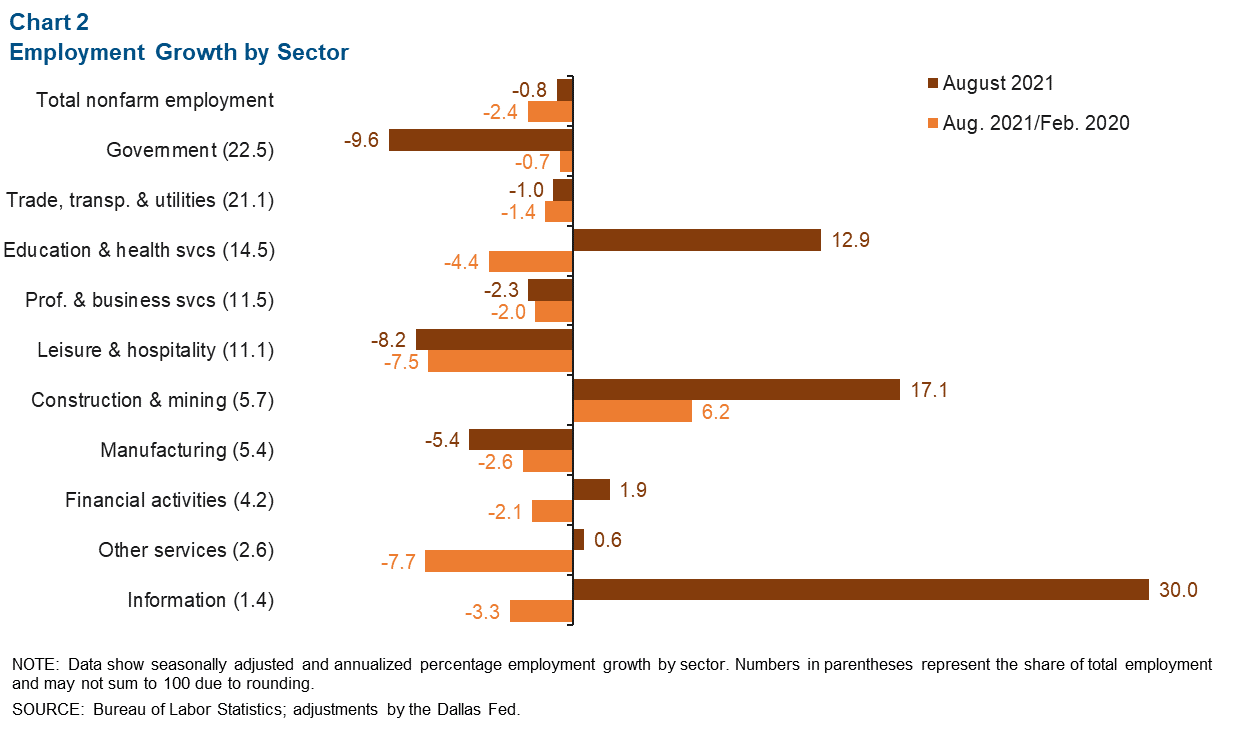
Over the last 19 months, El Paso payrolls were down 2.4 percent, or a loss of 7,746 jobs. Only the construction and mining sector saw employment growth during this period, adding 1,085 jobs. Sectors with major job losses since February 2020 include leisure and hospitality (-2,871 jobs), education and health services (-2,146), trade, transportation and utilities (-986), professional and business services (-732), and other services (-697).
El Paso’s seasonally adjusted unemployment rate fell from 6.3 percent in July to 5.8 percent in August. Similarly, the Texas jobless rate also fell from 6.2 percent to 5.9 percent, while the U.S. figure declined from 5.4 percent to 5.2 percent.
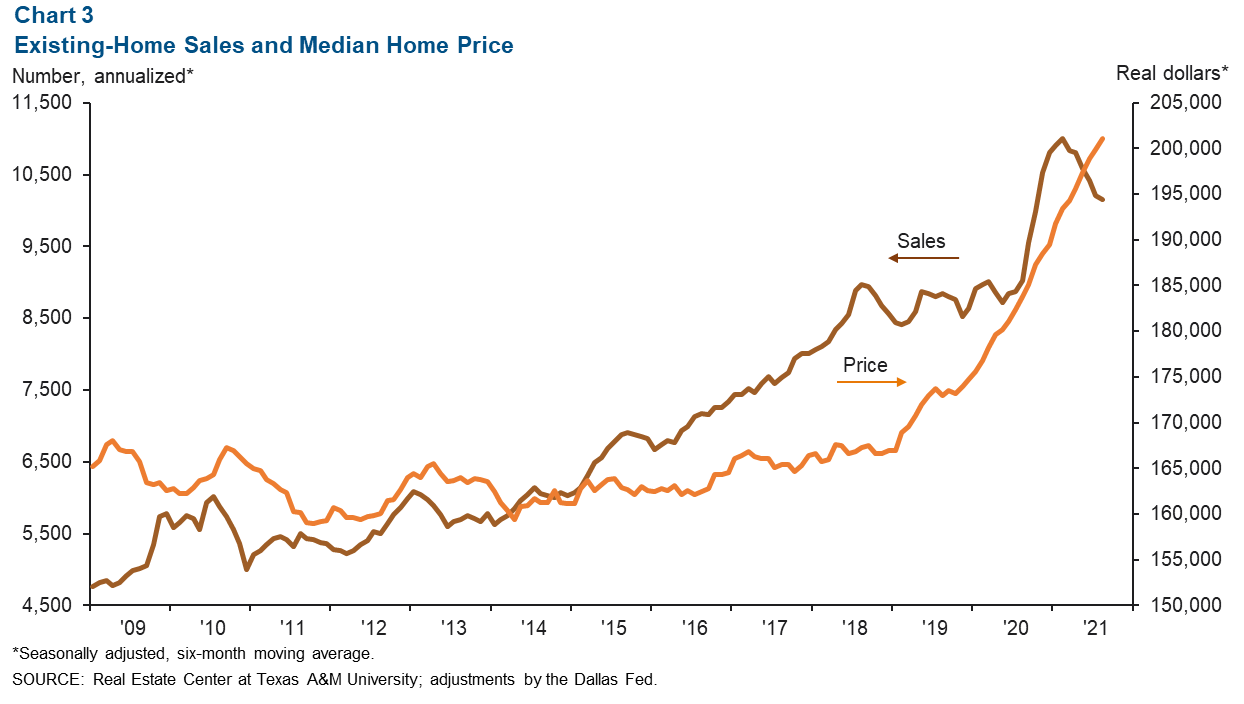
Housing Market
El Paso’s housing market has cooled since peaking in February 2021 when annualized home sales totaled 11,008 units. August 2021 home sales totaled an annualized 10,152 units, down 0.5 percent from the prior month but up 13.2 percent from February 2020 (Chart 3). The median home price in El Paso reached a new high of $201,057 in August, appreciating 0.6 percent in one month and 13.7 percent since the beginning of the pandemic. Existing-home inventories totaled 1.2 months in August, unchanged from July and well below the six months of supply associated with a balanced market.
Trade
Annualized monthly trade through the El Paso Trade District rose 0.4 percent to $119.4 billion in July (Chart 4). The marginal increase in trade was driven by growth in imports of 0.8 percent; exports fell 0.1 percent. Most trade through the El Paso Trade District came through the Ysleta Port of Entry (52.0 percent), while the Santa Teresa Port of Entry made up 25.8 percent, and the El Paso Port of Entry comprised 21.2 percent of total district trade volumes.
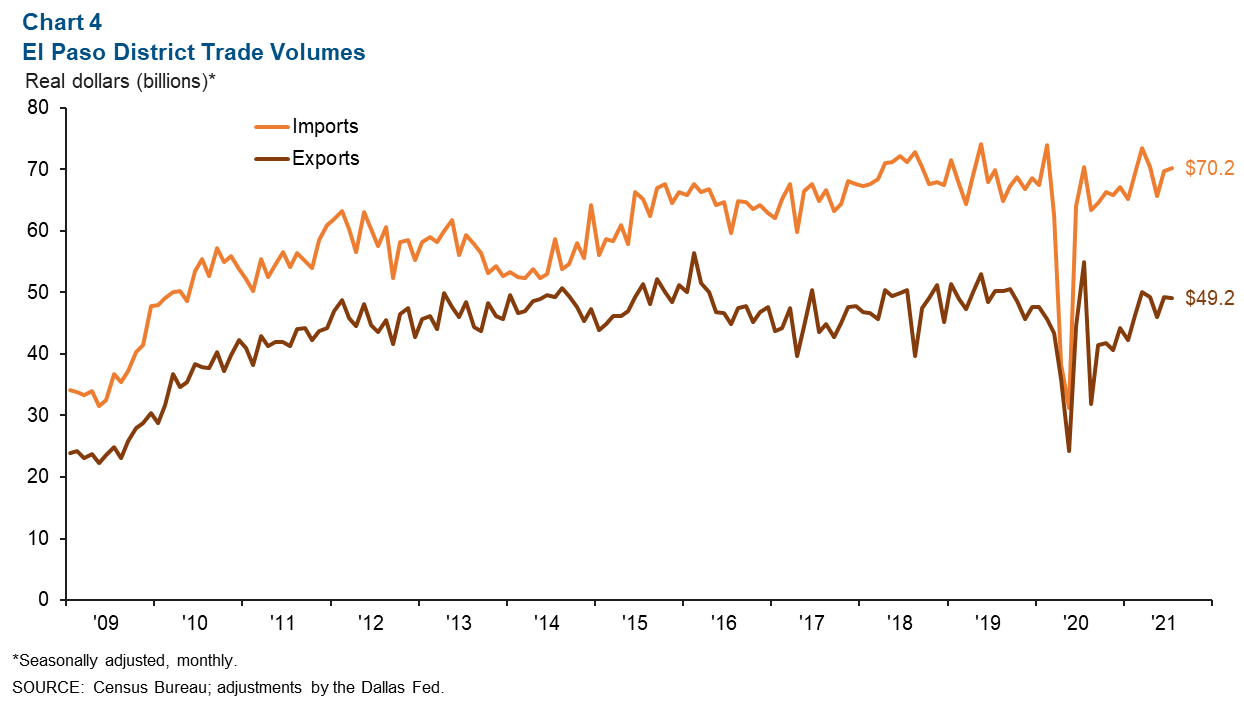
Despite the monthly growth, July total district trade volumes were flat compared with prepandemic levels. Since February 2020, exports were up 7.7 percent while imports were down 4.9 percent.
Industrial Production and Maquiladora-Related Activities
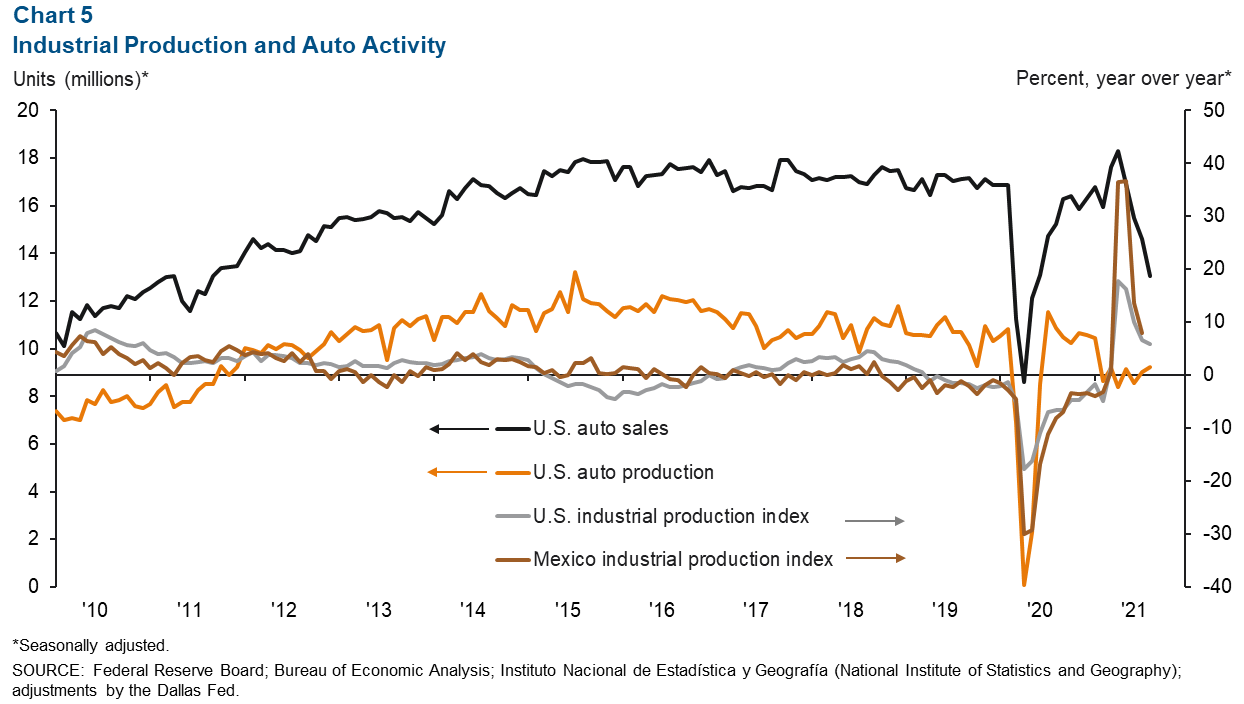
The monthly U.S. industrial production index rose from 101.2 in July to 101.6 in August and was up 5.9 percent from a year ago (Chart 5). Mexico’s industrial production index also rose from 97.7 in June to 98.8 in July and was 8.0 percent higher than a year prior.
The Institute for Supply Management (ISM) manufacturing index ticked up to 59.9 percent in August from 59.5 percent in July and was up 4.3 percentage points from a year ago. Comments from ISM panelists continued to indicate that long raw-material lead times, material shortages, rising commodities prices, transportation issues, worker absenteeism and hiring difficulties were obstacles to meeting increased demand.
U.S. auto and light-truck production grew from 9.0 million units in July to 9.2 million units in August. However, monthly auto sales fell from 14.6 million in July to 13.1 million in August. Industrial and auto activity are closely linked to the El Paso-area economy because of cross-border manufacturing relationships. Roughly half of maquiladoras in Juárez are auto related.
NOTE: Data may not match previously published numbers due to revisions. The El Paso metropolitan statistical area includes El Paso and Hudspeth counties.
About El Paso Economic Indicators
Questions can be addressed to Keighton Hines at keighton.hines@dal.frb.org. El Paso Economic Indicators is published every month after state and metro employment data are released.