El Paso Economic Indicators

October 27, 2021
After stumbling in August, the El Paso metro continued its recovery from the pandemic-induced recession in September. The El Paso Business-Cycle Index strengthened, and employment levels rose, despite the most recent surge in COVID-19 cases and deaths that extended into October. Meanwhile, mobility showed only modest negative effects. El Paso District total trade remained below prepandemic levels. U.S. industrial conditions weakened, while manufacturing activity expanded. Monthly auto sales fell for the fifth straight month.
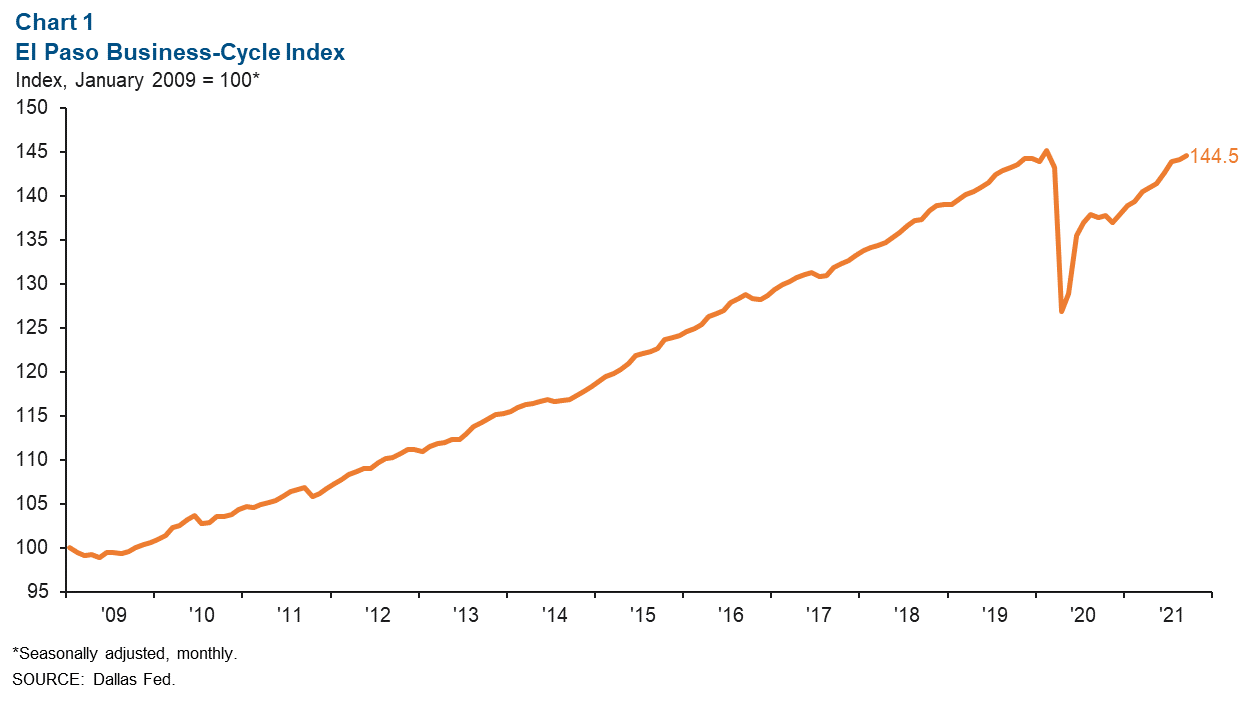
Business-Cycle Index
The El Paso Business-Cycle Index rose an annualized 3.0 percent in September (Chart 1). Compared with prepandemic levels (February 2020), the index is down only 0.4 percent.
Labor Market
In September, El Paso employment rose an annualized 1.8 percent, or by 474 jobs (Chart 2). Job gains were driven largely by trade, transportation and utilities (1,094 jobs), education and health services (835), and leisure and hospitality (416). The government sector shed 2,020 jobs in one month.
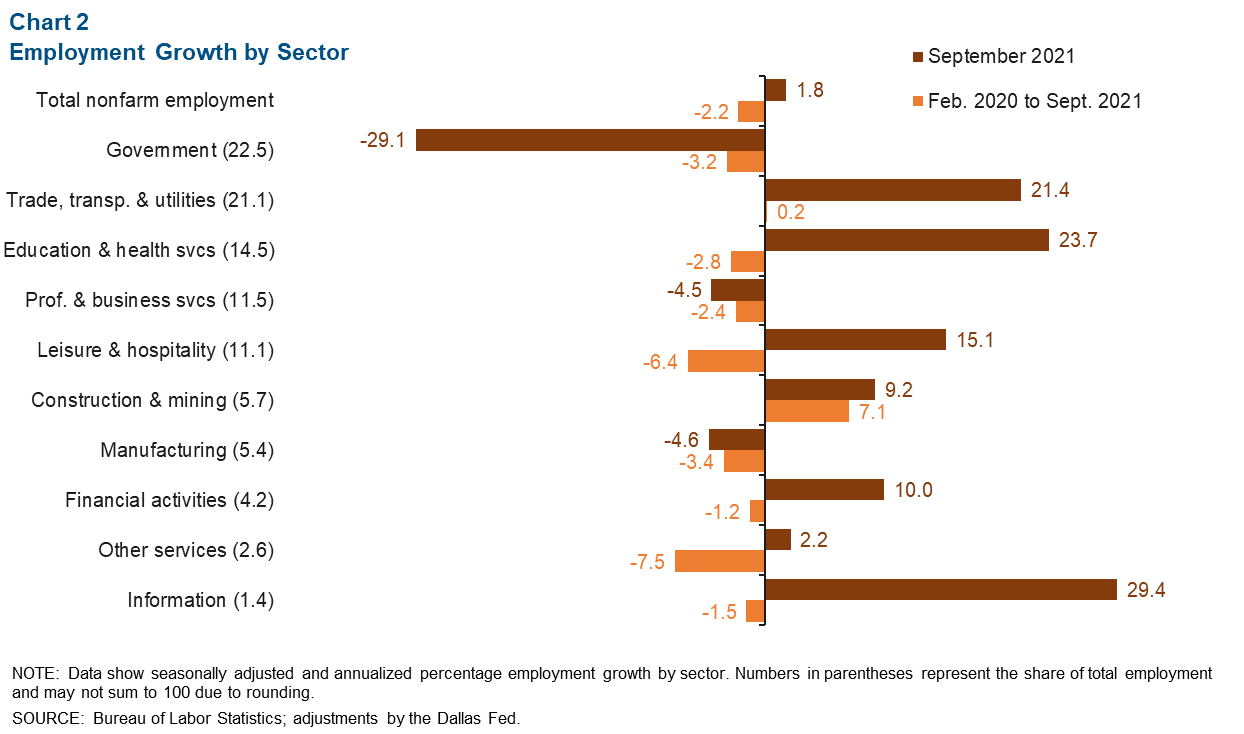
Over the last 20 months, El Paso payrolls fell 2.2 percent, or a loss of 7,151 jobs. During this time, construction and mining saw impressive growth, adding 1,234 jobs. Trade, transportation and utilities also added 135 jobs. Sectors with major job losses since February 2020 included leisure and hospitality (-2,436 jobs), government (-2,272), and education and health services (-1,391).
El Paso’s seasonally adjusted unemployment rate remained 5.8 percent in September. The Texas jobless rate fell from 5.9 percent to 5.6 percent, while the U.S. figure declined from 5.2 percent to 4.8 percent.
Daily COVID-19 Cases and Deaths
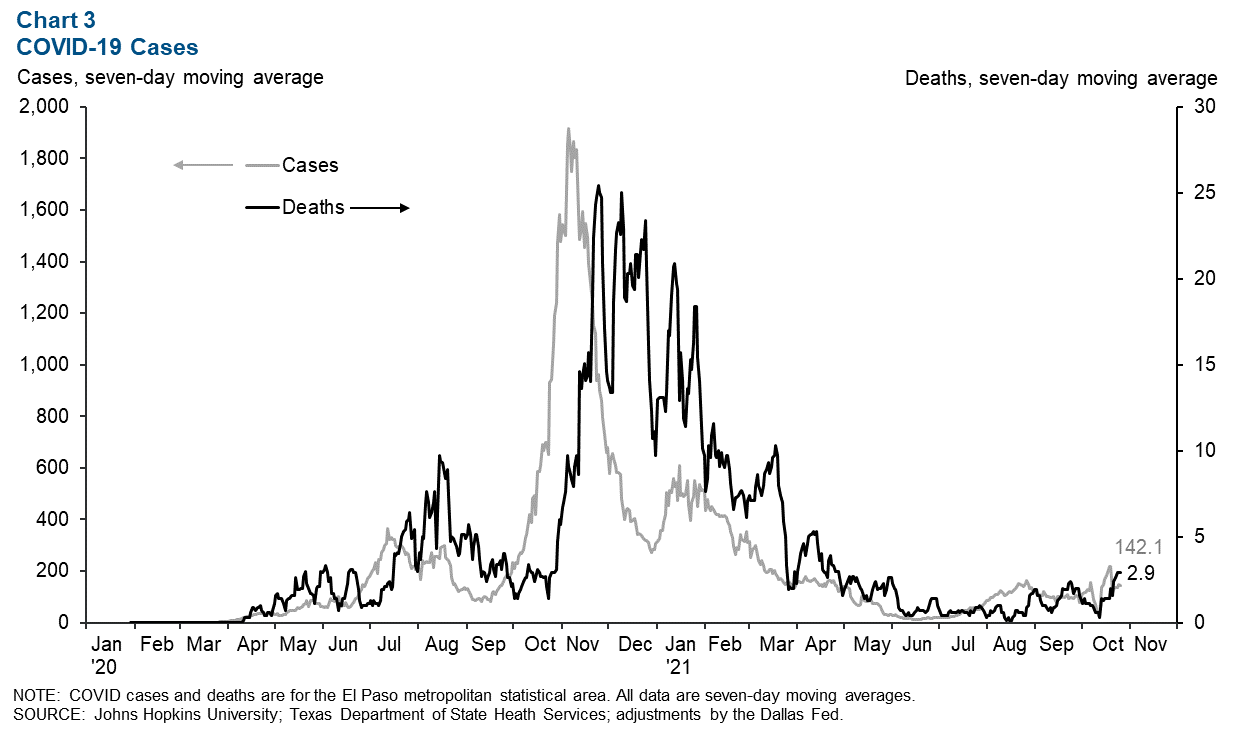
Despite the nation sitting on the backside of the most recent surge in COVID-19, the seven-day moving average of daily cases and deaths in the El Paso metro area is trending in the opposite direction. As of Oct. 25, daily cases reached 142.1, an increase of 113 daily new cases over the last two weeks (Chart 3). Similarly, COVID-19 deaths increased almost fivefold over the same period—2.9 people per day on Oct. 25.
Google Mobility
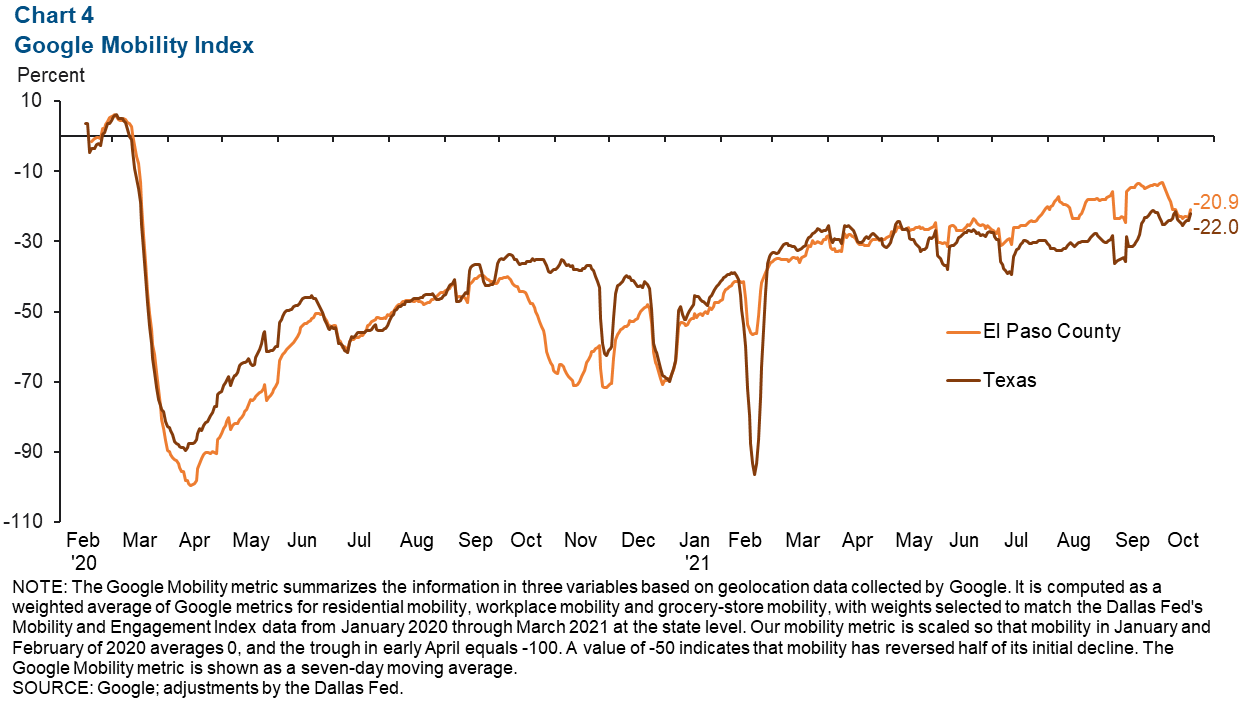
While Google mobility data for El Paso County have trended positively since the start of 2021, mobility slowed in early October. El Paso County mobility fell from -14.7 percent on Oct. 4 to -20.9 percent on Oct. 18, while Texas mobility was down 22.0 percent compared with prepandemic levels (Chart 4). This may be due to a combination of seasonal factors and the latest increase in COVID-19 cases.
Trade
Annualized monthly trade through the El Paso Trade District fell 2.6 percent to $116.3 billion in August (Chart 5). The decrease in trade was driven by imports declining 7.4 percent; exports rose 4.1 percent. Most trade through the El Paso Trade District came through the Ysleta Port of Entry (58.6 percent), while the El Paso Port of Entry comprised 20.9 percent, and the Santa Teresa Port of Entry made up 19.8 percent of total district trade volumes.
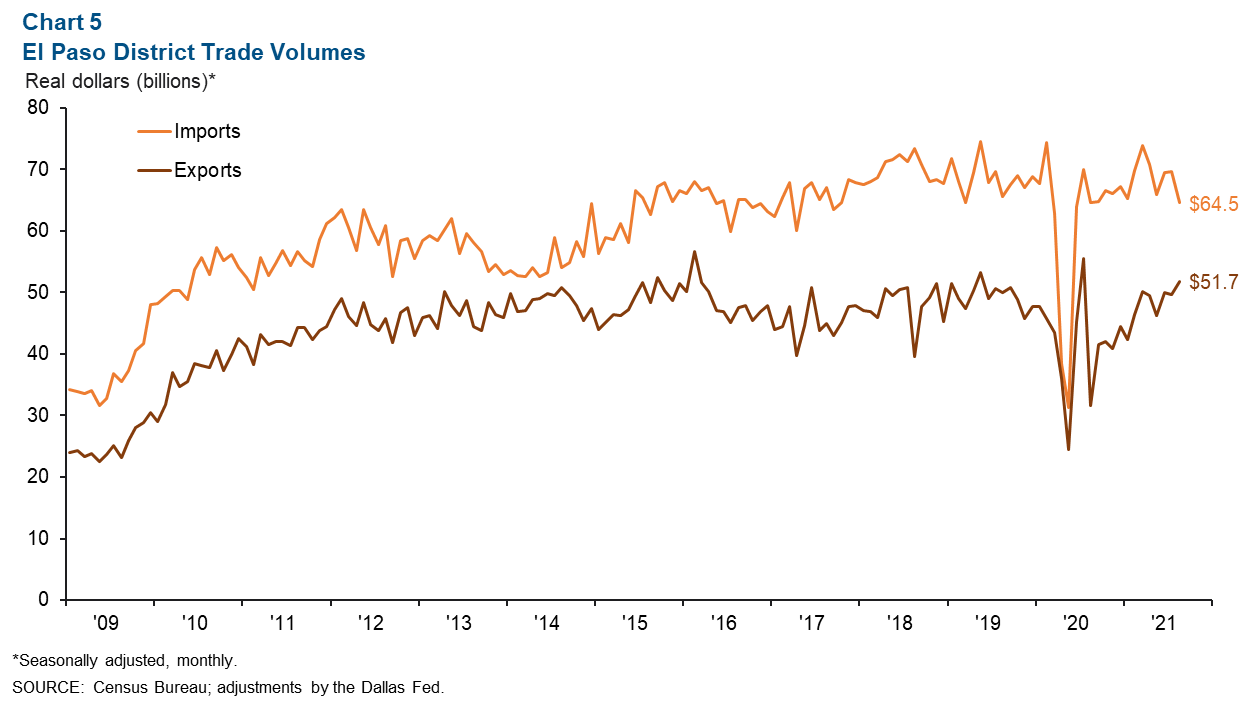
August total district trade volumes were 3.1 percent below prepandemic levels of $120.0 billion, with imports down 13.1 percent, while exports were up 13.1 percent.
Industrial Production and Maquiladora-Related Activities
The monthly U.S. industrial production index fell from 101.3 in August to 100 in September but was up 4.6 percent from a year ago (Chart 6). Mexico’s industrial production index rose from 98.9 in July to 99.3 in August and was 5.2 percent higher than a year prior. The Institute for Supply Management (ISM) manufacturing index rose from 59.9 percent in August to 61.1 percent in September and was up 5.4 percentage points from a year ago. Comments from ISM panelists continued to indicate that long raw-material lead times, material shortages, rising commodities prices, transportation issues, overseas supply-chain problems, worker absenteeism and hiring difficulties were hurdles to meeting increased demand.
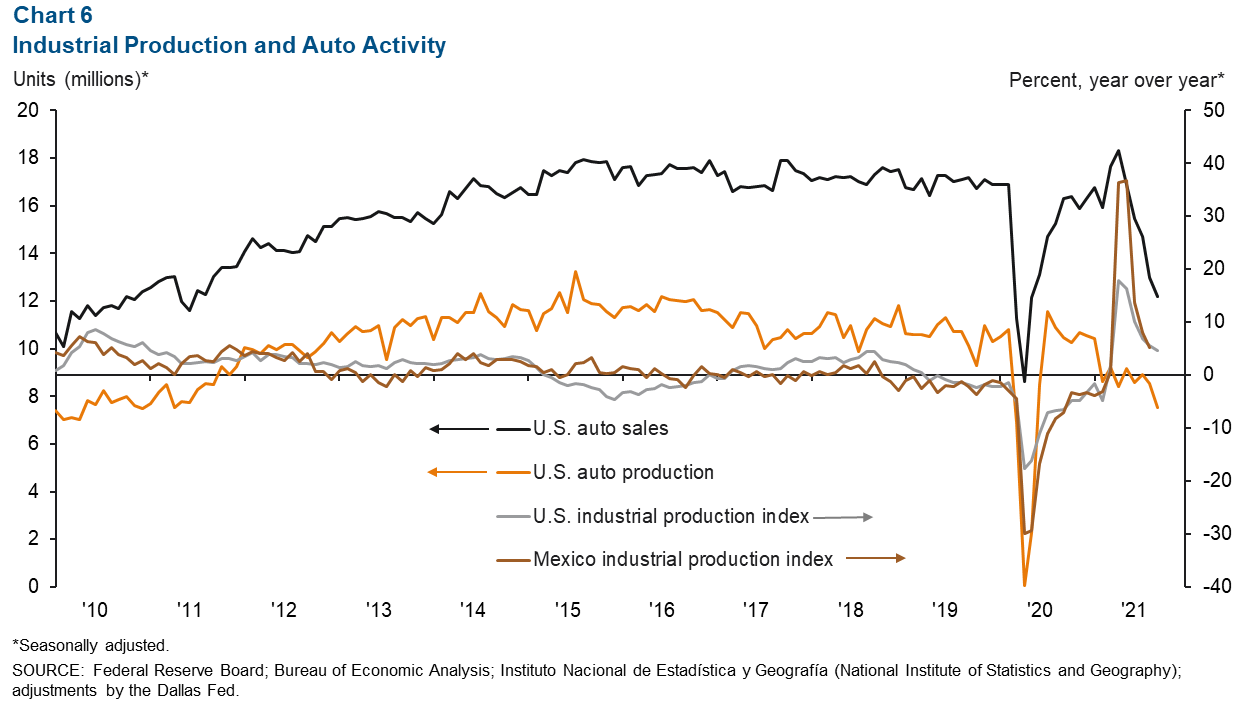
U.S. auto and light-truck production fell from 8.6 million units in August to 7.5 million units in September. Monthly auto sales also fell from 13.0 million in August to 12.2 million in September. Industrial and auto activity are closely linked to the El Paso-area economy because of cross-border manufacturing relationships. Roughly half of maquiladoras in Juárez are auto related.
NOTE: Data may not match previously published numbers due to revisions. The El Paso metropolitan statistical area includes El Paso and Hudspeth counties.
About El Paso Economic Indicators
Questions can be addressed to Keighton Hines at keighton.hines@dal.frb.org. El Paso Economic Indicators is published every month after state and metro employment data are released.