El Paso Economic Indicators

November 23, 2021
Despite slower growth compared with September, the El Paso metro neared its prepandemic economic levels in October. The business-cycle index and employment strengthened. El Paso County consumer spending and El Paso District total trade were above prepandemic levels. Border crossings climbed in October. U.S. industrial conditions improved, and manufacturing activity expanded.
Business-Cycle Index
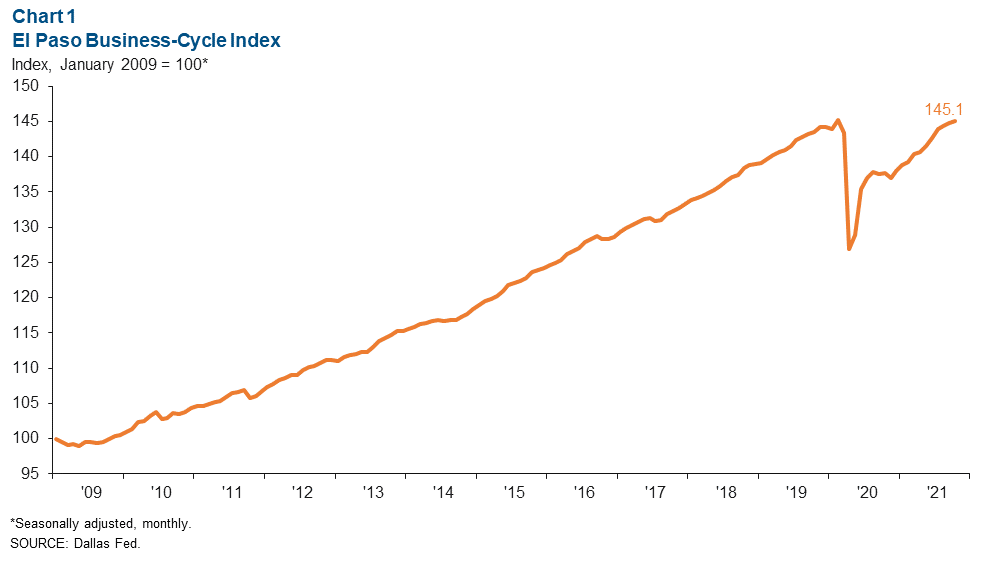
The El Paso Business-Cycle Index rose an annualized 3.0 percent in October after increasing 3.8 percent in September (Chart 1). Compared with prepandemic levels (February 2020), the index has nearly recovered—down only 0.1 percent.
Labor Market
In October, El Paso employment rose an annualized 0.8 percent, or by 214 jobs (Chart 2). Job gains were driven largely by trade, transportation and utilities (524 jobs), leisure and hospitality (212), and other services (101). The construction and government sectors shrank by 230 jobs and 207 jobs, respectively.
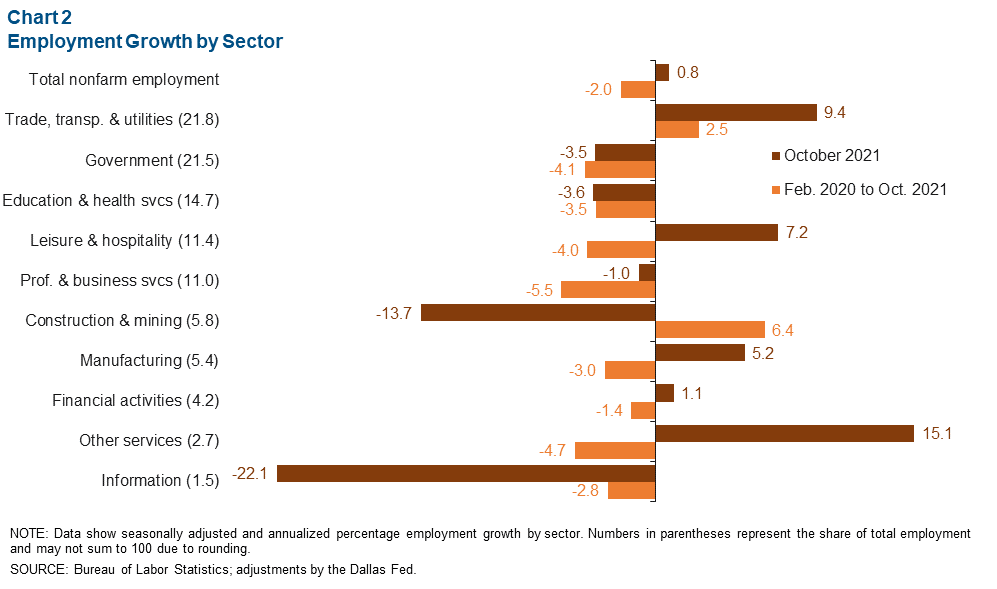
Since the onset of the pandemic, El Paso payrolls were down 2.0 percent, or a loss of 6,671 jobs through October. During this time, the government sector shed 2,963 jobs, professional and business services lost 2,050 jobs, education and health services dropped 1,704 jobs, and leisure and hospitality shrank by 1,524 jobs. Sectors with employment above February 2020 levels included trade, transportation and utilities (1,728 jobs), and construction and mining (1,120).
El Paso’s seasonally adjusted unemployment rate rose slightly to 5.8 percent in October from 5.7 percent in September. The Texas jobless rate fell from 5.6 percent to 5.4 percent, while the U.S. figure declined from 4.8 percent to 4.6 percent.
Consumer Spending
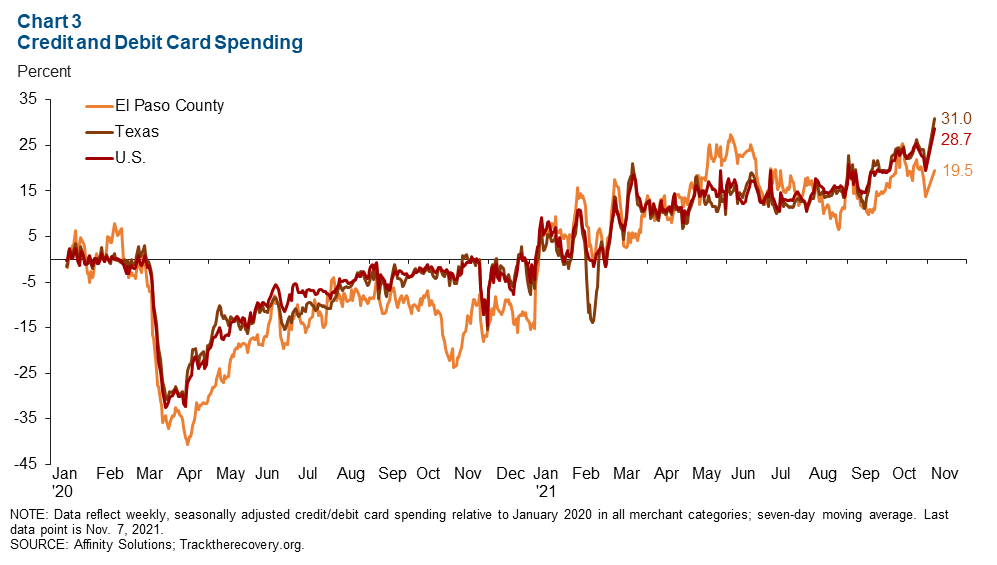
El Paso County consumer spending (as measured by credit and debit card spending) has completely recovered and is above prepandemic spending levels (Chart 3). As of Nov. 7, spending in the county was up 19.5 percent from January 2020 compared with an increase of 31.0 percent in Texas and a rise of 28.7 percent in the U.S.
International Bridge Traffic Volumes
Northbound Crossings Edge Up
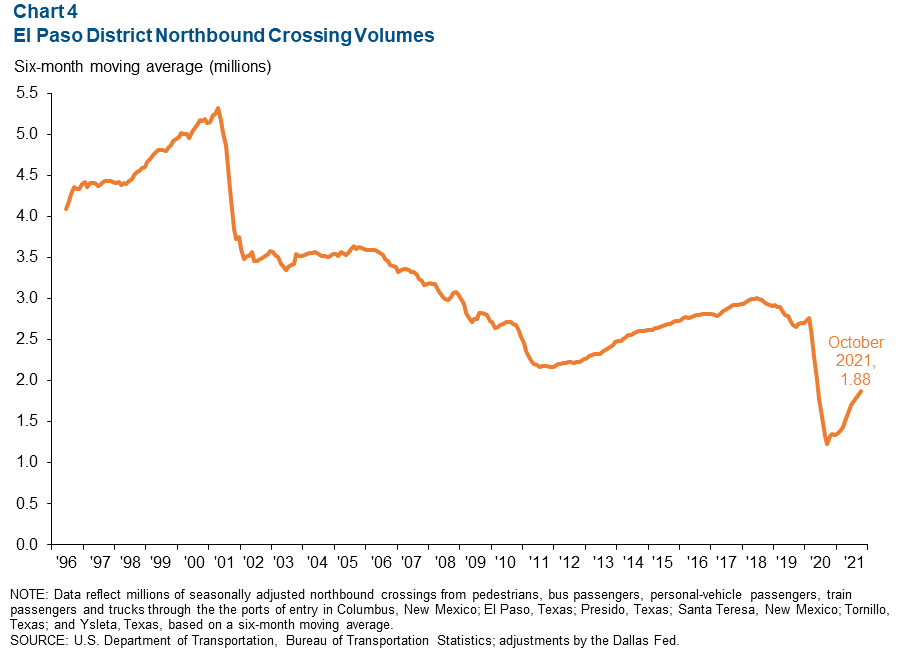
After remaining closed for 20 months, the U.S.–Mexico border reopened to vaccinated, nonessential travelers on Nov. 8. According to the latest figures, October 2021 El Paso District northbound crossings were 1.88 million, 41.1 percent above October 2020 but 30.1 percent below October 2019’s volumes (Chart 4). The El Paso District is defined as ports of entry in Columbus, New Mexico; El Paso, Texas; Presidio, Texas; Santa Teresa, New Mexico; Tornillo, Texas; and Ysleta, Texas.
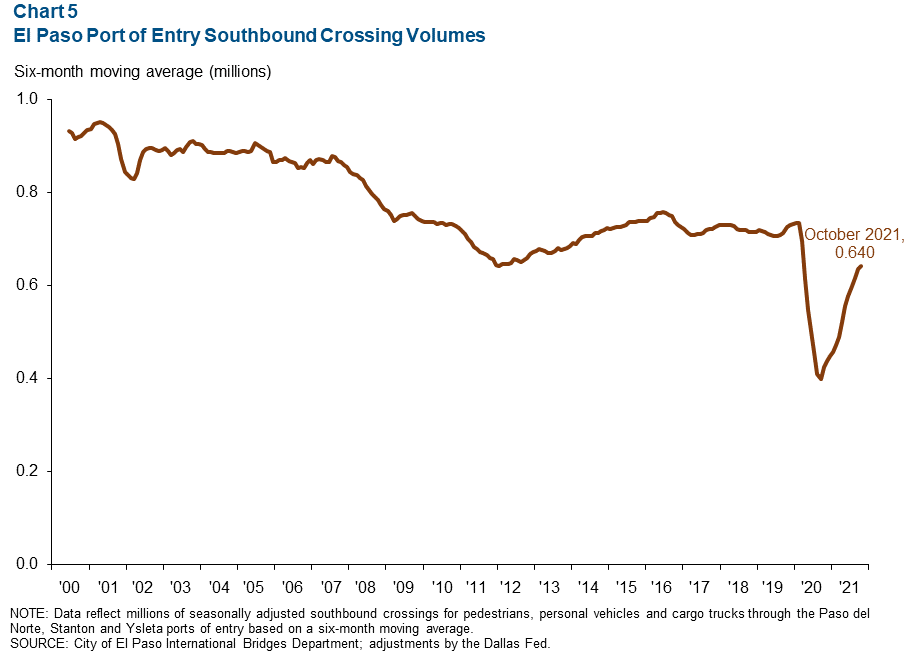
Southbound Traffic Improves
U.S. Customs and Border Protection does not collect comparable data for southbound crossings. However, the city of El Paso’s International Bridges Department compiles and publishes data on southbound bridge traffic through the Paso del Norte, Stanton and Ysleta ports of entry. October 2021 southbound traffic volumes at these El Paso ports of entry totaled 640,267 crossings, up 50.7 percent on a year-over-year basis but 11.6 percent below October 2019’s volume (Chart 5). As the recovery continues, both northbound and southbound bridge traffic volumes through El Paso District international bridges are expected to increase.
Trade
Annualized monthly trade through the El Paso Trade District rose 2.9 percent to $121.3 billion in September (Chart 6). The increase in trade was driven by imports growth of 6.8 percent; exports fell 1.9 percent. Most trade through the El Paso Trade District came through the Ysleta Port of Entry (56.8 percent), while the Santa Teresa Port of Entry comprised 21.7 percent of total district trade volumes and the El Paso Port of Entry made up 20.9 percent.
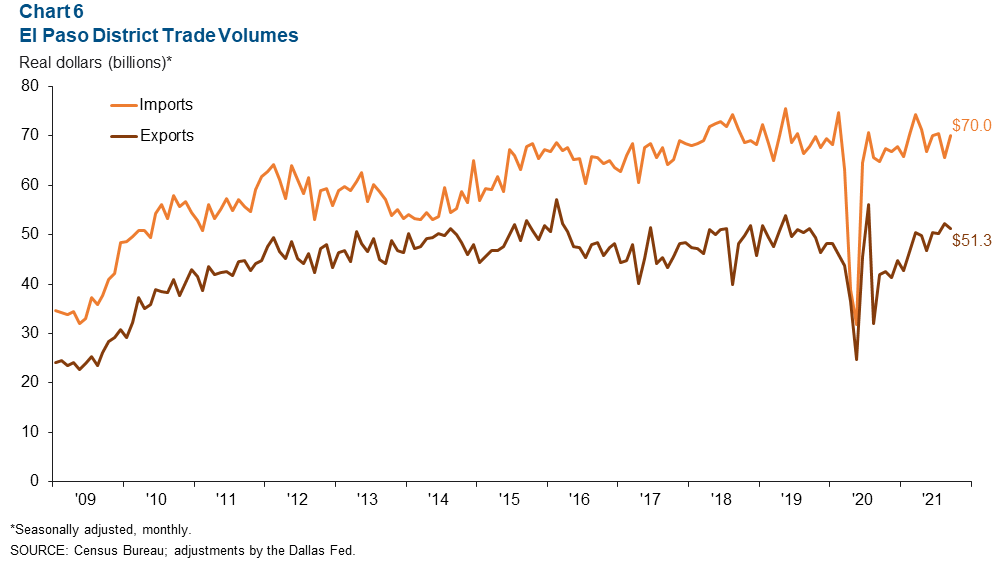
September total district trade volumes were 0.4 percent above prepandemic levels of $120.8 billion. Since February 2020, imports were down 6.5 percent while exports were up 11.5 percent.
Industrial Production and Maquiladora-Related Activities
The monthly U.S. industrial production index rose from 100 in September to 101.6 in October and was up 5.1 percent from a year ago (Chart 7). Mexico’s industrial production index fell from 98.7 in August to 97.3 in September but was 1.7 percent higher than a year prior. The Institute for Supply Management (ISM) manufacturing index fell from September’s 61.1 percent to 60.8 in October but was up 2.0 percentage points from a year ago. Comments from ISM panelists continue to indicate that long raw-material lead times, material shortages, rising commodities prices, transportation issues, overseas supply-chain problems, port congestion, worker absenteeism and hiring difficulties were hurdles to meeting increased demand.
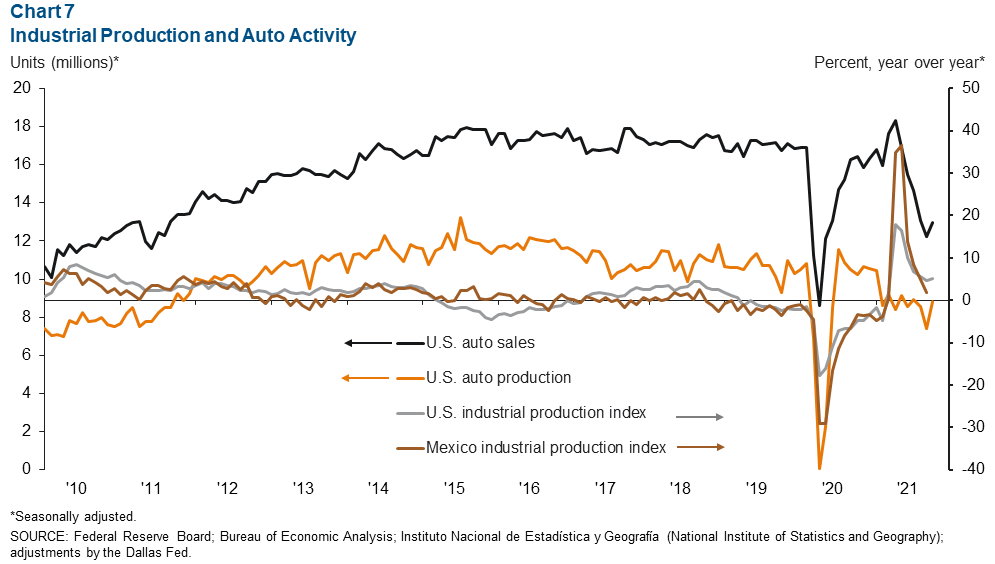
U.S. auto and light-truck production rose from 7.4 million units in September to 8.8 million units in October. Monthly auto sales also rose from 12.2 million in September to 13.0 million in October. Industrial and auto activity are closely linked to the El Paso-area economy because of cross-border manufacturing relationships. Roughly half of maquiladoras in Juárez are auto related.
NOTE: Data may not match previously published numbers due to revisions. The El Paso metropolitan statistical area includes El Paso and Hudspeth counties.
About El Paso Economic Indicators
Questions can be addressed to Keighton Hines at keighton.hines@dal.frb.org. El Paso Economic Indicators is published every month after state and metro employment data are released.