El Paso Economic Indicators

December 22, 2021
The El Paso metro surpassed its prepandemic economic levels in November, according to its business-cycle index. Despite continued monthly employment gains, the metro’s labor market was approximately 5,800 jobs short of February 2020 levels. Meanwhile, the seven-day moving average of daily COVID-19 deaths in the El Paso metro area continued to trend in the opposite direction of daily cases, which have fallen in the last two weeks. Local housing prices strengthened, and industrial and manufacturing activity expanded.
Business-Cycle Index
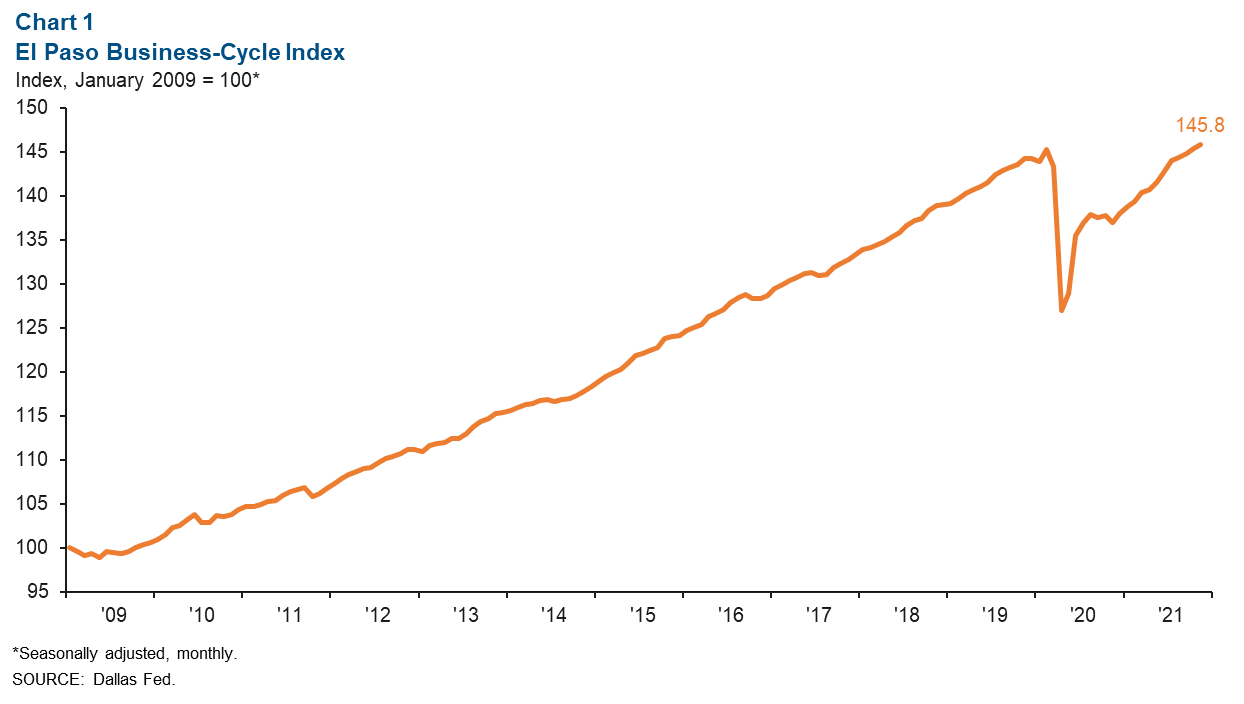
The El Paso Business-Cycle Index rose an annualized 4.0 percent in November after increasing 4.8 percent in October (Chart 1). Compared with prepandemic levels (February 2020), the index has completely recovered and is up 0.4 percent.
Labor Market
In November, El Paso employment rose an annualized 1.3 percent, or by 343 jobs (Chart 2). Job gains were driven largely by education and health services (243 jobs), leisure and hospitality (223), manufacturing (190), and construction and mining (154). The professional and business services and trade, transportation and utilities sectors shrank by 305 and 342 jobs, respectively.
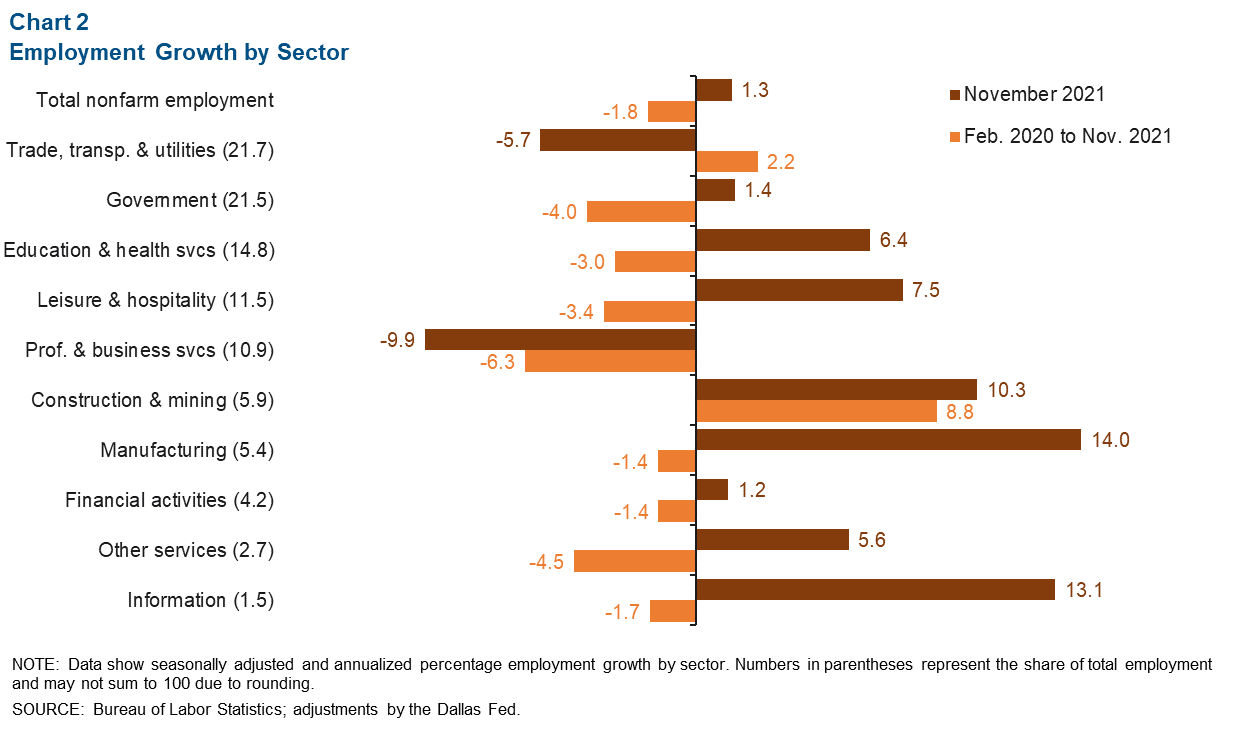
Since the onset of the pandemic and through November 2021, the metro’s payrolls were down 1.8 percent, or a loss of 5,815 jobs. During this time, employment was down by 2,878 positions in the government sector, 2,331 in professional and business services, 1,454 in education and health services, and 1,293 in leisure and hospitality. The only sectors with employment above February 2020 levels included trade, transportation and utilities (1,529 jobs), and construction and mining (1,533).
El Paso’s seasonally adjusted unemployment rate fell to 5.4 percent in November from 5.7 percent in October. The Texas jobless rate fell from 5.4 percent to 5.2 percent, while the U.S. figure declined from 4.6 percent to 4.2 percent.
Daily COVID-19 Cases and Deaths
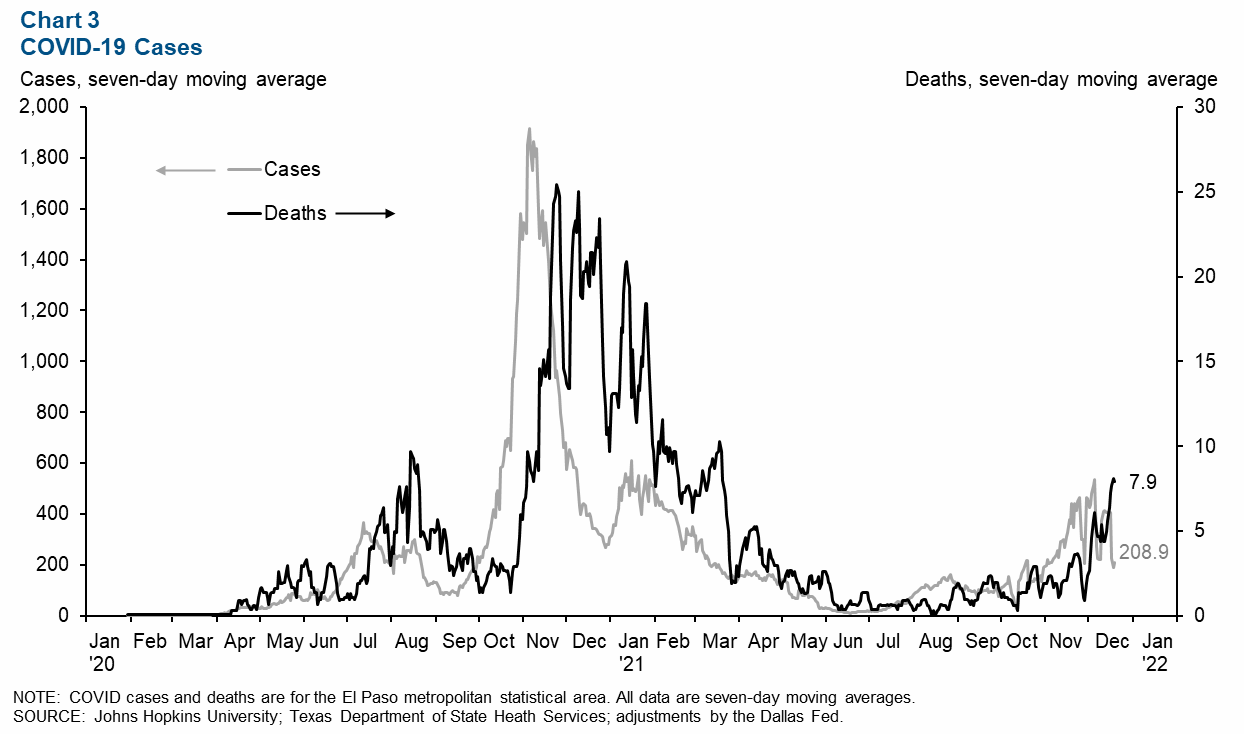
While daily COVID-19 cases have declined recently in the El Paso metro, deaths are surging once again. As of Dec. 19, the seven-day moving average of daily cases was nearly 209, a decrease of 327 daily cases in the last two weeks (Chart 3). However, daily COVID-19 deaths nearly doubled during the same period to almost eight people per day but remain lower than last fall.
As of Dec. 19, 166,237 cases and 3,078 deaths had been reported in the El Paso metro area since the onset of the pandemic. El Paso’s COVID-19 case rate was 197 cases per 1,000 residents, 28 percent higher than the rest of the U.S. (excluding El Paso) at 154 cases per 1,000 residents. Comparatively, the metro’s death rate was 3.6 deaths per 1,000 residents, 1.5 times higher than the rest of the nation’s (excluding El Paso) death rate of 2.4 deaths per 1,000 residents.
Housing Market
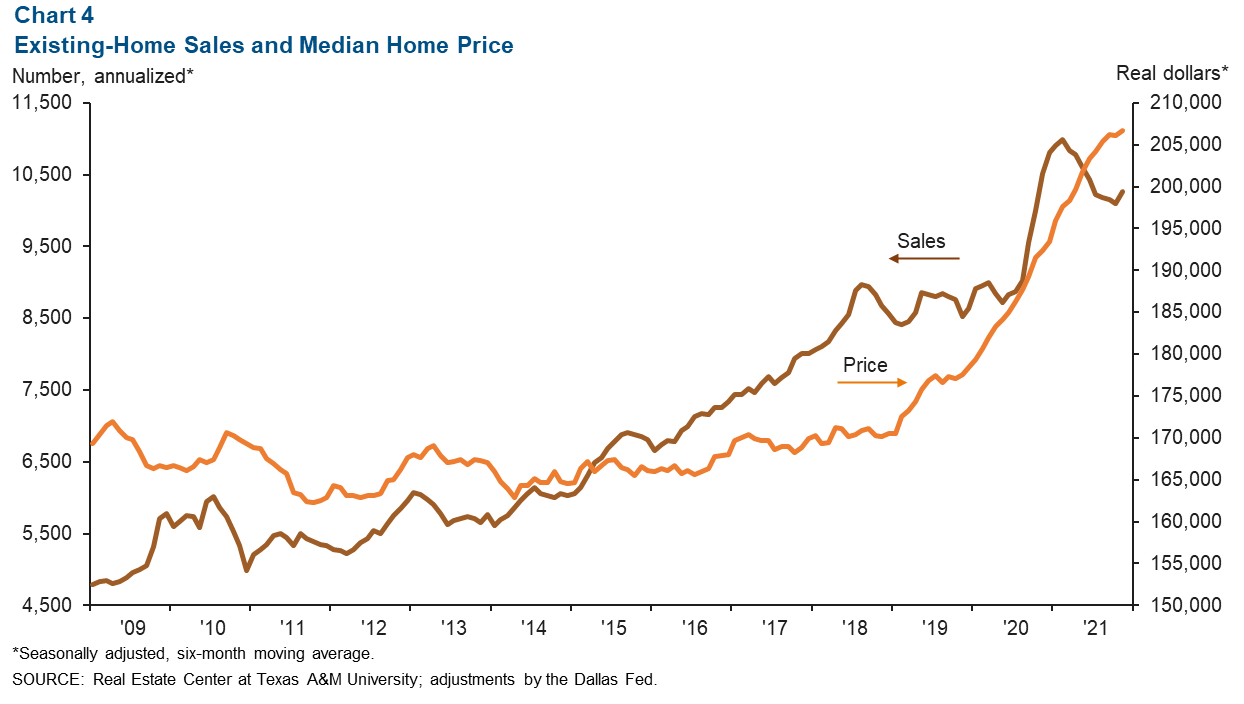
El Paso’s home sales totaled an annualized 10,262 in November, down 2.4 percent from a year ago but up 1.7 percent from October (Chart 4). The inflation-adjusted median home price in El Paso (based on a six-month moving average) reached a record high of $206,637 in November and was up 7.4 percent from a year prior. Existing-home inventories totaled 1.2 months, well below the six months of supply associated with a balanced market.
Industrial Production and Maquiladora-Related Activities
The monthly U.S. industrial production (IP) index rose from 101.8 in October to 102.3 in November and was up 5.3 percent from a year ago (Chart 5). Mexico’s IP index rose from 97.8 in September to 98.4 in October and was 1.6 percent higher than a year ago. The Institute for Supply Management (ISM) manufacturing index rose from October’s 60.8 percent to 61.1 in November and was up 3.4 percentage points from a year ago. Comments from ISM panelists continued to indicate that long raw-material lead times, material shortages, rising commodities prices, transportation issues, overseas supply-chain problems, port congestion, worker absenteeism and hiring difficulties were hurdles to meeting increased demand. However, slight improvements in labor availability and supplier delivery were also noted.
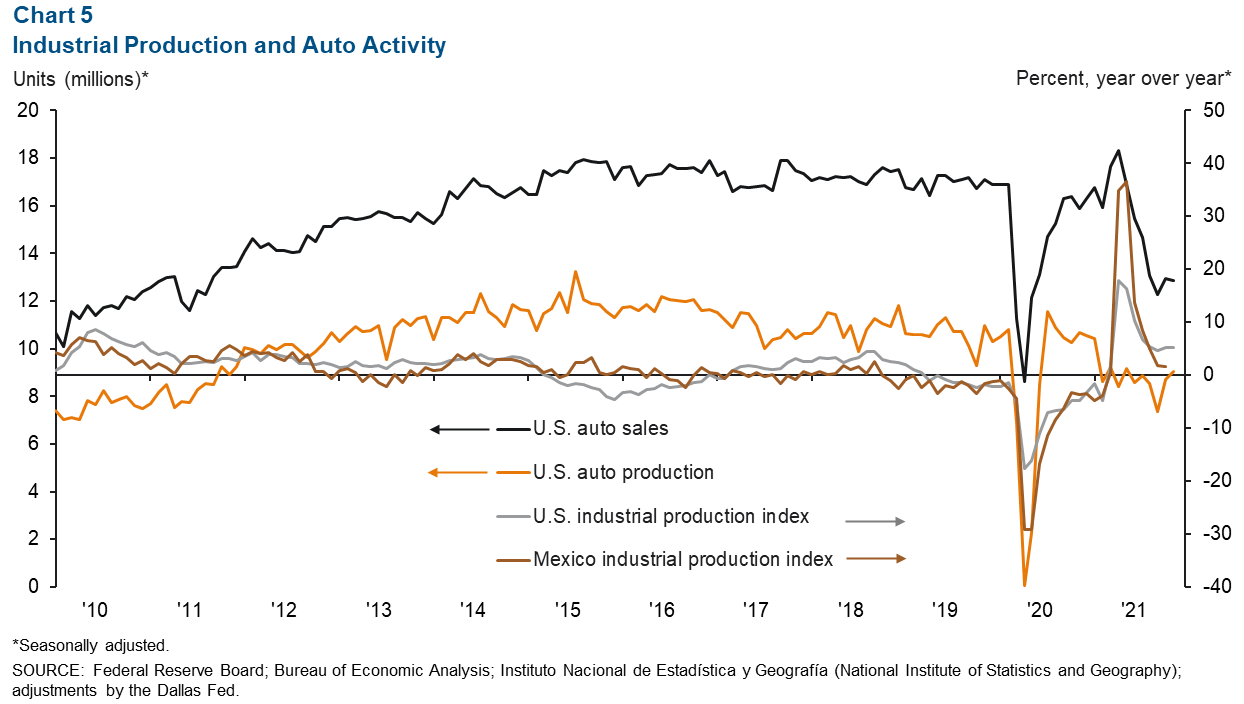
U.S. auto and light-truck production rose from 8.7 million units in October to 9.1 million units in November. Monthly auto sales fell slightly from 13.0 million in October to 12.9 million in November. Industrial and auto activity are closely linked to the El Paso-area economy because of cross-border manufacturing relationships. Roughly half of maquiladoras in Juárez are auto related.
NOTE: Data may not match previously published numbers due to revisions. The El Paso metropolitan statistical area includes El Paso and Hudspeth counties.
About El Paso Economic Indicators
Questions can be addressed to Keighton Hines at keighton.hines@dal.frb.org. El Paso Economic Indicators is published every month after state and metro employment data are released.