El Paso Economic Indicators

April 20, 2022
El Paso’s economic expansion continued in March. The business-cycle index rose. Employment contracted; however, the unemployment rate declined. Trade volumes rose, and cross-border traffic continued to recover. Industrial production and manufacturing activity continued to expand.
Business-cycle index
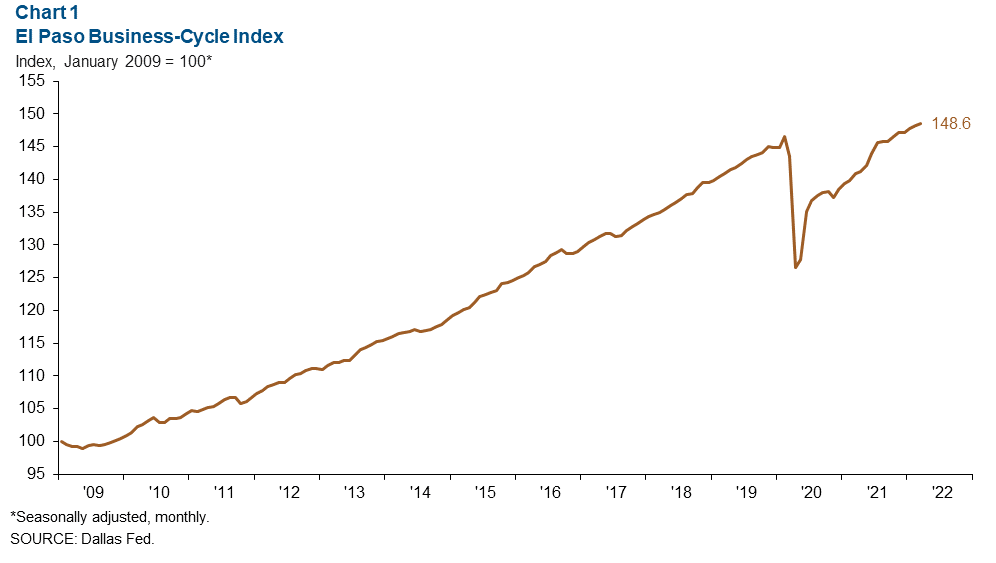
The El Paso Business-Cycle Index rose an annualized 3.0 percent in March after expanding 3.6 percent in February (Chart 1). Compared with March 2021, the index is up 5.5 percent.
Labor market
Payrolls post losses
In March, payroll employment in the metro fell an annualized 0.7 percent, or by 190 jobs (Chart 2). Employment rose in the professional and business services (400 jobs), government (220), manufacturing (100), education and health services (100), and leisure and hospitality (50) sectors. Offsetting these gains were job losses in trade, transportation and utilities (-900 jobs), and construction and mining (-190).
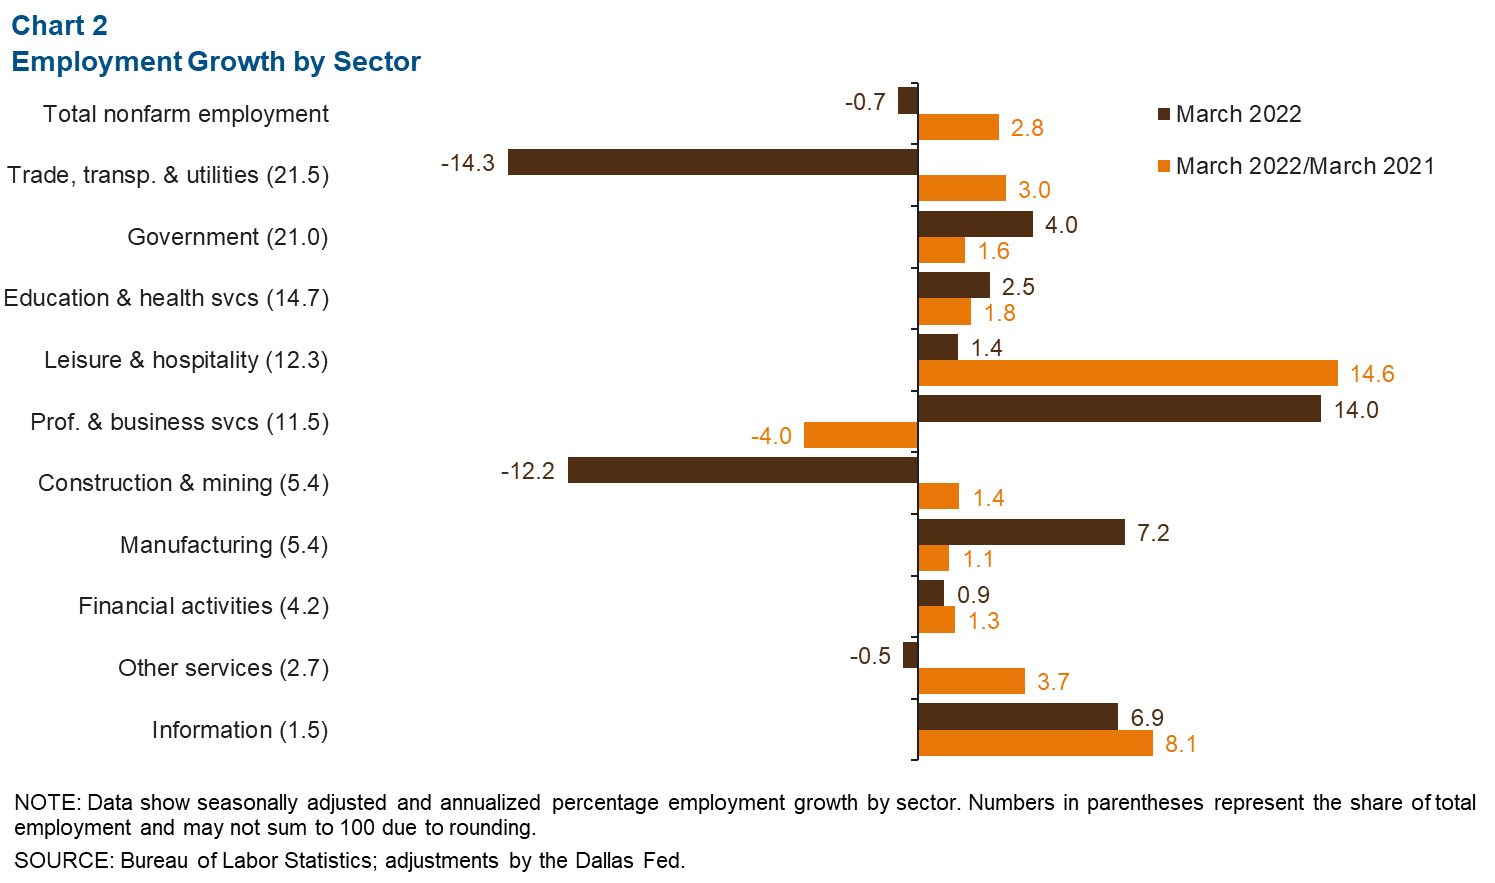
Compared with the year prior, metro employment is up 2.8 percent, a net addition of 8,770 jobs. Payroll gains were broad based, with major increases seen in leisure and hospitality (5,050 jobs), trade, transportation and utilities (2,050), government (1,070), and education and health services (850). Meanwhile, professional and business services was the only sector with employment below March 2021 levels—down 1,530 positions.
El Paso’s unemployment rate fell from 5.1 percent to 4.5 percent in March, its lowest level since February 2020. The Texas and U.S. figures dipped to 4.4 percent and 3.6 percent, respectively, in March.
International bridge traffic volumes
Northbound crossings continue to climb
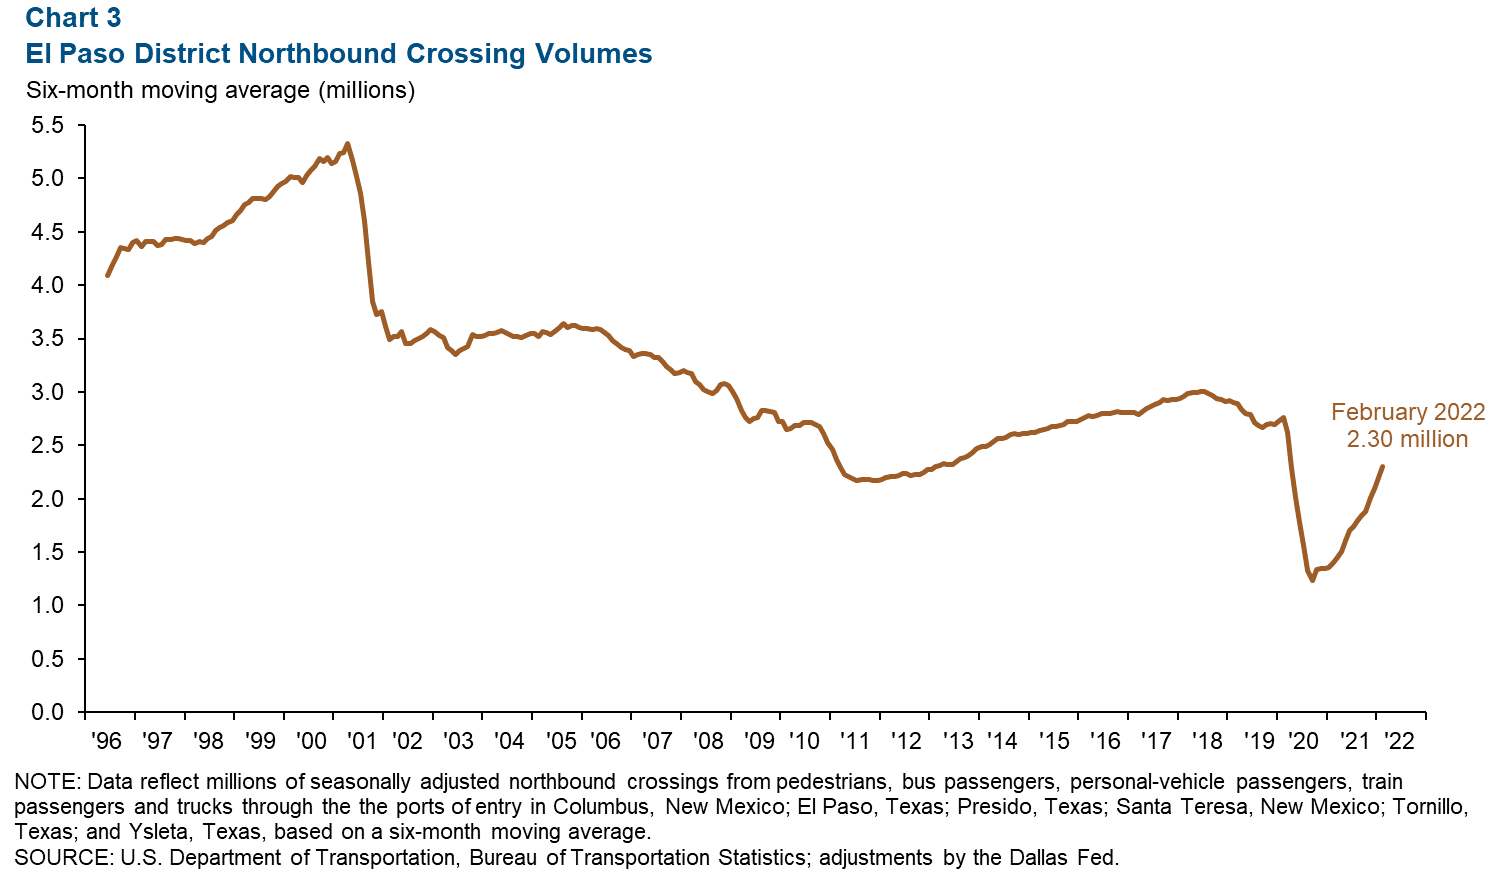
With the reopening of the U.S.–Mexico border to nonessential travelers, cross-border traffic continues to recover. According to the latest figures, the six-month moving average of El Paso District northbound crossings reached 2.3 million in February 2022, 4.8 percent above the previous month and 65.7 percent above a year ago (Chart 3). However, traffic has not fully recovered to prepandemic levels and was 16.6 percent below February 2020 volumes. The El Paso District is defined as ports of entry in Columbus, New Mexico; El Paso, Texas; Presidio, Texas; Santa Teresa, New Mexico; Tornillo, Texas; and Ysleta, Texas.
Southbound traffic also increases
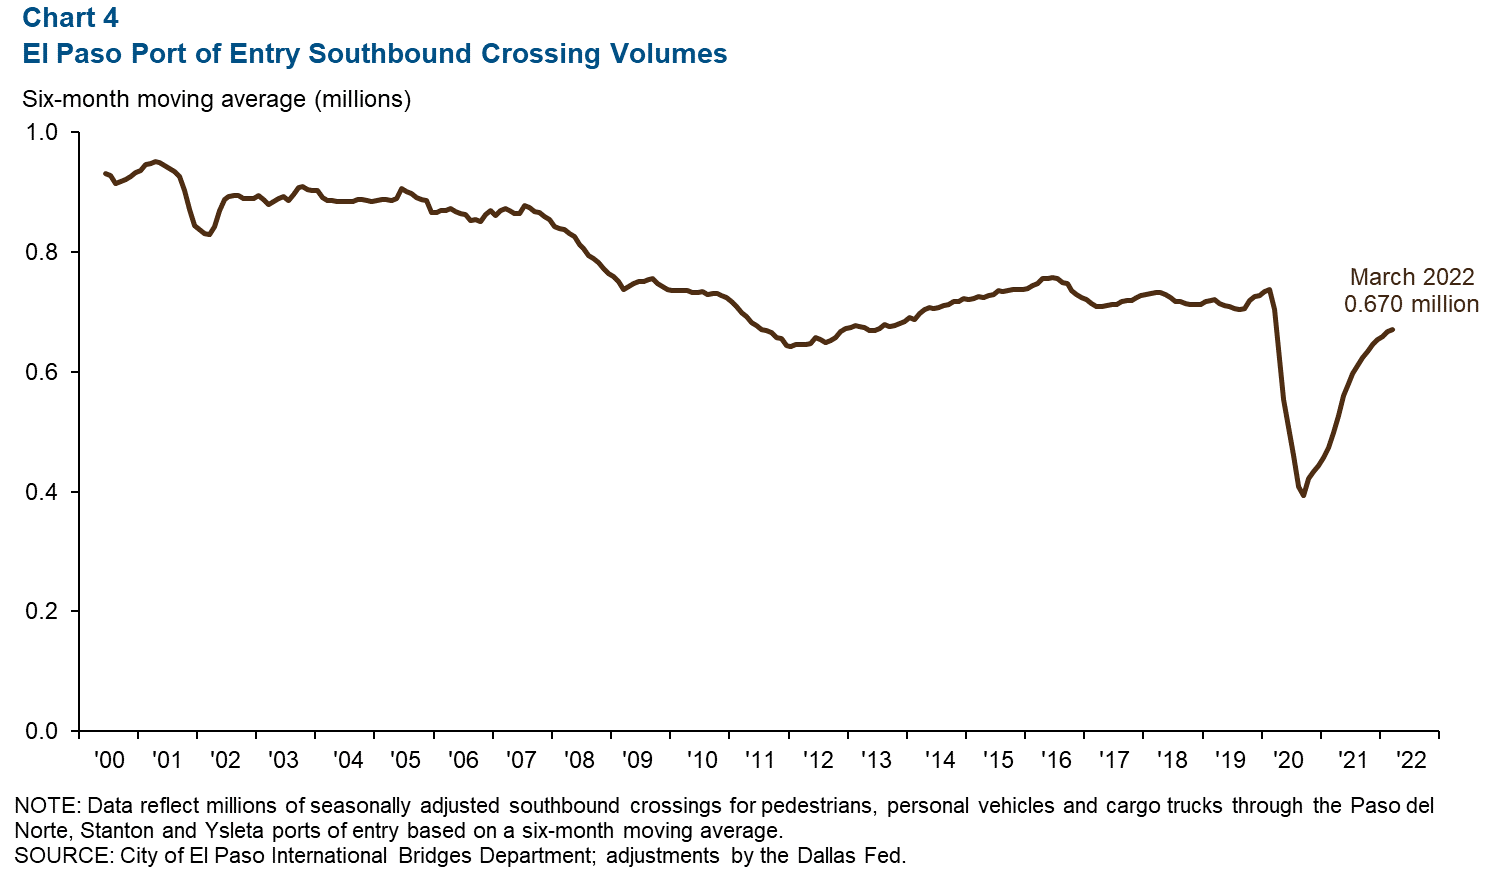
U.S. Customs and Border Protection does not collect comparable data for southbound crossings. However, the city of El Paso’s International Bridges Department compiles and publishes data on southbound bridge traffic through the Paso del Norte, Stanton and Ysleta ports of entry. The six-month moving average of southbound traffic volumes at these El Paso ports of entry in March 2022 totaled 669,998 crossings, up 0.5 percent from the previous month and 34.4 percent above the prior year (Chart 4). Southbound crossings remained 4.7 percent below March 2020 volumes.
Trade
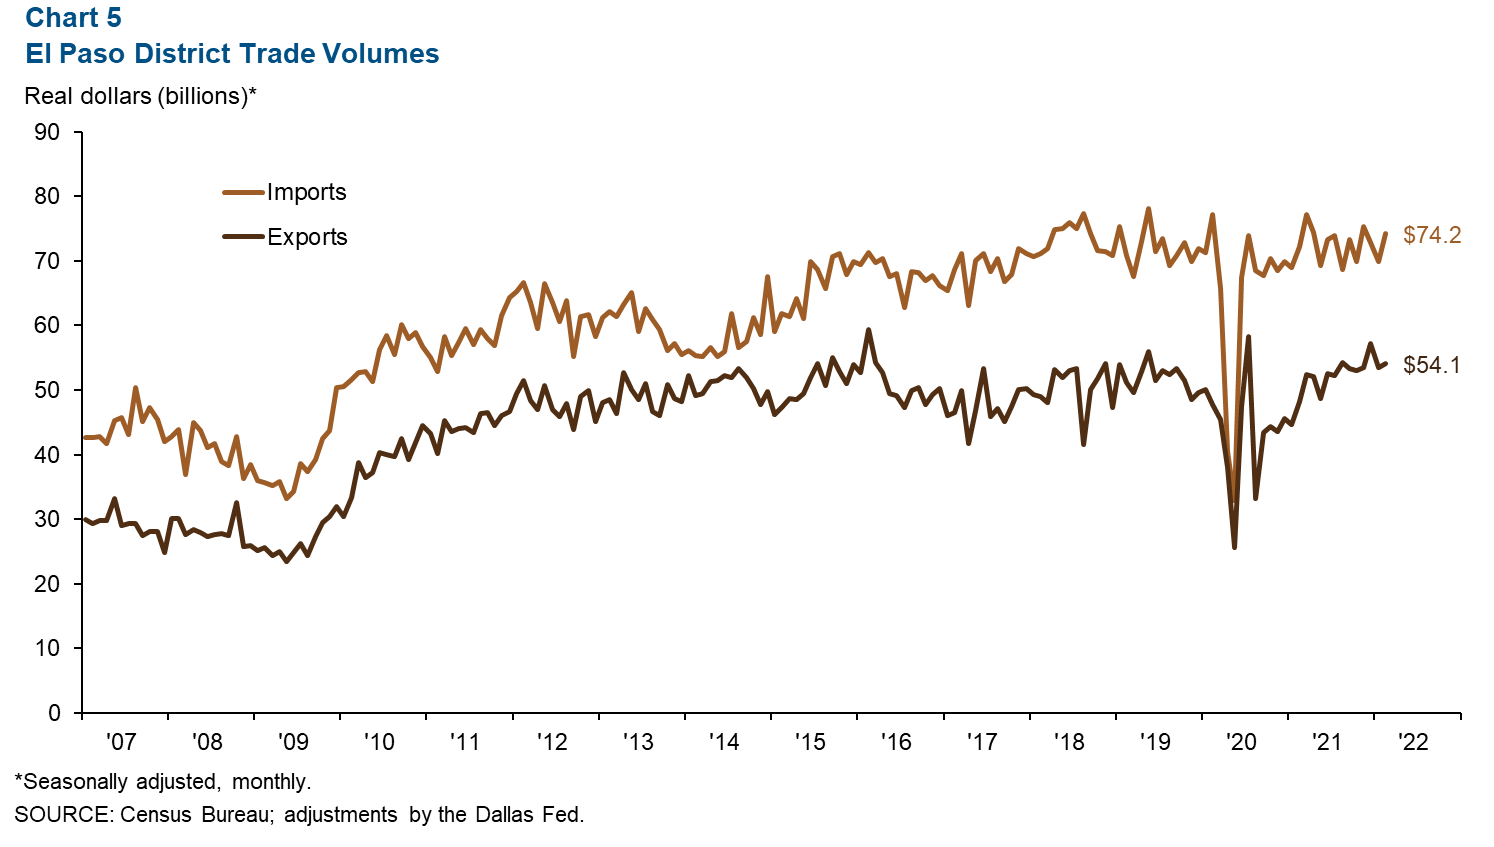
Annualized monthly trade through the El Paso Trade District rose 4.0 percent to $128.3 billion in February (Chart 5). The increase in trade was driven by import growth of 6.0 percent and export growth of 1.2 percent. On a year-over-year basis, trade rose 6.5 percent, thanks to import gains of 2.7 percent and export gains of 12.1 percent. February 2022 imports totaled $74.2 billion, and exports totaled $54.1 billion. Most trade through the El Paso Trade District came through the Ysleta Port of Entry (57 percent), while the Santa Teresa Port of Entry comprised 22 percent of total district trade volumes, and the El Paso Port of Entry made up 20 percent.
Industrial production and maquiladora-related activities
The monthly U.S. industrial production (IP) index rose from 103.6 in February to 104.6 in March and was up 5.5 percent from a year ago (Chart 6). Mexico’s IP index edged down from 101.3 in January to 100.2 in February but was 2.5 percent higher than a year ago. The Institute for Supply Management (ISM) manufacturing index fell from February’s 58.6 percent to 57.1 in March and was down 6.6 percentage points from a year ago. Despite the index reaching its lowest level since September 2020, the figure remains above 50, indicating expansion in the manufacturing sector. Comments from ISM panelists continued to indicate that raw-material shortages, extended lead times, high commodities prices, transportation difficulties, overseas supply-chain problems, worker absenteeism and labor turnover issues were hurdles to meeting strong demand. Also noted were the effects of the energy market volatility on increasing price growth. However, headway was made in the availability of labor and material.
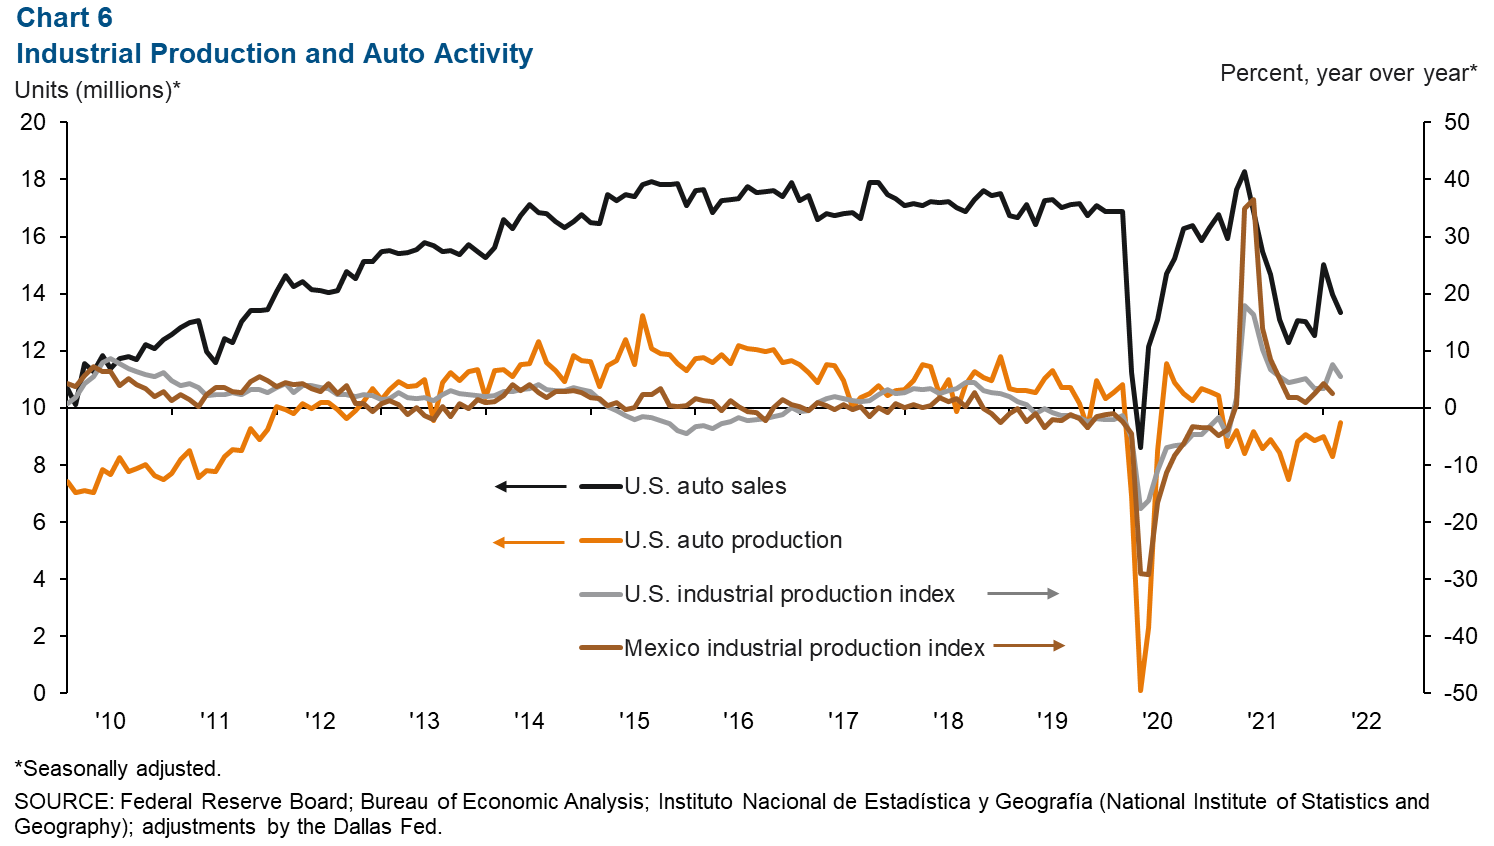
U.S. auto and light-truck production rose from 8.3 million units in February to 9.5 million units in March. Monthly auto sales fell from 14.0 million in February to 13.3 million in March. Industrial and auto activity are closely linked to the El Paso-area economy because of cross-border manufacturing relationships. Roughly half of maquiladoras in Juárez are auto related.
NOTE: Data may not match previously published numbers due to revisions. The El Paso metropolitan statistical area includes El Paso and Hudspeth counties.
About El Paso Economic Indicators
Questions can be addressed to Keighton Hines at keighton.hines@dal.frb.org. El Paso Economic Indicators is published every month after state and metro employment data are released.