El Paso Economic Indicators

December 22, 2022
| El Paso Economy Dashboard (January 2023) | |||
| Job growth (annualized) Oct. '22.–Jan. '23 |
Unemployment rate |
Avg. hourly wages |
Avg. hourly wage growth y/y |
| 3.9% | 4.6% | $23.01 | 9.2% |
In January, El Paso experienced strong payroll growth accompanied by continued increases in the business-cycle index and average hourly wages. However, unemployment rose, and U.S. industrial production increased slightly.
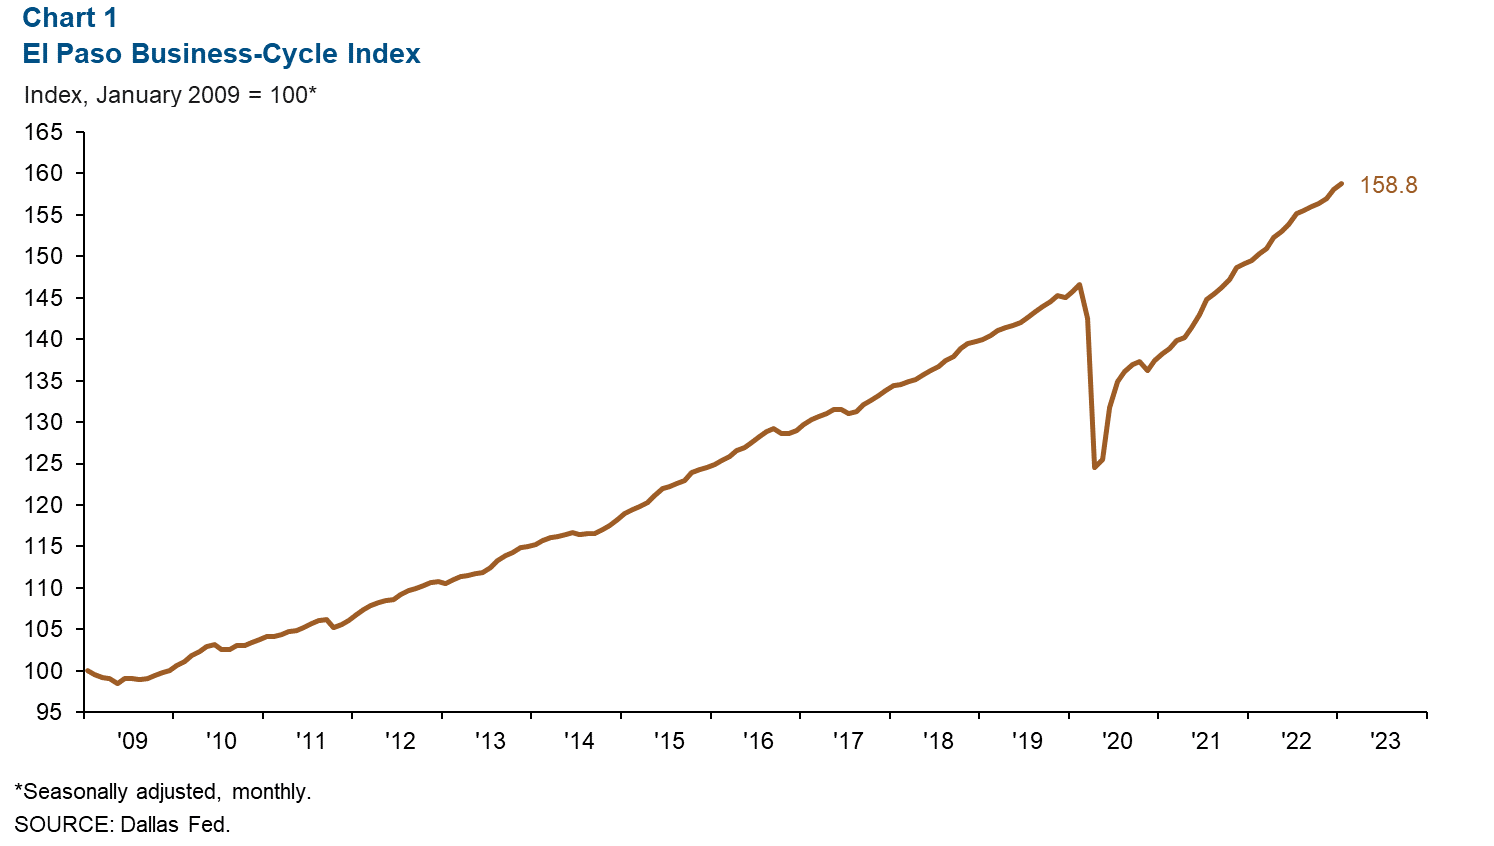
Business-cycle index
The El Paso Business-Cycle Index rose an annualized 5.4 percent in January after expanding 9.0 percent in December. It grew 6.2 percent since January 2022 (Chart 1).
Labor market
Payrolls see strong growth in January
Total nonfarm employment in El Paso grew 3.8 percent (1,049 jobs) in January, a slower pace than the 7.0 percent increase in December (Chart 2). Gains were strong in education and health services (417), leisure and hospitality (336), and government (275). Professional and business services (-260), manufacturing (-79) and information (-60) saw declines.
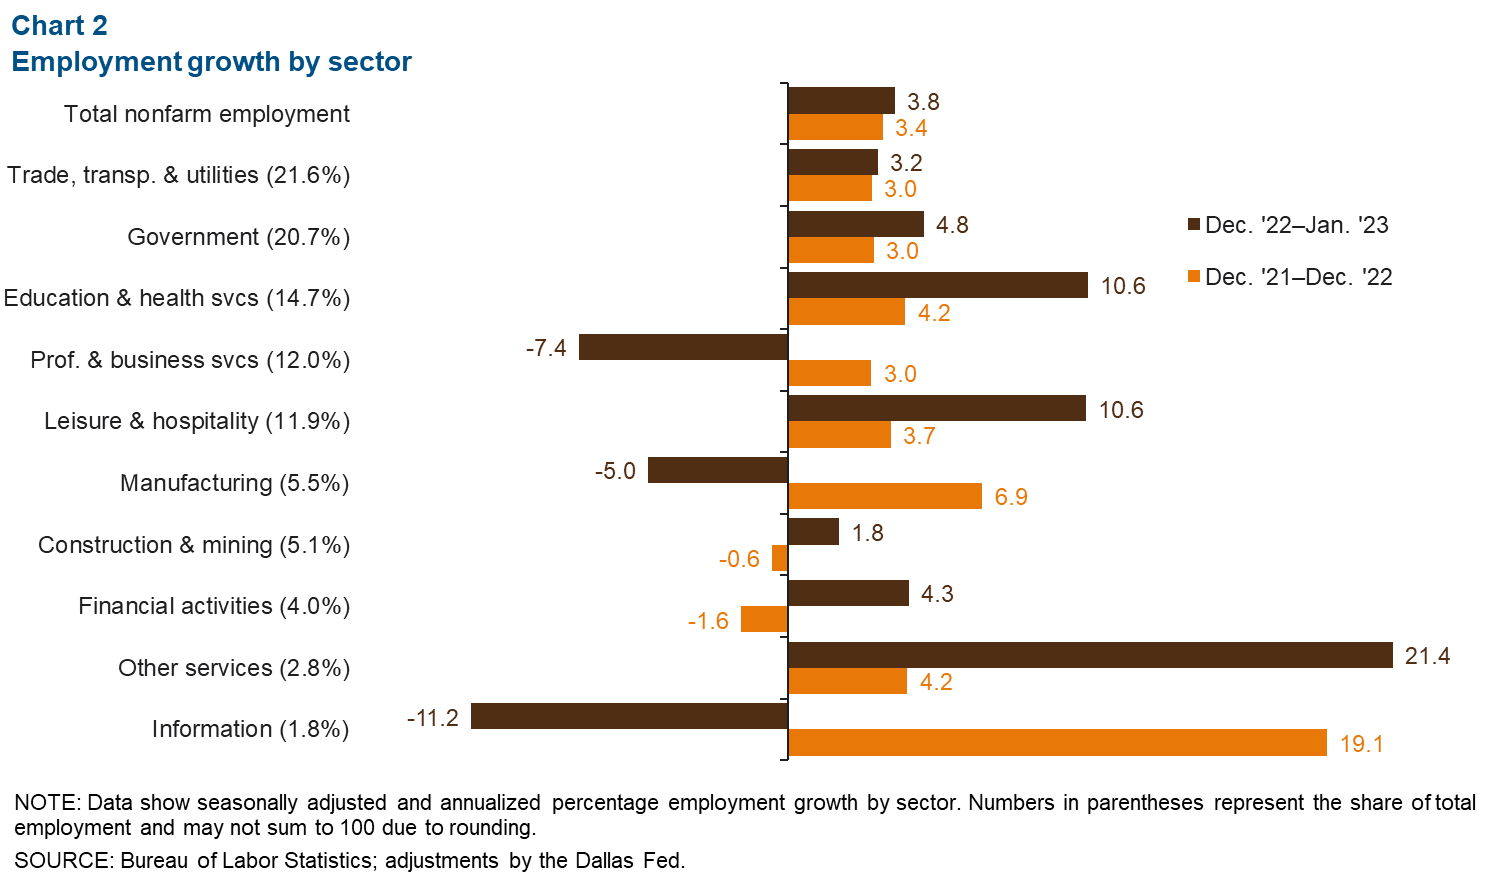
El Paso payrolls grew 3.4 percent in 2022, with widespread increases across sectors. Trade, transportation and utilities (2,109 jobs), government (2,072), and education and health services (1,973) had the largest gains.
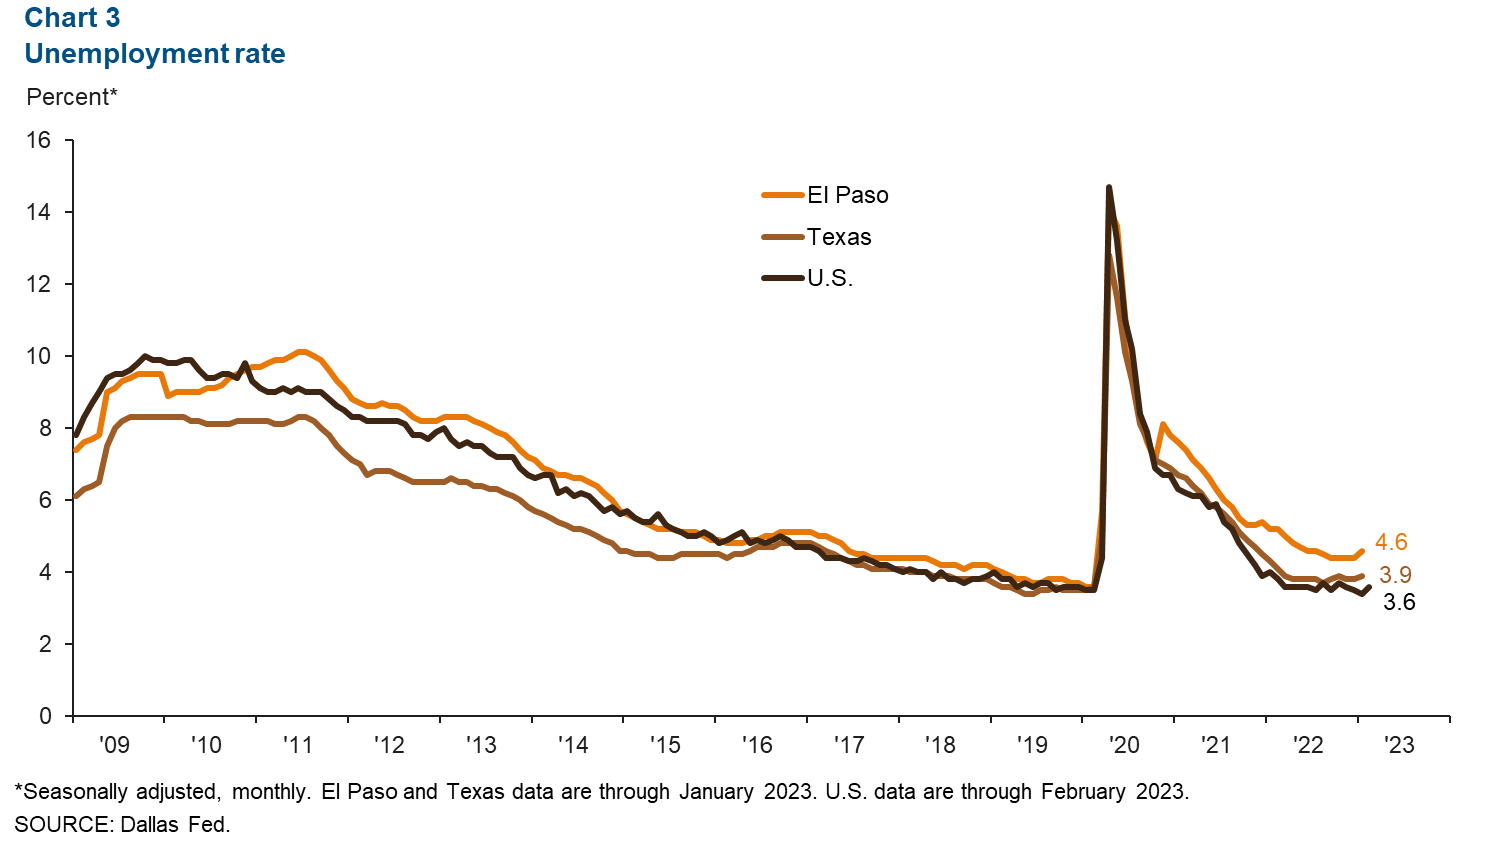
Unemployment edges up
El Paso’s unemployment rate edged up from 4.4 percent in December to 4.6 percent in January. Unemployment also increased in Texas, to 3.9 percent (Chart 3). U.S. unemployment dropped to 3.4 percent in January but ticked up to 3.6 percent in February.
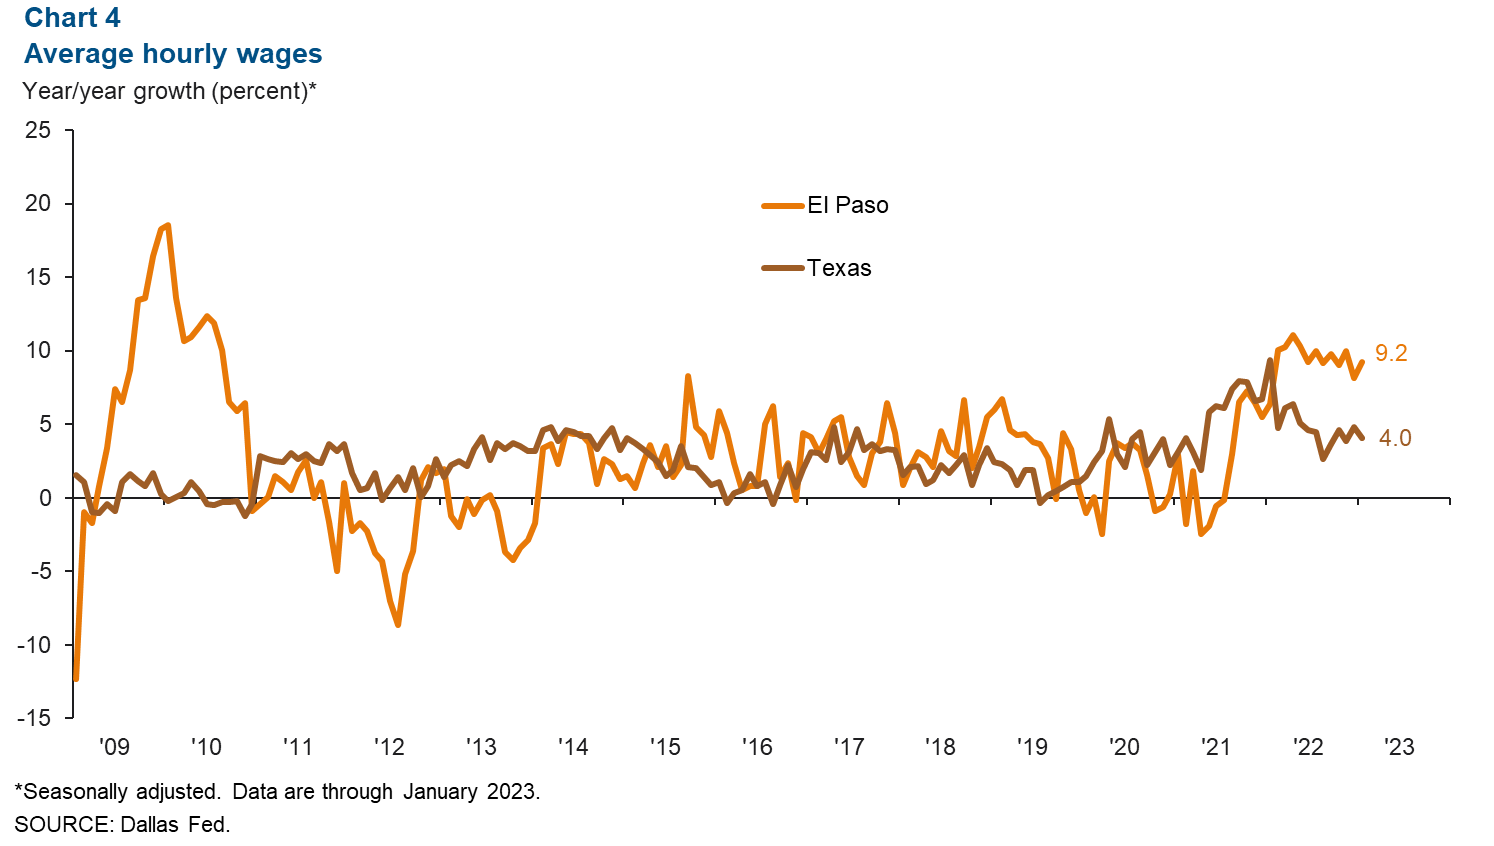
Average hourly wages
After experiencing strong wage growth in 2022, El Paso continued to experience wage increases in January (Chart 4). Average hourly wages rose to $23.01, up 9.2 percent from last January. Meanwhile, Texas’ average hourly wages increased to $31.14, a 4.0 percent increase from last year.
Industrial production and maquiladora-related activities
Both the monthly U.S. industrial production (IP) index and Mexico’s IP index were little changed in January compared with December (Chart 5). The U.S. index was 0.8 percent higher than a year ago, while Mexico’s index was up 2.5 percent. The Institute for Supply Management (ISM) manufacturing index rose 0.3 percentage points to 47.7 in January but remained below 50 for the fourth consecutive month. ISM figures below 50 indicate contraction in the manufacturing sector. The index is down 10.7 percentage points from last year.
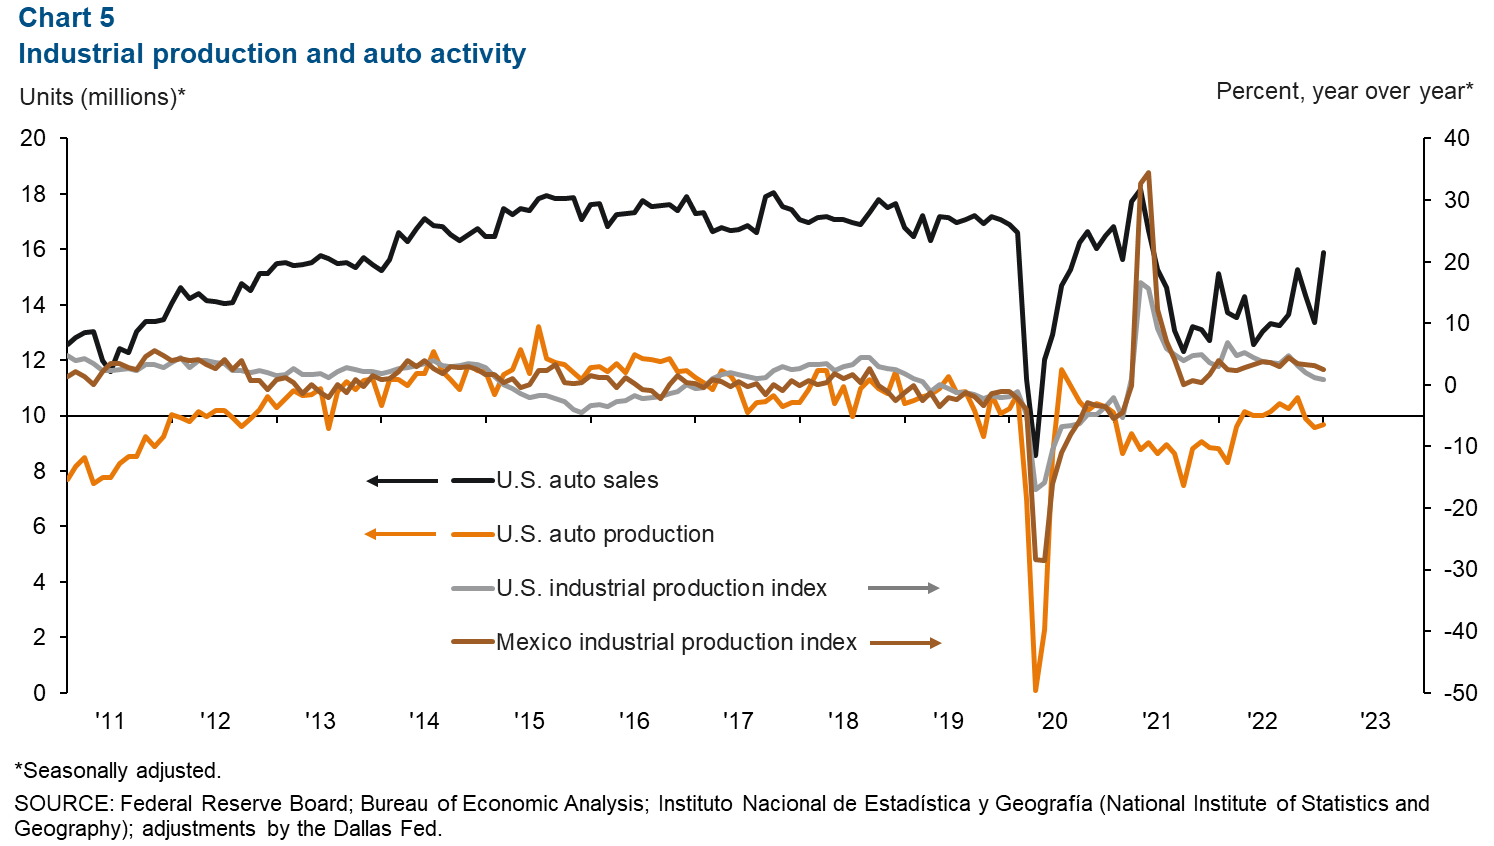
Compared with December, U.S. auto and light-truck production increased by an annualized 113,700 units in January, a 10.1 percent increase from a year ago. Auto sales declined by 989,000 units in February compared with January but increased 8.5 percent from last February. Industrial and auto activity are closely linked to the El Paso-area economy because of cross-border manufacturing relationships. Roughly half of maquiladoras in Juárez are auto related.
NOTE: Data may not match previously published numbers due to revisions. The El Paso metropolitan statistical area includes El Paso and Hudspeth counties.
About El Paso Economic Indicators
Questions or suggestions can be addressed to Aparna Jayashankar at Aparna.Jayashankar@dal.frb.org. El Paso Economic Indicators is published every month after state and metro employment data are released.