El Paso Economic Indicators

| El Paso economy dashboard (September 2023) | |||
| Job growth (annualized) June–Sept. '23 |
Unemployment rate |
Avg. hourly earnings |
Avg. hourly earnings growth y/y |
| -1.1% | 4.4% | $23.29 | 3.0% |
El Paso's employment contracted in September, and its business-cycle index was flat. However, the unemployment rate fell. Trade volumes cooled from the previous year. Both U.S. auto production and sales rose.
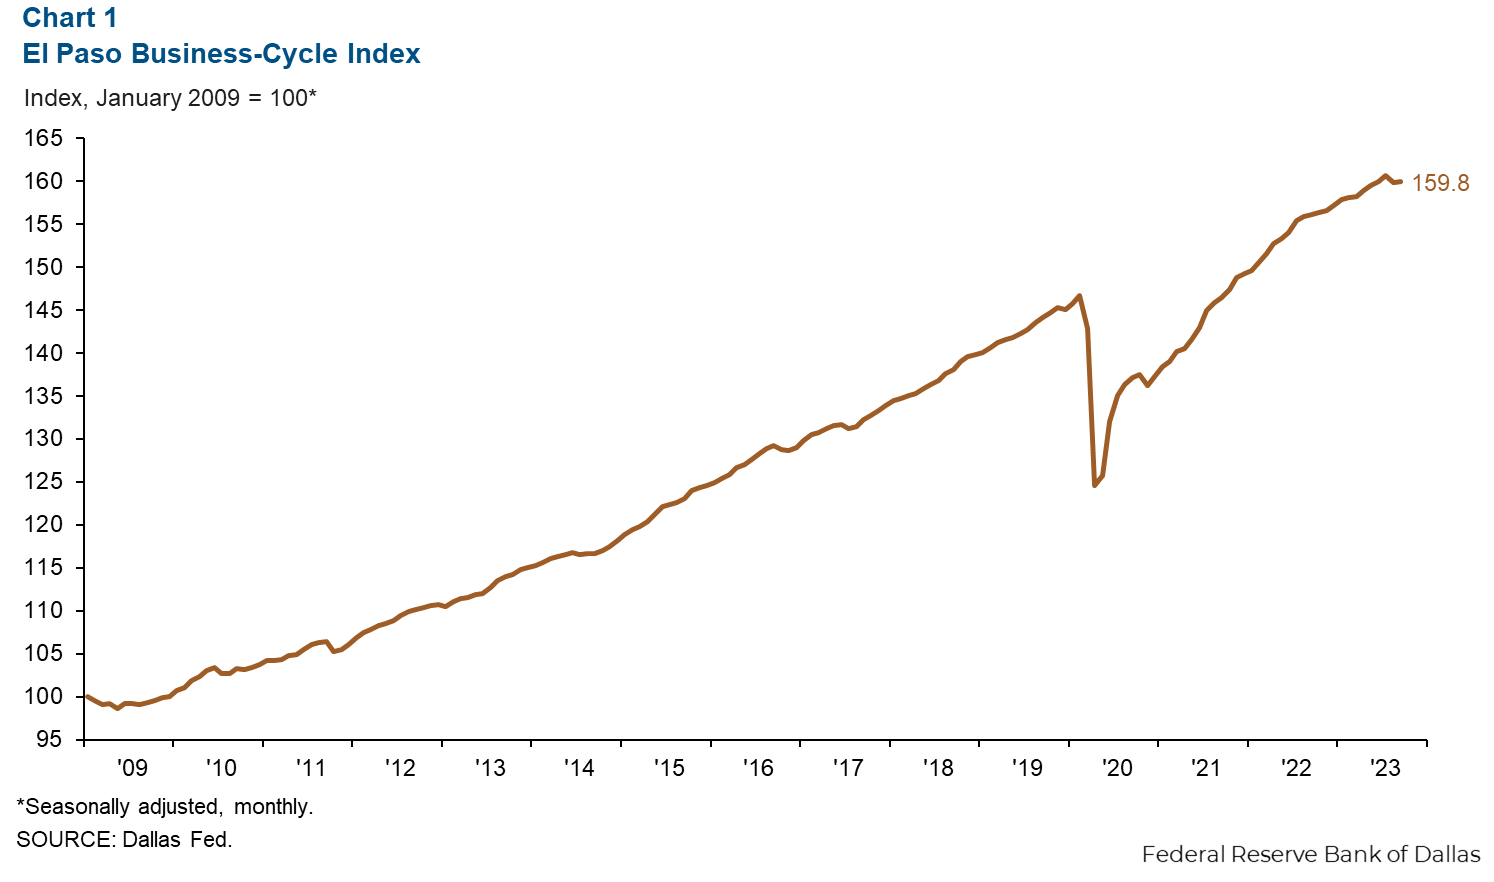
Business-cycle index
In September, El Paso’s business-cycle index remained flat at 159.8 from August (Chart 1). The index was up 2.4 percent from last year.
Labor market
Payrolls continue to contract
Employment fell an annualized 1.7 percent in September (474 jobs), and the largest five sectors lost jobs (Chart 2). Losses were greatest in professional and business services (232), government (166), and leisure and hospitality (120). Meanwhile, other services (62) and construction and mining (51) gained the most jobs.
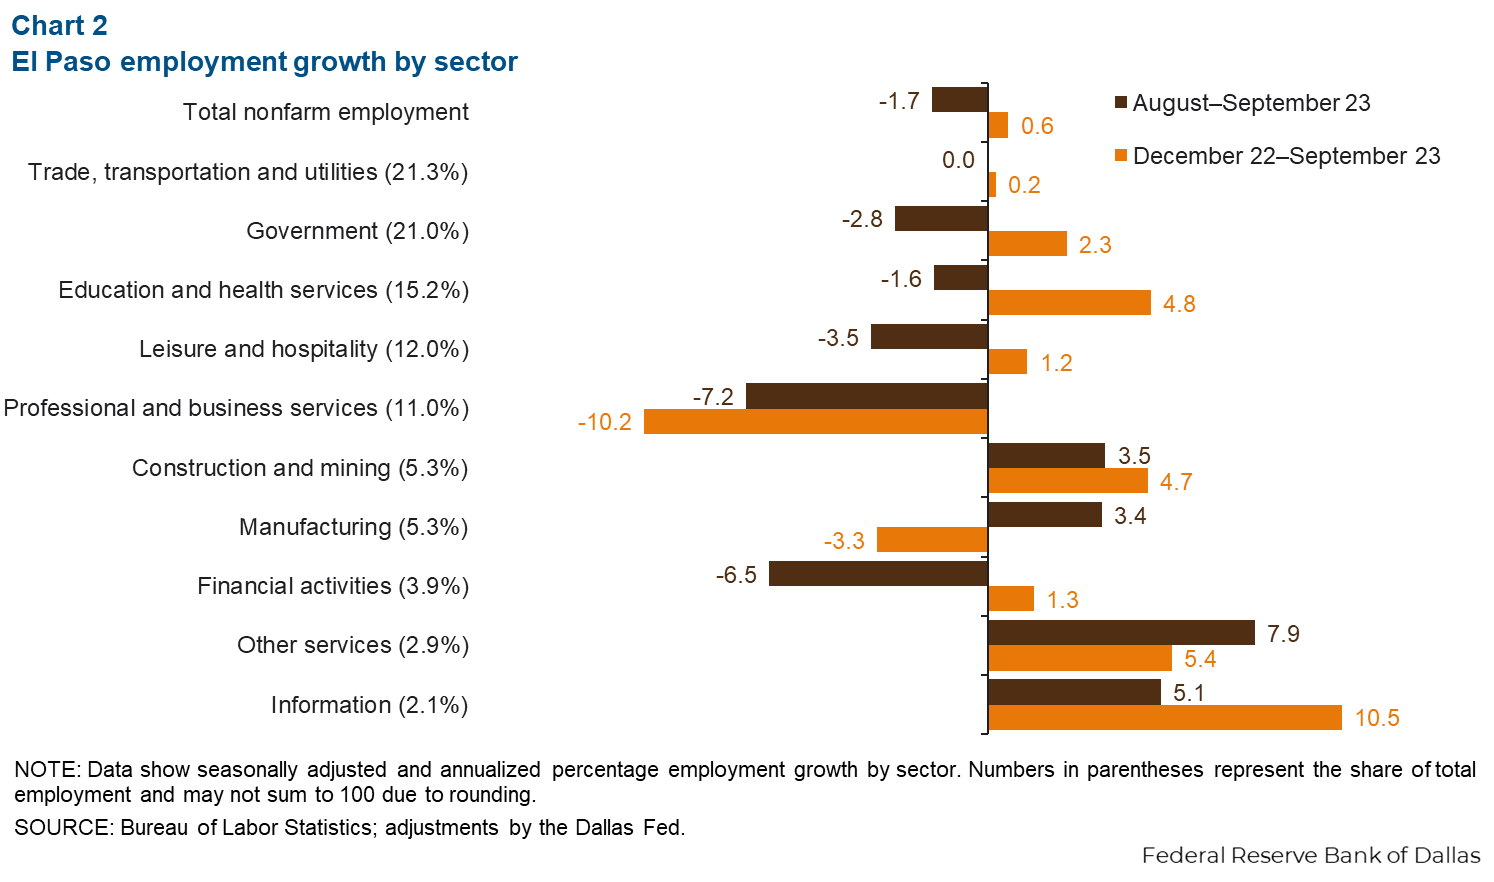
Total nonfarm employment has expanded 0.6 percent year to date (1,509 jobs). Education and health services (1,777) and government (1,217) added the most jobs on net. The only sectors to lose jobs were professional and business services (3,129) and manufacturing (455). Meanwhile, employment has grown 3.6 percent in Texas year to date and 2.0 percent in the nation.
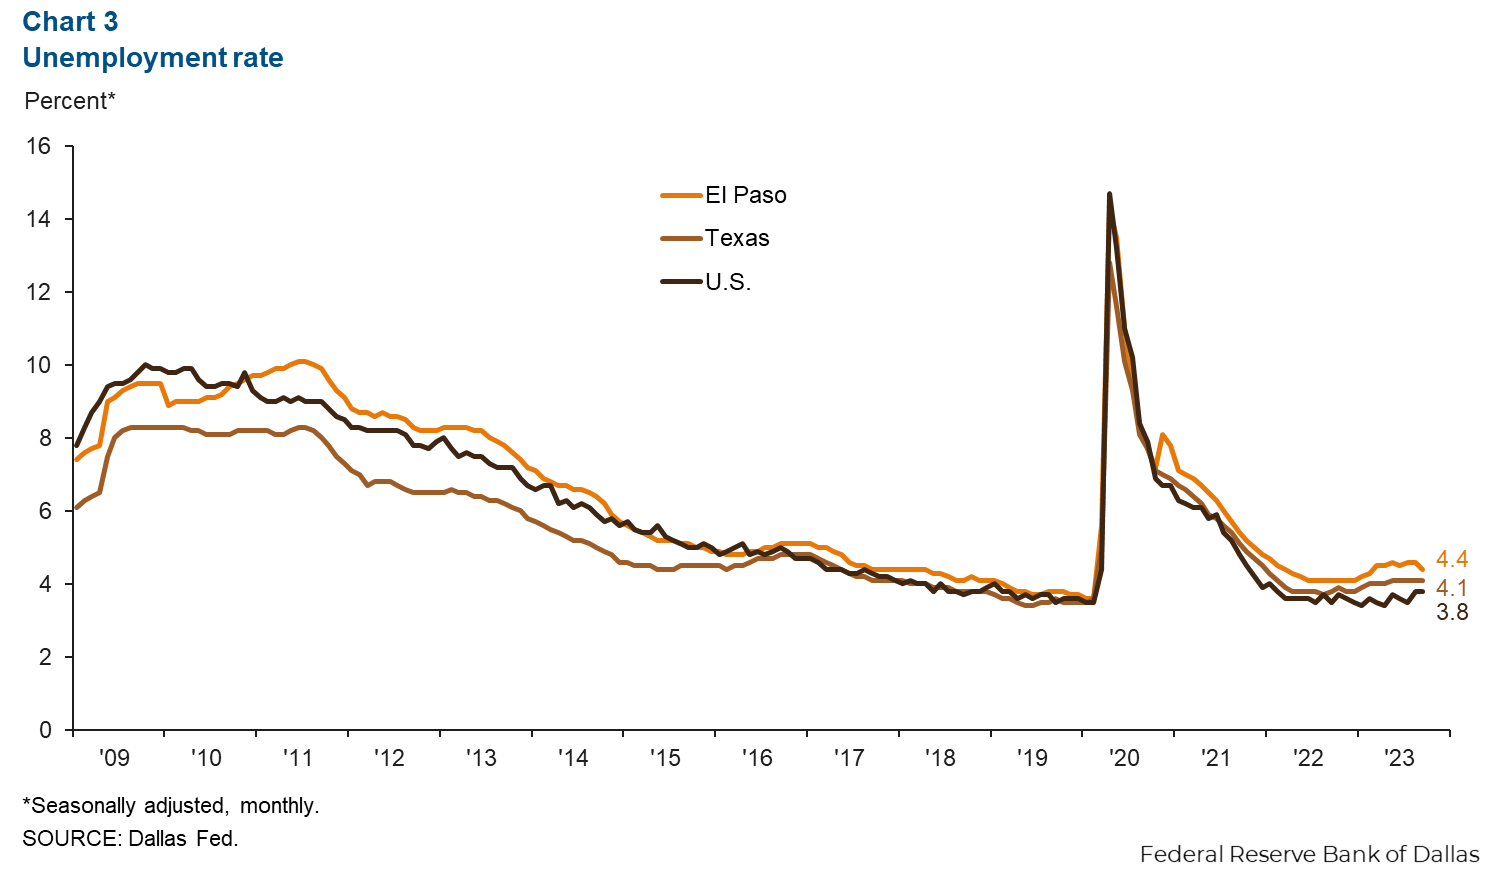
Unemployment rate falls
El Paso’s unemployment rate fell from 4.6 percent in August to 4.4 percent in September (Chart 3). September unemployment was 4.1 percent in Texas and 3.8 percent in the nation.
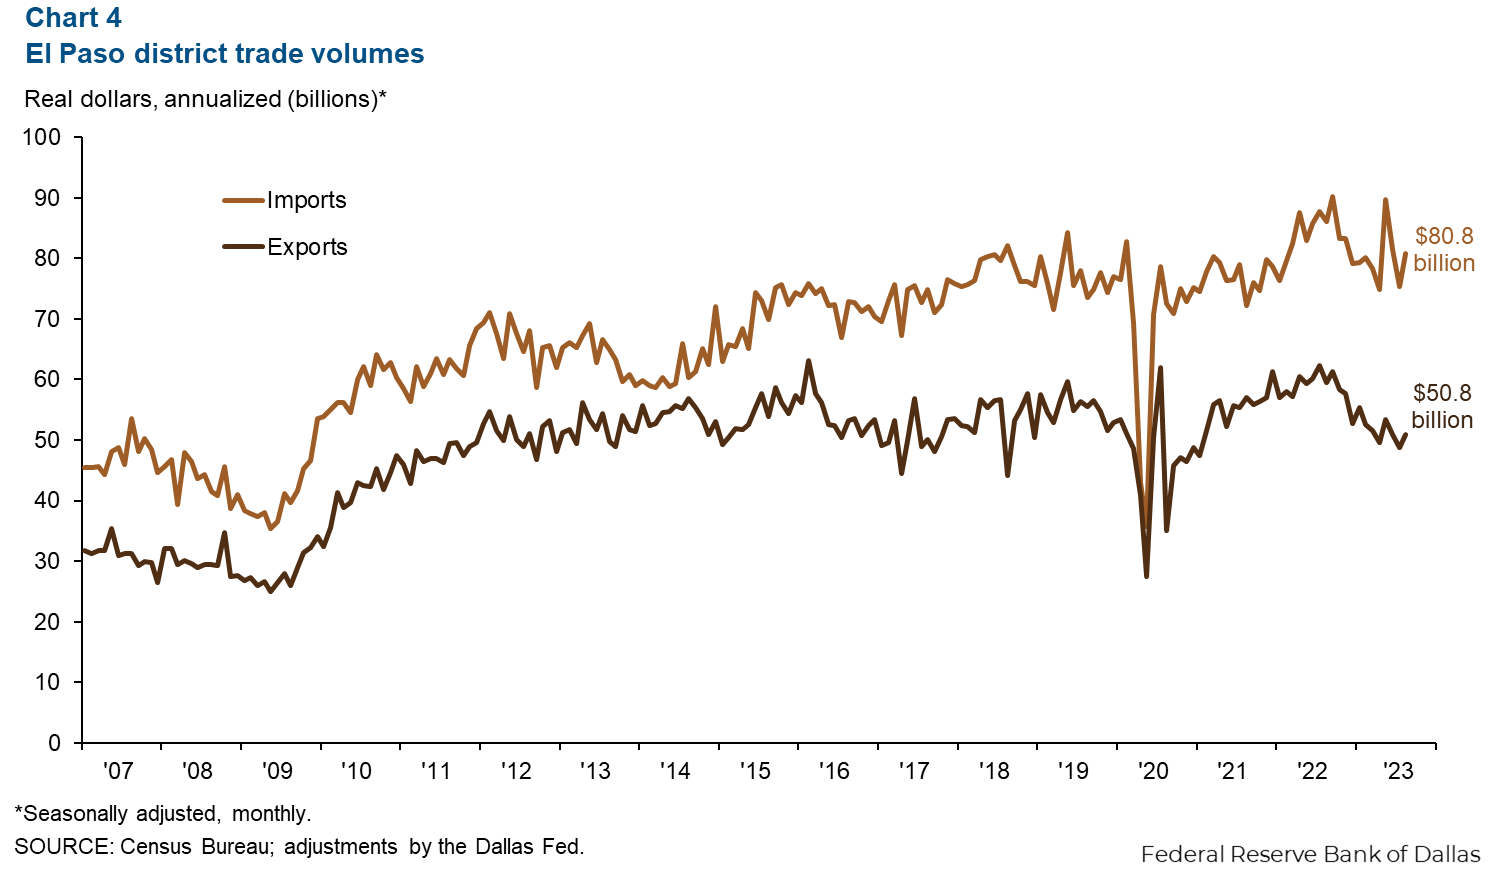
Trade volume
Trade volume in the U.S. Census Bureau’s El Paso district was down 9.6 percent in August ($131.6 billion annualized) from August 2022 (Chart 4). Exports ($50.8 billion annualized) fell 14.5 percent from the previous year, while imports ($80.8 billion annualized) fell 6.2 percent. Trade primarily flowed through the ports of Ysleta (61 percent), Santa Teresa (20 percent) and El Paso (19 percent).
Industrial production and maquiladora-related activities
The monthly U.S. industrial production index rose 0.3 percent in September and was up 0.1 percent from the previous year (Chart 5). The Institute for Supply Management (ISM) manufacturing index increased 1.4 points in September to 49 but was down 2 points from a year ago. ISM indexes below 50 signal contraction in the manufacturing sector. Meanwhile, Mexico’s IP index grew 0.3 percent in August and was up 5.0 percent from August 2022.
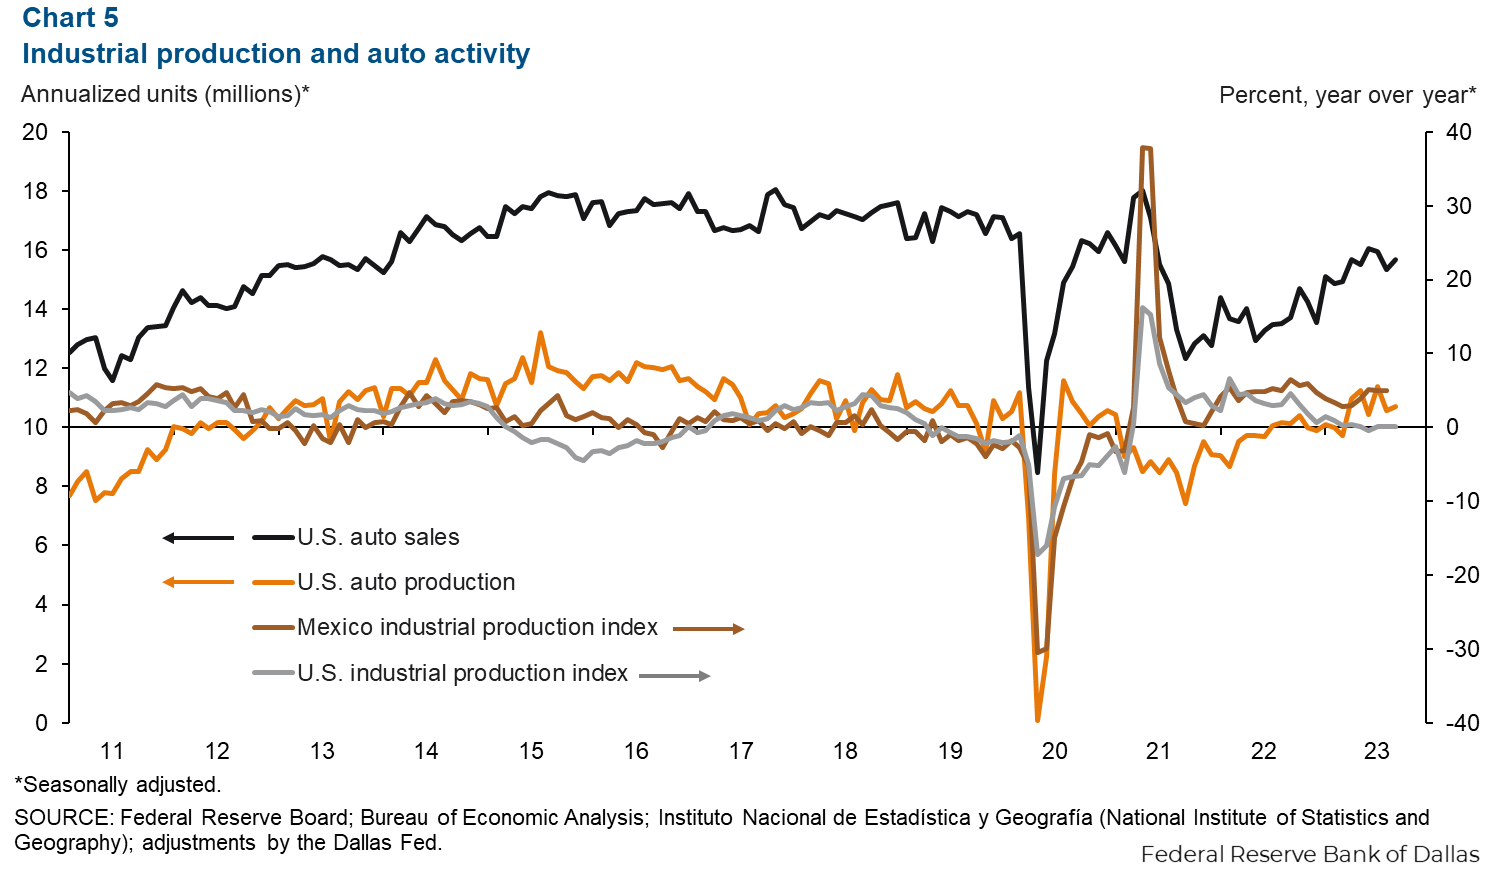
U.S. monthly auto production increased by an annualized 154,800 units in September, and sales grew by an annualized 323,000 units. Production has expanded 5.7 percent since September 2022, while sales have increased 14.3 percent. Industrial and auto activity are closely linked to the El Paso-area economy because of cross-border manufacturing relationships. Roughly half of the maquiladoras in Juárez, Mexico, are auto related.
NOTE: Data may not match previously published numbers due to revisions. The El Paso metropolitan statistical area includes El Paso and Hudspeth counties.
About El Paso Economic Indicators
Questions or suggestions can be addressed to Aparna Jayashankar at Aparna.Jayashankar@dal.frb.org. El Paso Economic Indicators is published every month after state and metro employment data are released.