El Paso Economic Indicators

| El Paso economy dashboard (October 2023) | |||
| Job growth (annualized) July–Oct. '23 |
Unemployment rate |
Avg. hourly earnings |
Avg. hourly earnings growth y/y |
| -2.2% | 4.5% | $23.54 | 4.2% |
El Paso employment declined from July to October. The business-cycle index increased slightly, and the unemployment rate fell. In addition, wage growth stabilized. The U.S. industrial production index decreased, and both auto production and sales dropped.
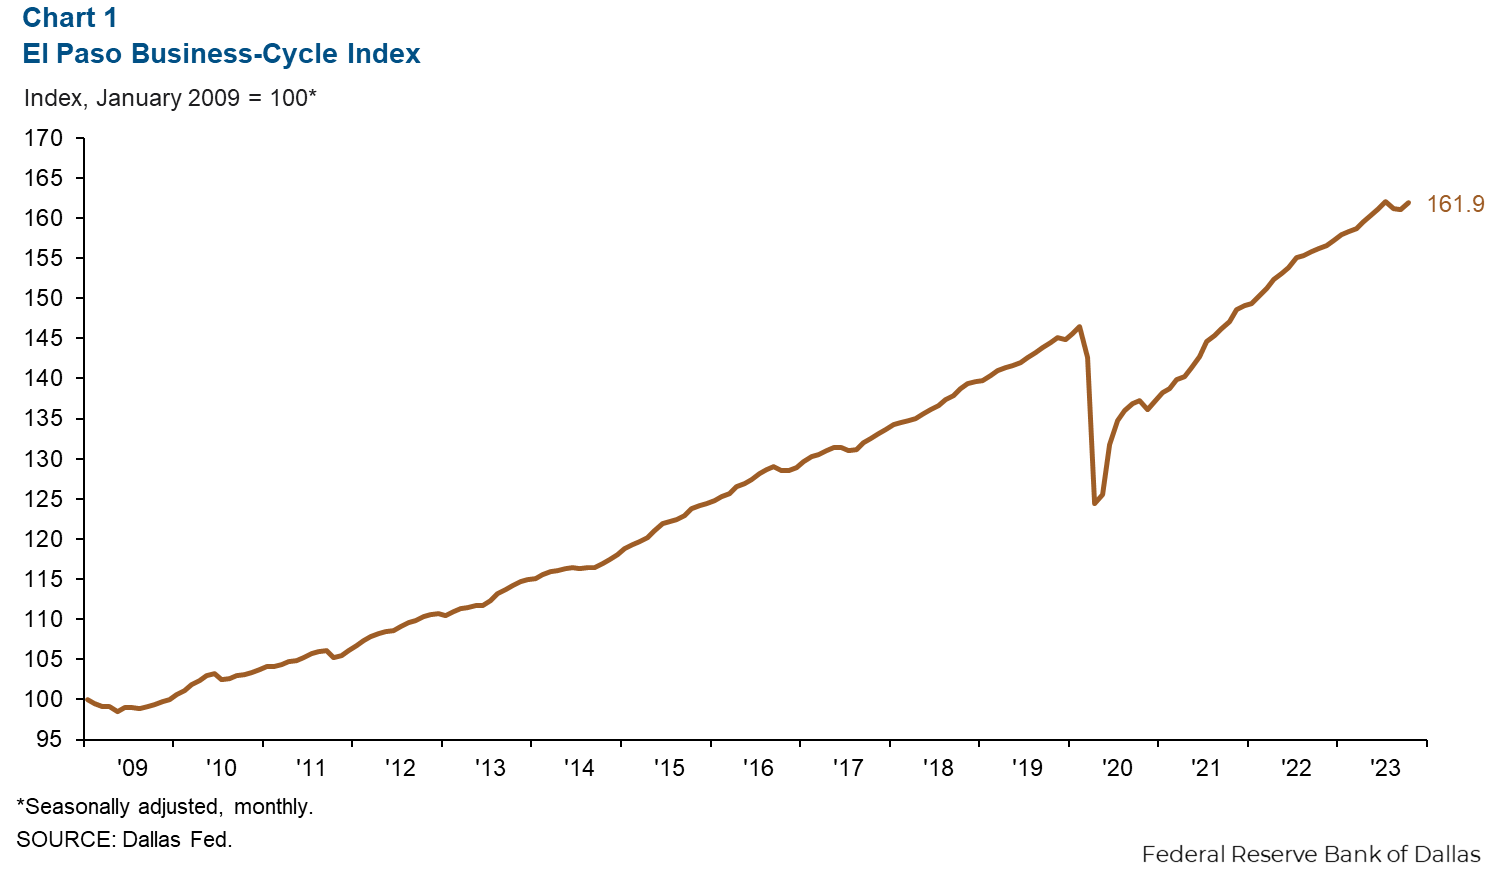
Business-cycle index
El Paso’s business-cycle index edged up 0.9 points from September to October (Chart 1). The index was up 3.7 percent from last October.
Labor market
Payrolls contract
El Paso employment contracted an annualized 2.2 percent (-1,920 jobs) from July to October (Chart 2). Losses were greatest in professional and business services (-1,168), government (-918), and leisure and hospitality (-355). Construction and mining (362) and trade, transportation and utilities (145) gained the most jobs.
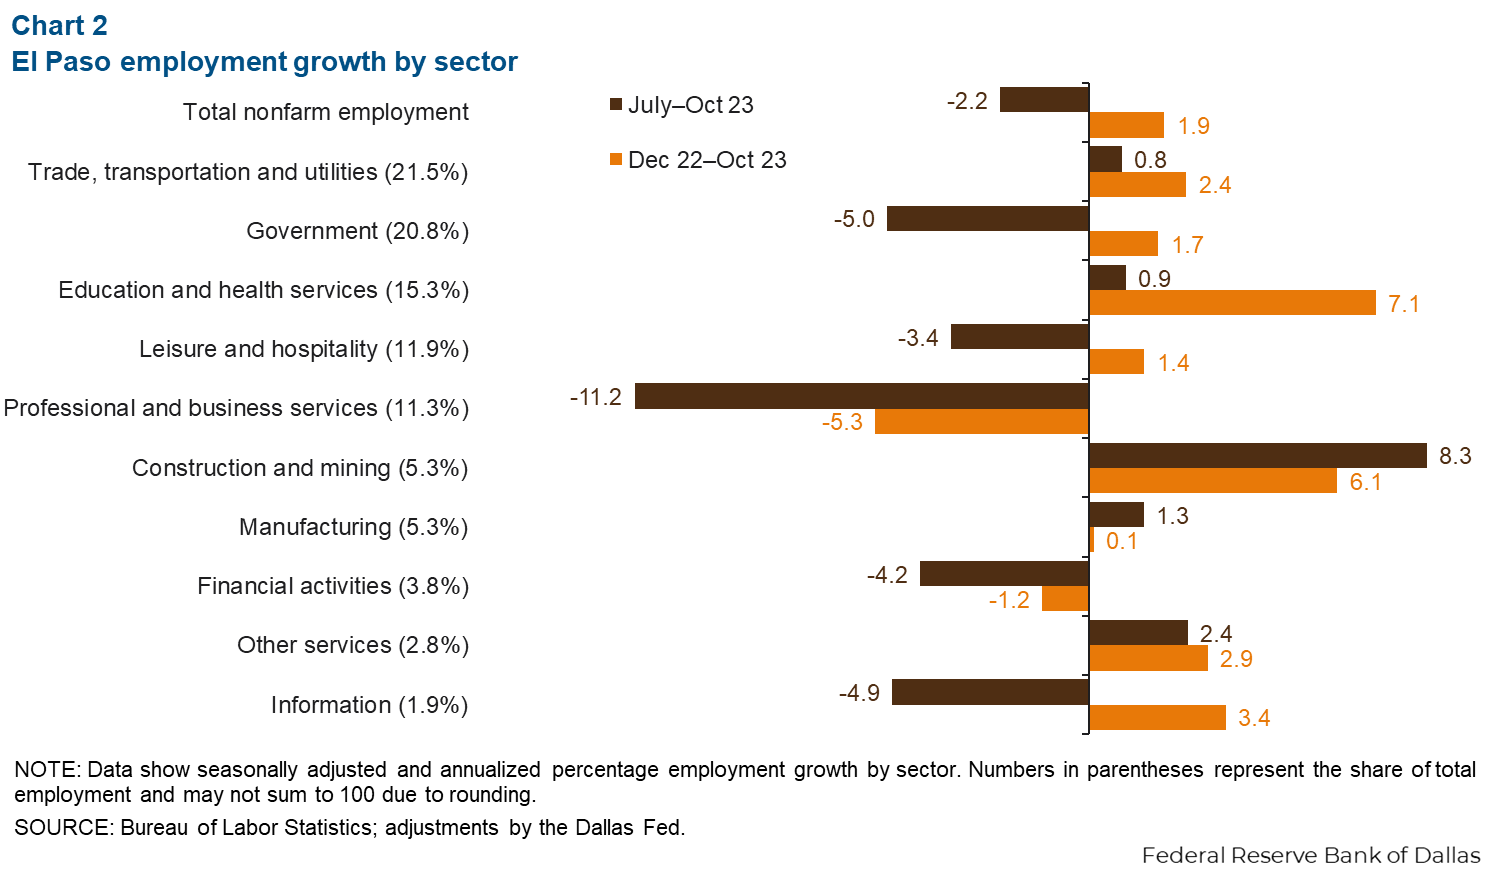
Total nonfarm employment has expanded 1.9 percent year to date (5,185 jobs). Education and health services added the most jobs on net (2,906), followed by trade, transportation and utilities (1,436) and government (994). Professional business services contracted the most (-1,792).
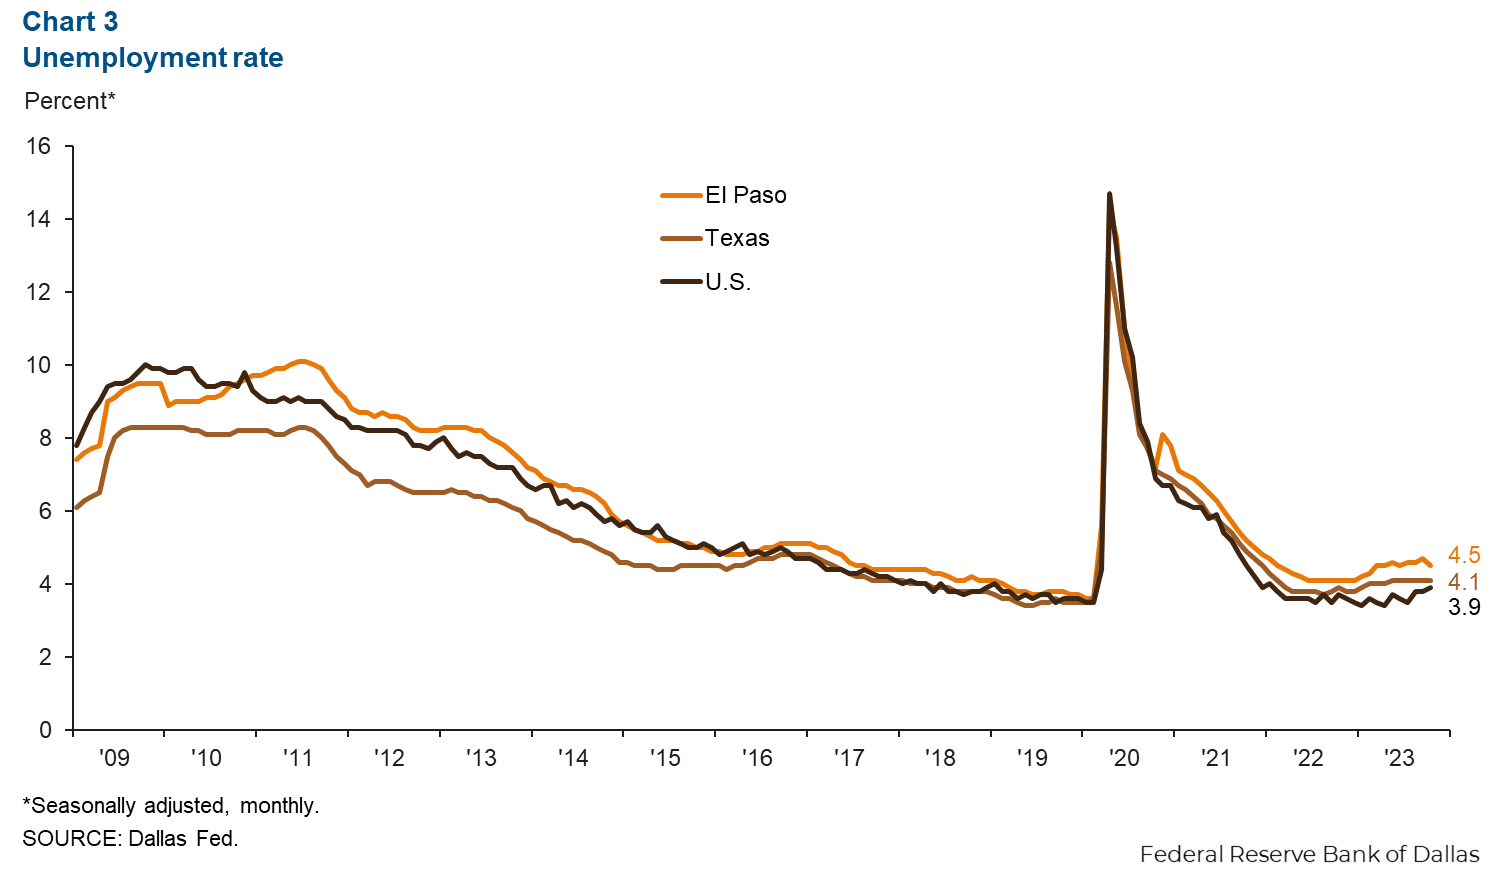
Unemployment rate declines
El Paso’s unemployment rate fell to 4.5 percent in October from 4.7 percent in September (Chart 3). October unemployment was 4.1 percent in Texas and 3.9 percent in the nation.
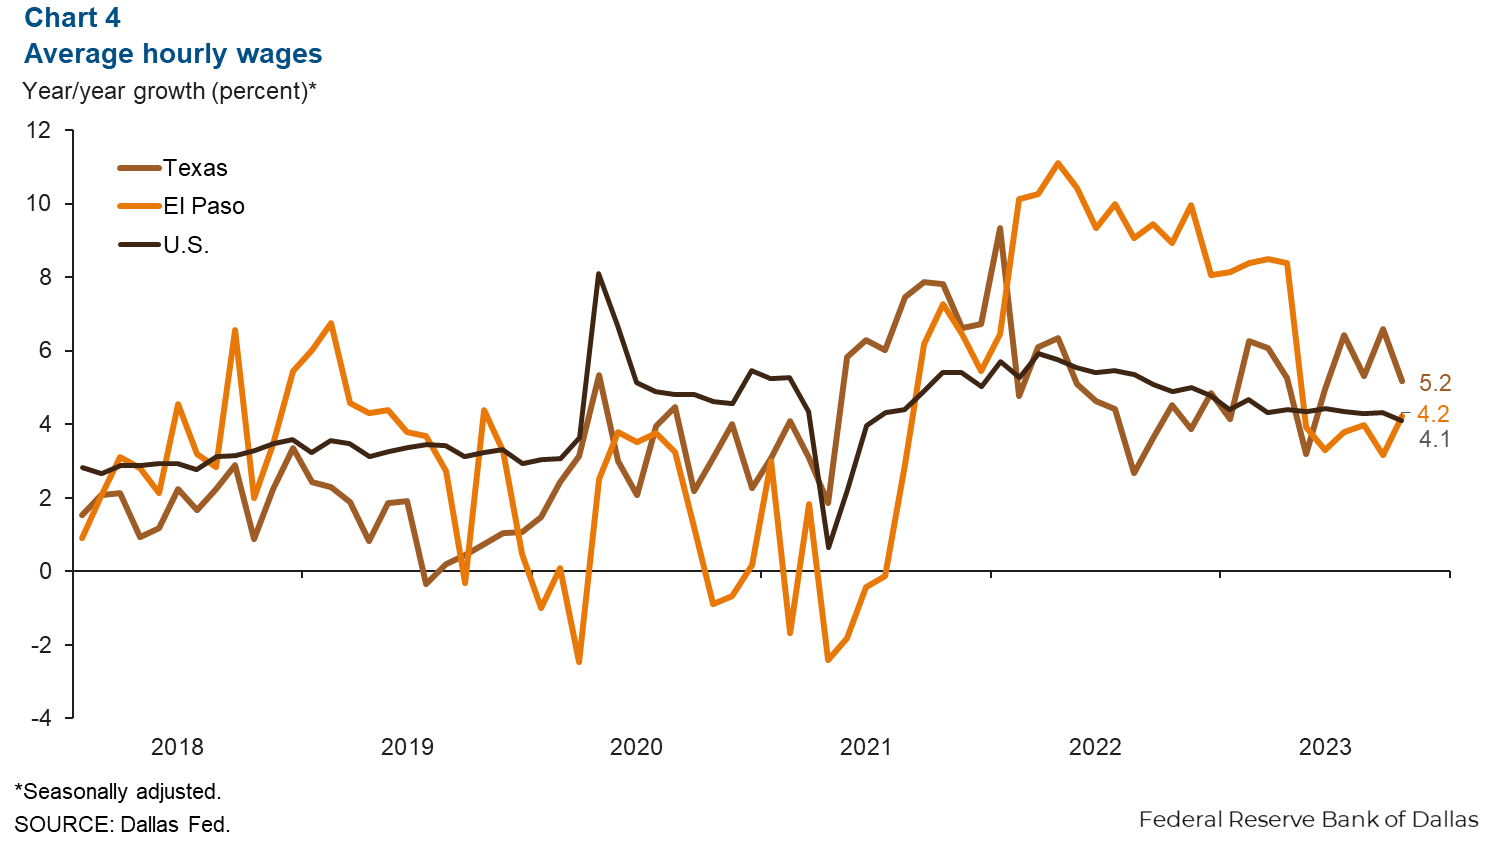
Wage growth stabilizes
El Paso’s average hourly wages were $23.54 in October, a 4.2 percent increase from October 2022 (Chart 4). Year-over-year wage growth remained above 8 percent from February 2022 to April 2023, and it has cooled considerably since then. Meanwhile, October average hourly wages were $32.07 in Texas and $34.00 in the nation.
Industrial production and maquiladora-related activities
The monthly U.S. industrial production (IP) index fell 0.6 percent in October and was down 0.7 percent from the previous year (Chart 5). The Institute for Supply Management index decreased 2.3 points in October as well, down to 46.7. Meanwhile, Mexico’s IP index was up 0.2 percent in September and grew 4.5 percent from September 2022.
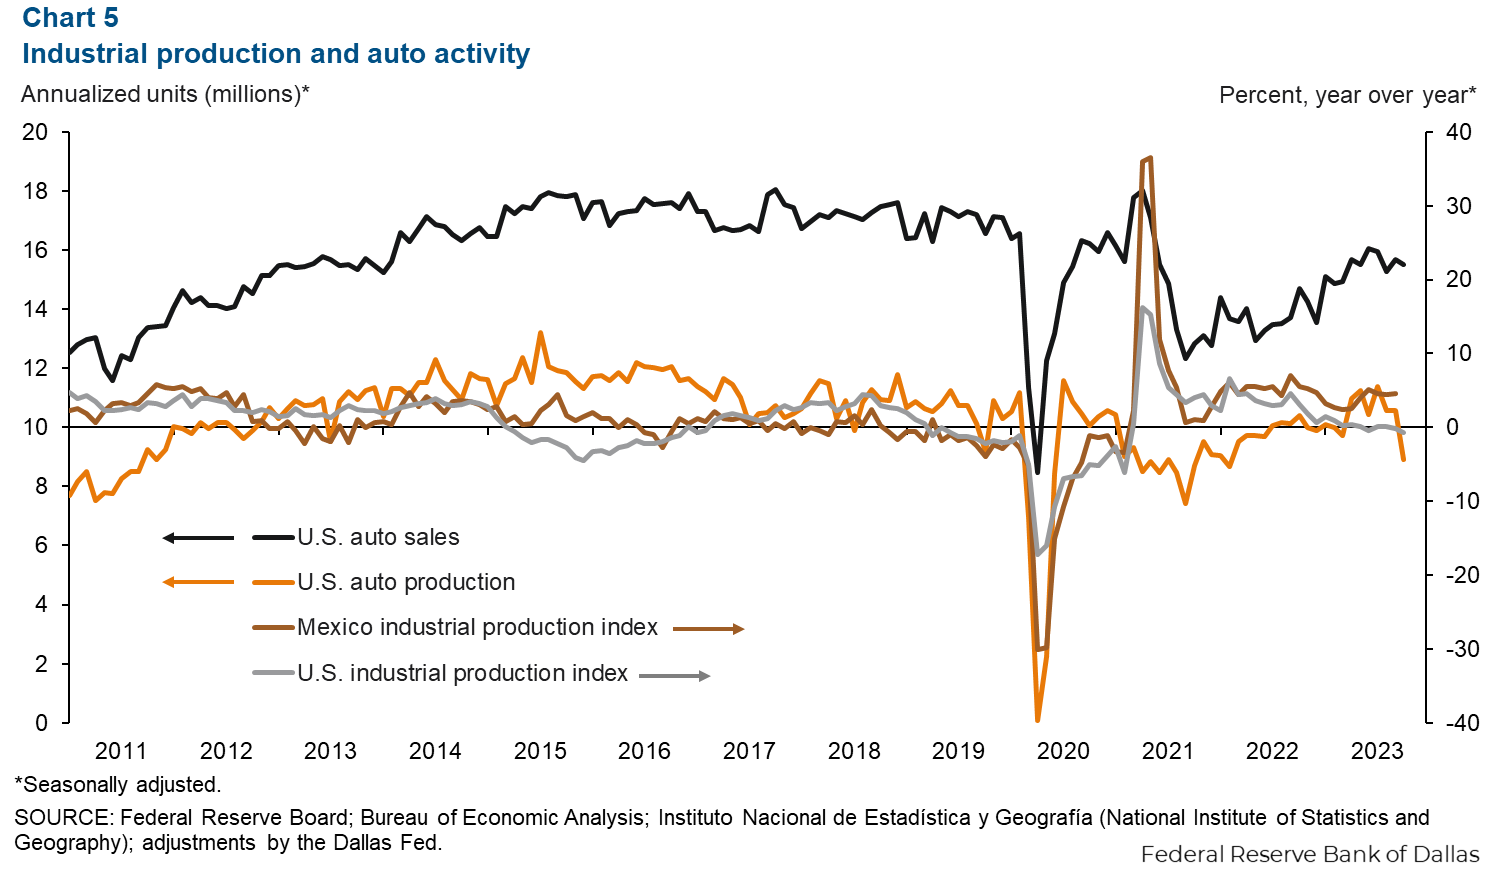
U.S. monthly auto production declined by an annualized 1.7 million units in October while sales fell by an annualized 185,000 units. Production was down 14.2 percent from October 2022, but sales were up 5.6 percent. Industrial and auto activity are closely linked to the El Paso area economy because of cross-border manufacturing relationships. Roughly half of the maquiladoras in Juárez, Mexico, are auto related.
NOTE: Data may not match previously published numbers due to revisions. The El Paso metropolitan statistical area includes El Paso and Hudspeth counties.
About El Paso Economic Indicators
Questions or suggestions can be addressed to Aparna Jayashankar at Aparna.Jayashankar@dal.frb.org. El Paso Economic Indicators is published every month after state and metro employment data are released.