El Paso Economic Indicators

| El Paso economy dashboard (November 2024) | |||
| Job growth (annualized) Aug.–Nov. '23 |
Unemployment rate |
Avg. hourly earnings |
Avg. hourly earnings growth y/y |
| 1.7% | 4.3% | $23.34 | 2.4% |
El Paso job growth slowed in November, wages declined, and the unemployment rate fell. In addition, new single-family home permits declined.
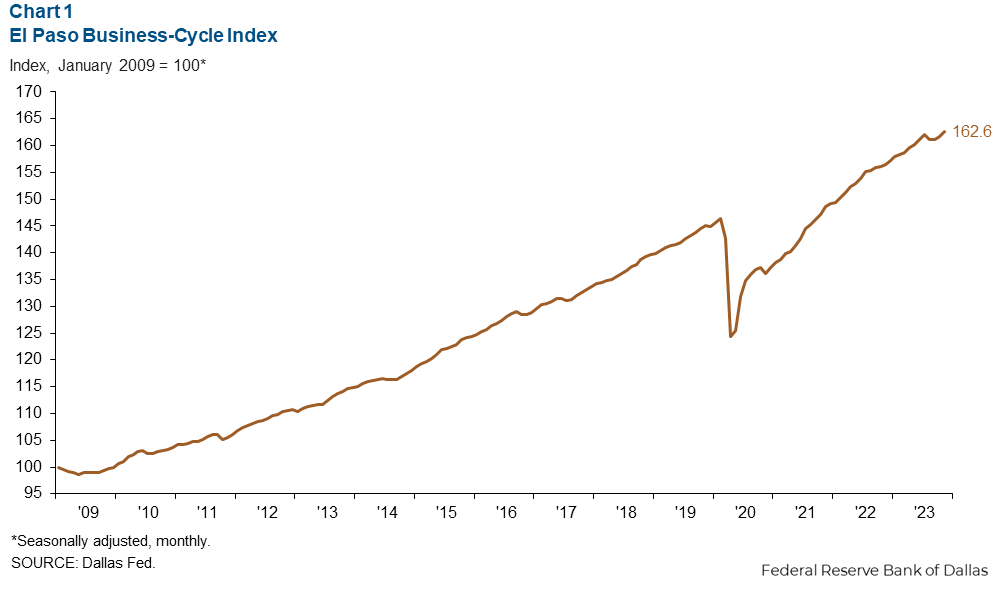
Business-cycle index
The El Paso Business-Cycle Index edged up 0.9 points from October to November (Chart 1). The index was up 3.9 percent from November 2022.
Labor market
Job growth slows
El Paso employment grew 1.7 percent (1,417 jobs) from August to November (Chart 2 ). Job losses were greatest in professional and business services (-220 jobs), financial activities (-129 jobs), and leisure and hospitality (-100 jobs). The largest gains were in construction and mining (314 jobs) and government (1,129 jobs).
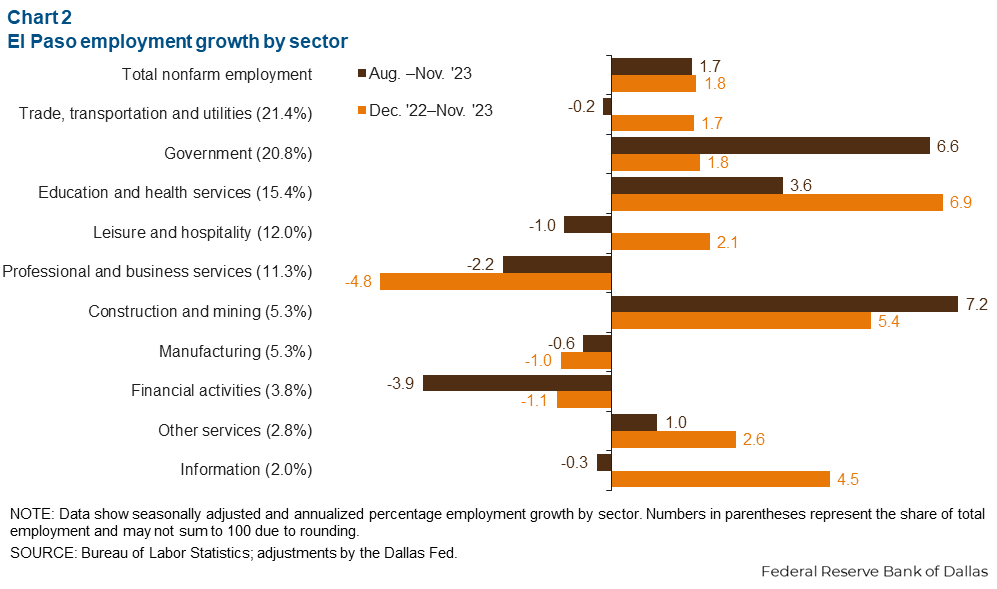
Total nonfarm employment has expanded 1.8 percent year to date (5,443 jobs). Education and health services added the most jobs on net (3,117 jobs), followed by trade, transportation and utilities (1,132 jobs), and government (1,175 jobs). Professional business services contracted the most (-1,776 jobs). Texas (3.3 percent) and the U.S. (1.8 percent) registered a higher year-to-date growth rate.
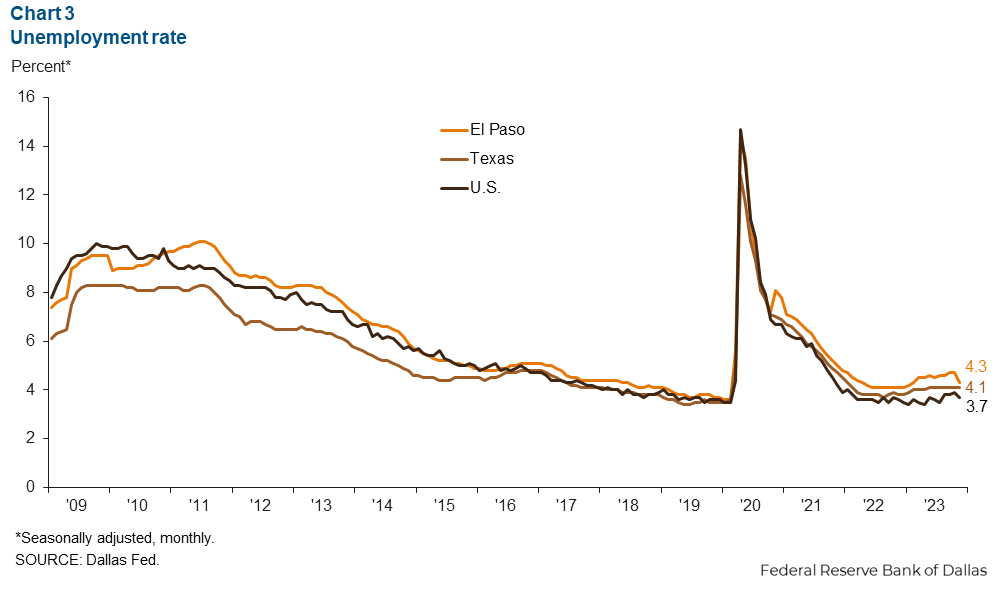
Unemployment rate declines
El Paso’s unemployment rate fell to 4.3 percent in November (Chart 3). This was higher than the state’s rate of 4.1 percent and the nation’s rate of 3.7 percent.
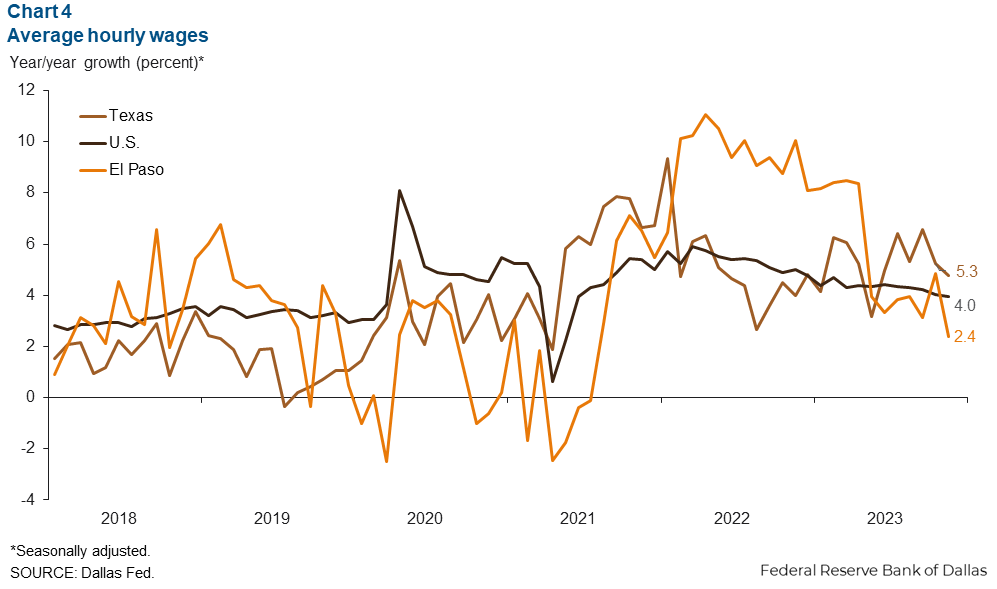
Wage growth declines
El Paso’s average hourly wages were $23.34 in November, a 2.4 percent increase from November 2022 (Chart 4). While year-over-year growth on average was above 6.0 percent during the first half of the year, wage growth has slowed as the labor market has cooled locally. Meanwhile, November’s average hourly wages were higher in Texas and the nation at $31.89 and $34.10, respectively.
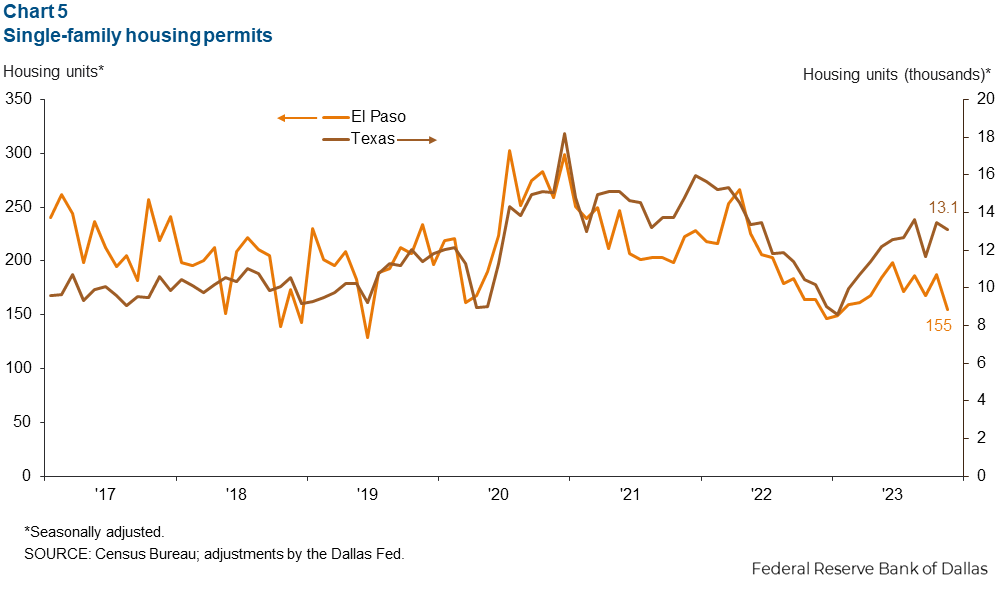
Housing
El Paso’s single-family home permits dropped 17.4 percent in November, returning to prepandemic levels last seen at the beginning of 2023 (Chart 5). However, Texas permits largely stabilized, declining by 2.8 percent in November.
NOTE: Data may not match previously published numbers due to revisions. The El Paso metropolitan statistical area includes El Paso and Hudspeth counties.
About El Paso Economic Indicators
Questions or suggestions can be addressed to Vee Kalkunte at Prithvi.Kalkunte@dal.frb.org. El Paso Economic Indicators is published every month after state and metro employment data are released.