El Paso Economic Indicators

| El Paso economy dashboard (February 2023) | |||
| Job growth (annualized) Dec. '23–Feb. '24 |
Unemployment rate |
Avg. hourly earnings |
Avg. hourly earnings growth y/y |
| 0.3% | 4.6% | $23.33 | 2.0% |
El Paso job growth saw little change in February, and the unemployment rate remained the same. In addition, imports and exports picked up through the El Paso port, U.S. industrial production grew, and both auto production and sales increased.
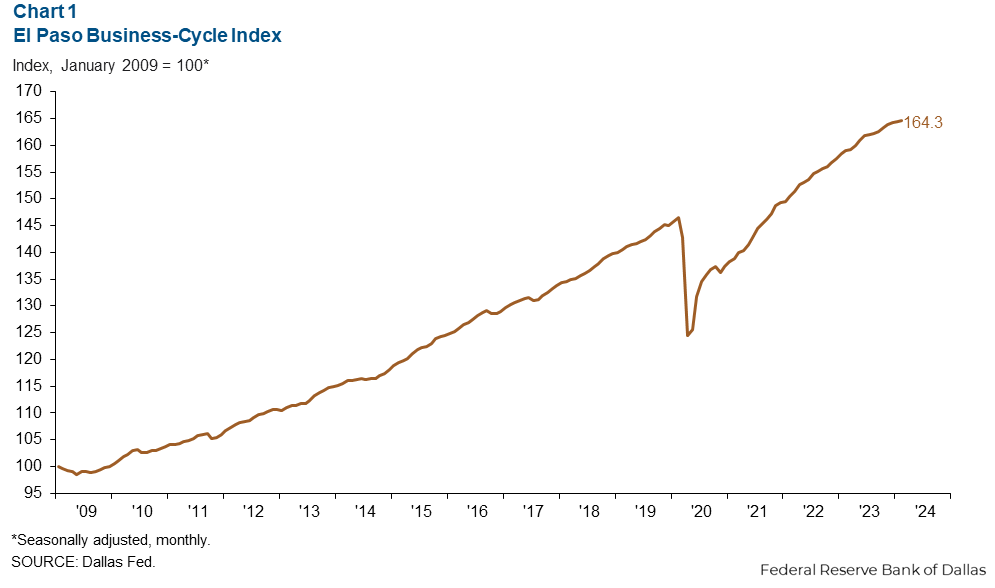
Business-cycle index
The El Paso Business-Cycle Index edged up 0.4 points from January to February (Chart 1). The index was up 3.6 percent from February 2023.
Labor market
Job growth slows
El Paso employment grew slightly, up 0.3 percent (246 jobs) from November to February (Chart 2). Job losses were greatest in leisure and hospitality (-332 jobs) and construction and mining (-134 jobs). The largest gains were in government (299 jobs) and trade, transportation and utilities (271 jobs).
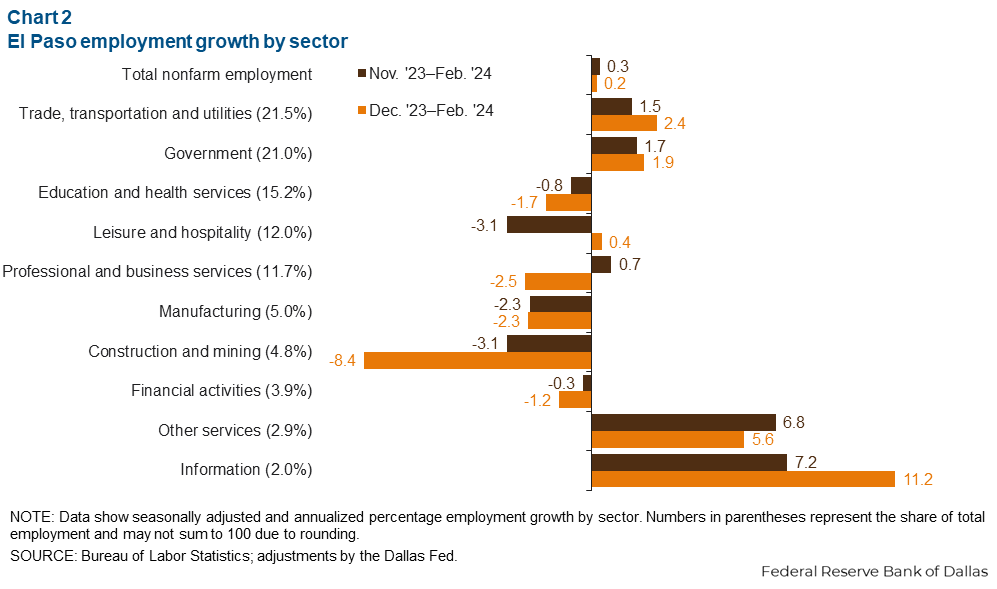
So far in 2024, total nonfarm employment expanded 0.2 percent (105 jobs). Trade, transportation and utilities added the most jobs on net (294 jobs), followed by government (233 jobs). Construction and mining contracted the most (-247 jobs). El Paso’s job growth in 2024 is below the state’s 4.3 percent and the nation’s 2.1 percent.
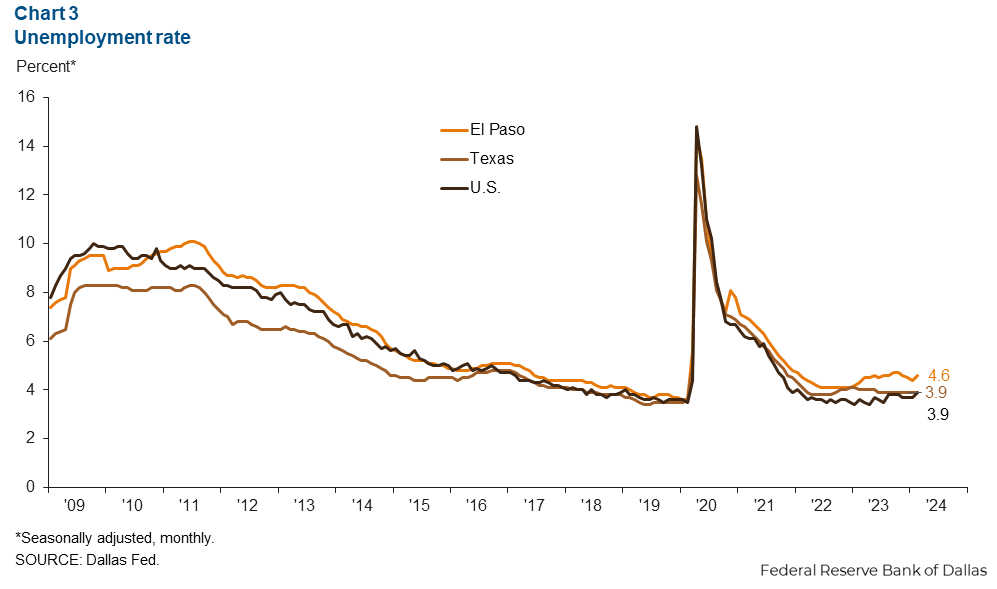
Unemployment rate holds steady
El Paso’s unemployment rate remained stable at 4.6 percent in February (Chart 3). This was higher than the rates for both the state and the nation, both at 3.9 percent.
Trade volume
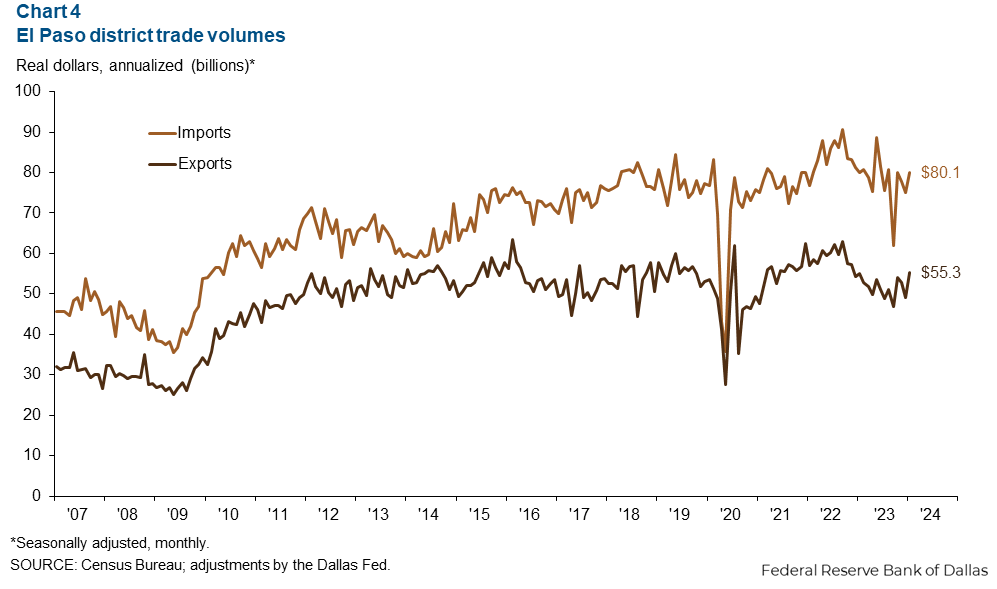
In February, El Paso’s trade volume totaled $135.4 billion annualized, up 0.3 percent from 2023 (Chart 4). Exports grew 0.4 percent from February 2023, while imports increased 0.2 percent. Trade primarily flowed through the ports of Ysleta (61 percent), Santa Teresa (20 percent), and El Paso (19 percent). Both imports and exports have surpassed prepandemic levels.
Industrial production and maquiladora-related activities
The monthly U.S. industrial production (IP) index grew 0.1 percent in February and was down 0.2 percent from the previous year (Chart 5). The Institute for Supply Management index decreased 1.3 percent in February, down to 47.8. Meanwhile, Mexico’s IP index was up 0.4 percent in January and grew 1.9 percent from January 2023.
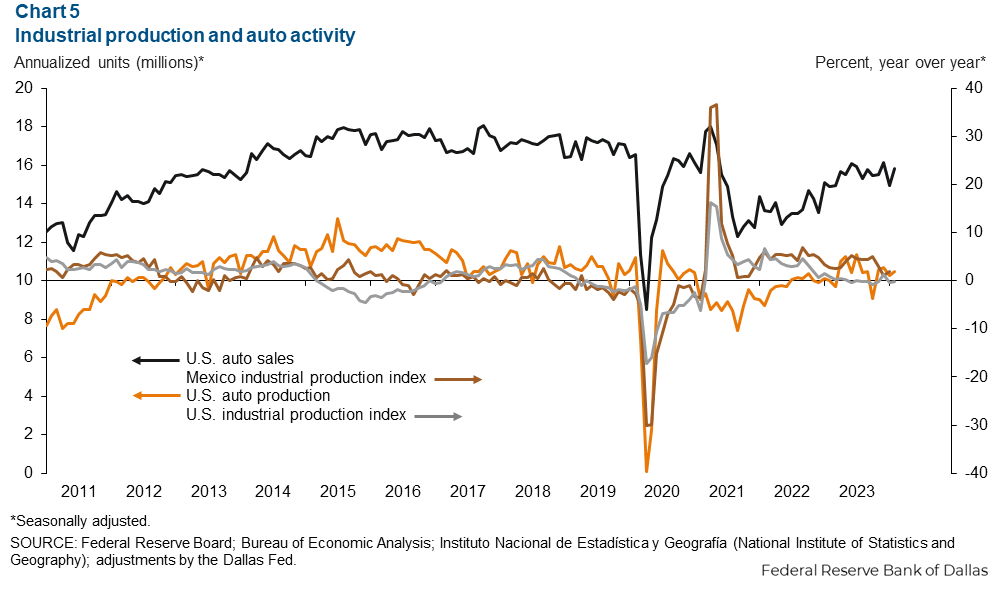
U.S. monthly auto production increased by an annualized 192,800 units in February while sales grew by an annualized 890,000 units. Production was up 4.6 percent from February 2023, and sales were up 6.3 percent. Industrial and auto activity are closely linked to the El Paso area economy because of cross-border manufacturing relationships. Roughly half of the maquiladoras in Juárez, Mexico, are auto related.
NOTE: Data may not match previously published numbers due to revisions. The El Paso metropolitan statistical area includes El Paso and Hudspeth counties.
About El Paso Economic Indicators
Questions or suggestions can be addressed to Isabel Dhillon at isabel.dhillon@dal.frb.org. El Paso Economic Indicators is published every month after state and metro employment data are released.