El Paso Economic Indicators

| El Paso economy dashboard (June 2026) | |||
| Job growth (annualized) Mar.–Jun. '26 |
Unemployment rate |
Avg. hourly earnings |
Avg. hourly earnings growth y/y |
| 2.1% | 4.5% | $25.07 | 2.5% |
The El Paso economy continued to expand in the second quarter. Employment increased in the three months ending in June, while the unemployment rate rose. Retail sales tax collections decreased, and total trade volumes continued to grow.
Labor market
Employment increases
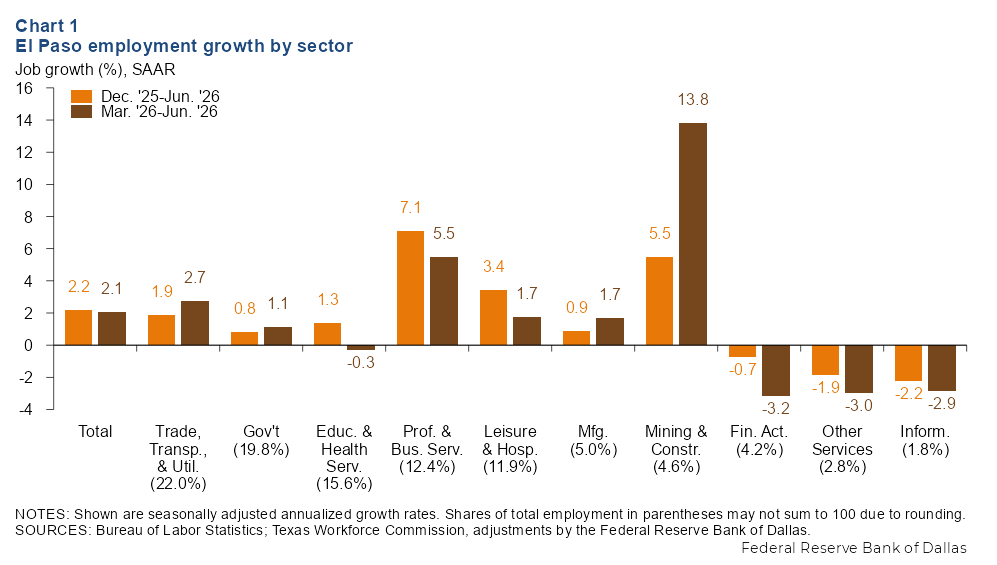
Payroll employment in El Paso grew an annualized 2.1 percent from March to June and was up an annualized 2.2 percent in the first half of the year (Chart 1). The sectors with the fastest payroll gains in the second quarter were mining and construction (13.8 percent), professional and business services (5.5 percent), and trade, transportation and utilities (2.7 percent). The sectors with the largest declines were financial activities (3.2 percent), other services (3.0 percent) and information (2.9 percent).
Unemployment ticks up
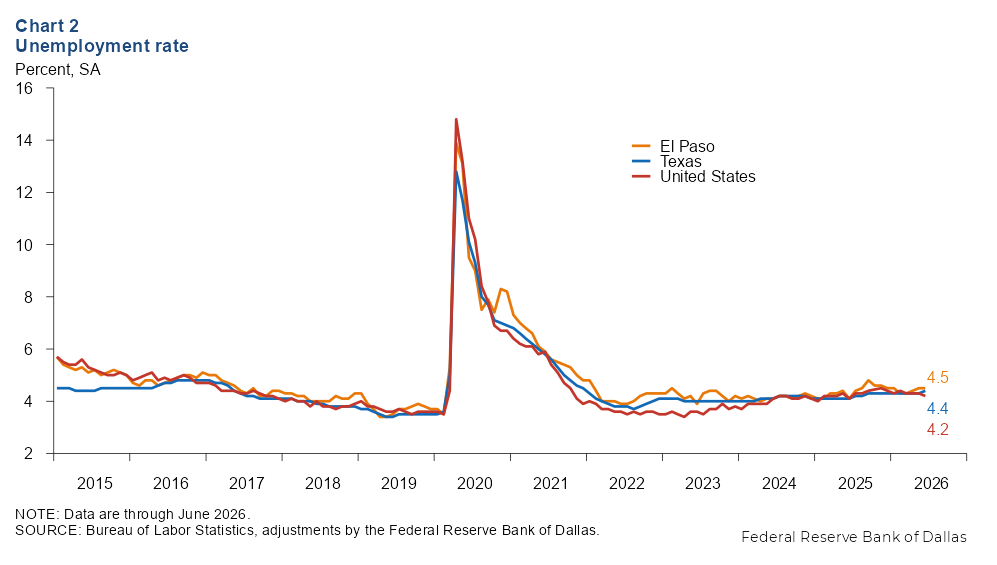
The unemployment rate in El Paso rose from 4.3 percent in March to 4.5 percent in June (Chart 2). The jobless rate in June was lower in Texas (4.4 percent) and the United States (4.2 percent).
Consumer spending
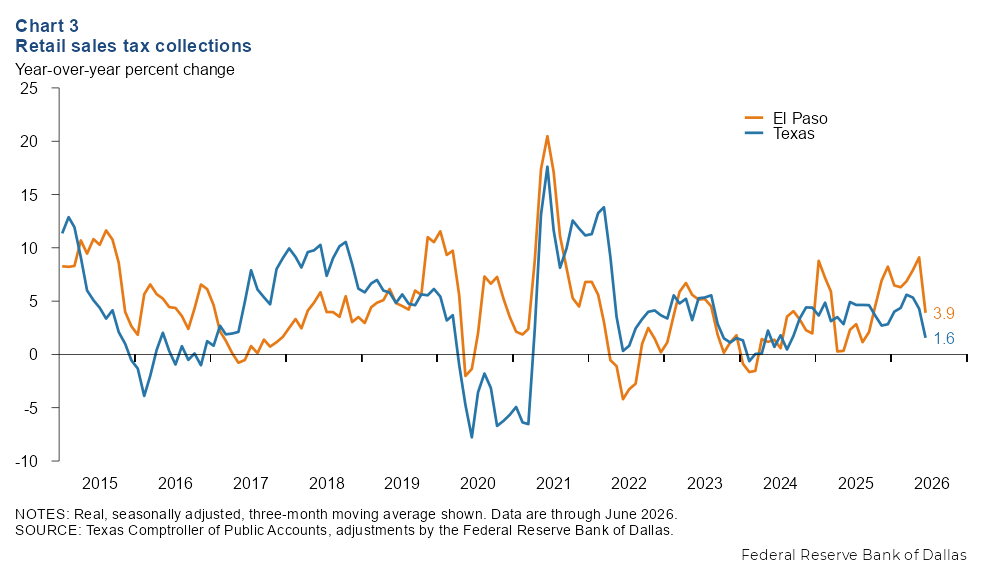
Retail sales tax collections, a proxy for consumption, dipped in El Paso in June. The three-month moving average of El Paso’s sales tax collections fell 3.0 percent to $20.1 million in June. State sales tax collections fell 1.0 percent over the same period. Year-over-year smoothed sales tax collections were up 3.9 percent in El Paso and 1.6 percent in Texas (Chart 3).
Trade
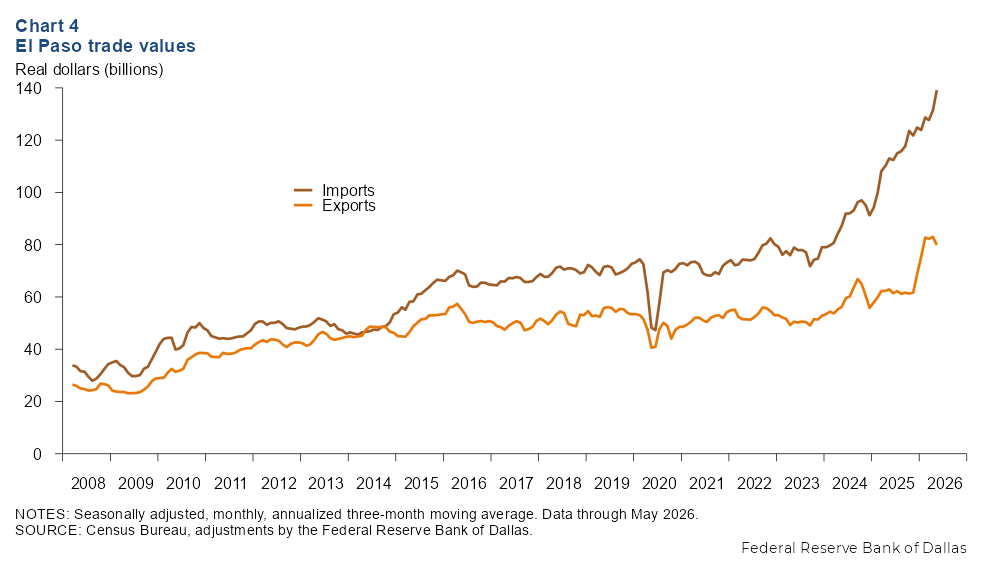
El Paso's economy is highly dependent on international trade. The three-month moving average of imports through the El Paso trade district grew from an annualized $131.3 billion in April to an annualized $139.1 billion in May (Chart 4). Smoothed exports declined from an annualized $83.0 billion in April to an annualized $79.8 billion in May. Total trade volumes rose in May and were 21.9 percent higher than year-ago levels. The surge in trade through the El Paso district is being driven by a shift toward higher-value electronics manufacturing across the border in Ciudad Juarez.
Notes
Data may not match previously published numbers due to revisions. The El Paso metropolitan statistical area includes El Paso and Hudspeth counties.
NOTE: Data may not match previously published numbers due to revisions.
About El Paso Economic Indicators
Questions or suggestions can be addressed to Isabel Brizuela. El Paso Economic Indicators is published quarterly.