Fort Worth Economic Indicators
| Fort Worth economy dashboard (July 2026) | |||
Job growth (annualized)
April–July '26 |
Unemployment rate |
Avg. hourly earnings (smoothed)* |
Avg. hourly earnings growth y/y (smoothed)* |
1.3% |
4.3% | $37.65 | 3.6% |
| *Three-month moving average | |||
The Fort Worth economy continued to expand, with employment up modestly in the three months ending in July. The unemployment rate was flat in July, while wages increased. Office and industrial demand were positive in second quarter 2026.
Labor market
Employment dips in July
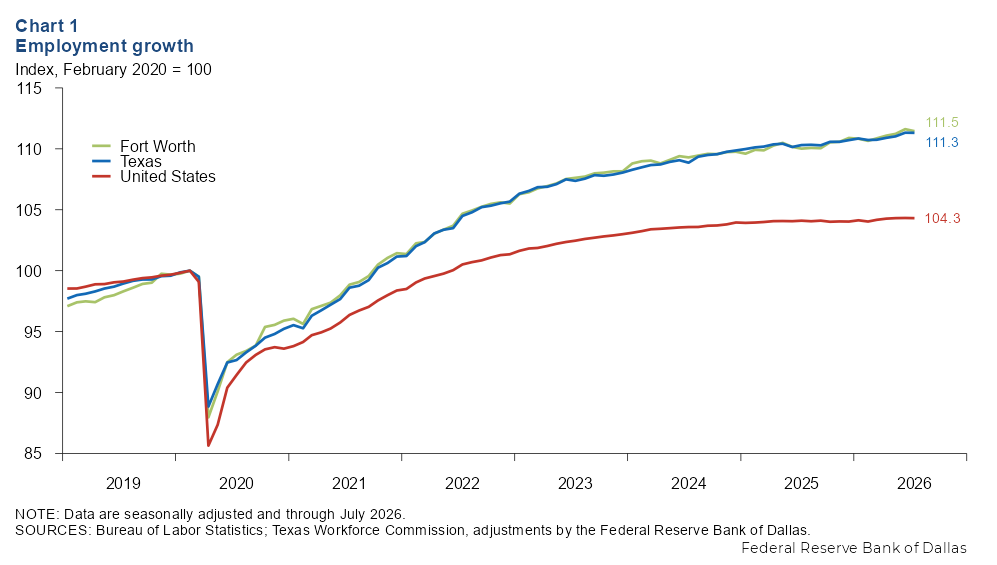
Fort Worth employment fell an annualized 1.8 percent in July after expanding 4.3 percent in June. Texas employment changed little in July while employment nationally dipped 0.2 percent. Since February 2020, employment in Fort Worth has grown 11.5 percent, in line with the state’s 11.3 percent increase and ahead of the nation’s 4.3 percent rise (Chart 1).
Employment expansion mixed
Fort Worth payrolls grew an annualized 1.3 percent from April to July and were up 0.9 percent year to date (Chart 2). The sectors with the fastest payroll growth from April to July were leisure and hospitality (9.2 percent) and professional and business services (6.8 percent). The sectors with the largest payroll declines were information (6.6 percent), manufacturing (2.8 percent) and government (2.7 percent).

Unemployment rate flat
The Fort Worth unemployment rate was unchanged at 4.3 percent in July (Chart 3). The jobless rate is higher in Texas (4.5 percent) but lower for the U.S. (4.1 percent). The size of the labor force in Fort Worth has increased slightly, rising an annualized 1.6 percent in July and up 0.6 percent since July 2025.

Wages increase
The three-month moving average of nominal hourly wages in Fort Worth rose to $37.65 in July. Year over year, Fort Worth wages grew 3.6 percent in July, in line with the statewide increase of 3.7 percent (Chart 4). U.S. wages were up 3.3 percent in July from year-ago levels. Wages in Fort Worth are higher than the state ($35.69) and the national average ($37.57).

Commercial real estate
Office absorption picks up
Positive momentum in office leasing continued in the second quarter of 2026. Net absorption was 191,000 square feet, higher than the previous quarter, according to data from CBRE Econometric Advisors (Chart 5). The vacancy rate declined to 19.0 percent. Net asking rents in the metro dipped from $22.99 to $22.93 per square foot per year.

Industrial leasing strong
Industrial leasing remained solid in the second quarter. Net absorption was 2.2 million square feet, slower than the previous quarter, according to data from CBRE Econometric Advisors (Chart 6). The vacancy rate ticked up to 10.3 percent. Net asking rents in the metro declined from $8.59 to $8.03 per square foot per year.

NOTE: Data may not match previously published numbers due to revisions.
About Fort Worth Economic Indicators
Questions or suggestions can be addressed to Jackie Balanovsky. Fort Worth Economic Indicators publishes bimonthly after state and metro employment data are released.