Houston Economic Indicators

Leading economic indicators, the business-cycle index, employment outcomes and housing markets are, on balance, pointing to tepid or average regional growth in the second half of 2019. Service sector job growth in many industries has slowed—notably in health and wholesale trade. In contrast, transportation and staffing services jobs have surged, and existing-home sales and permits for new housing have risen.
Business-Cycle and Leading Indexes
The Houston Business-Cycle index slowed to a 3.9 growth rate over the three months ending September 2019, just above the historical average of 3.5 percent (Chart 1). This implies that economic activity remains broadly healthy and is growing in line with historical trends.
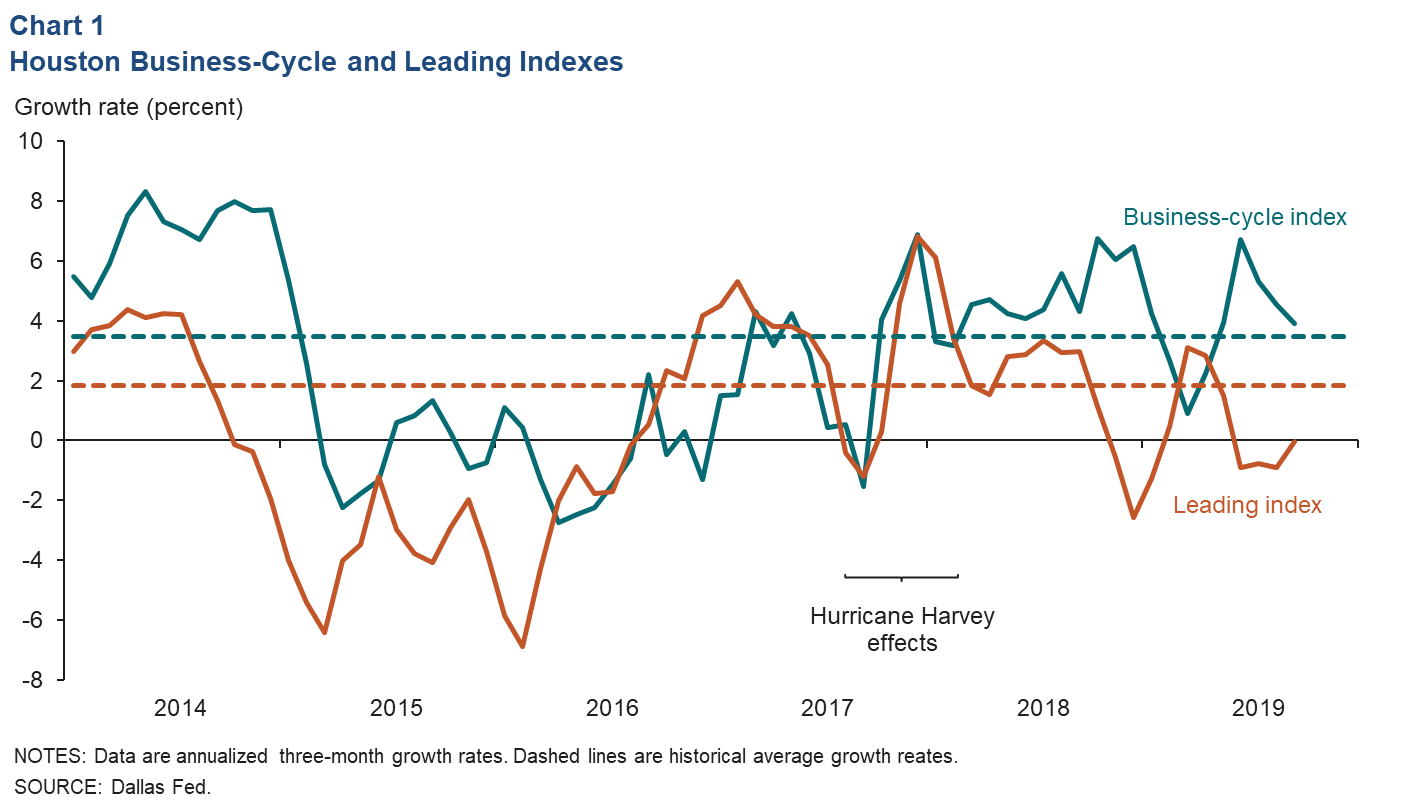
However, an index of 11 leading indicators for Houston job growth declined from April to August 2019 and was flat in September. The recent weakness in the index is consistent with a slowdown in job growth over the next several months.
Employment
Job Growth Near Historical Average
Job growth in Houston came in near its historical average rate of 2.1 percent over the three months ending in September 2019 (Chart 2). Professional and business services was the fastest-growing industry group, and it added substantially more jobs (10,800) than any other sector. A distant second was construction (3,000), followed by manufacturing (2,600). The only industry group to meaningfully shed jobs over that time frame was private education and health services (-2,200), though government also shrank.
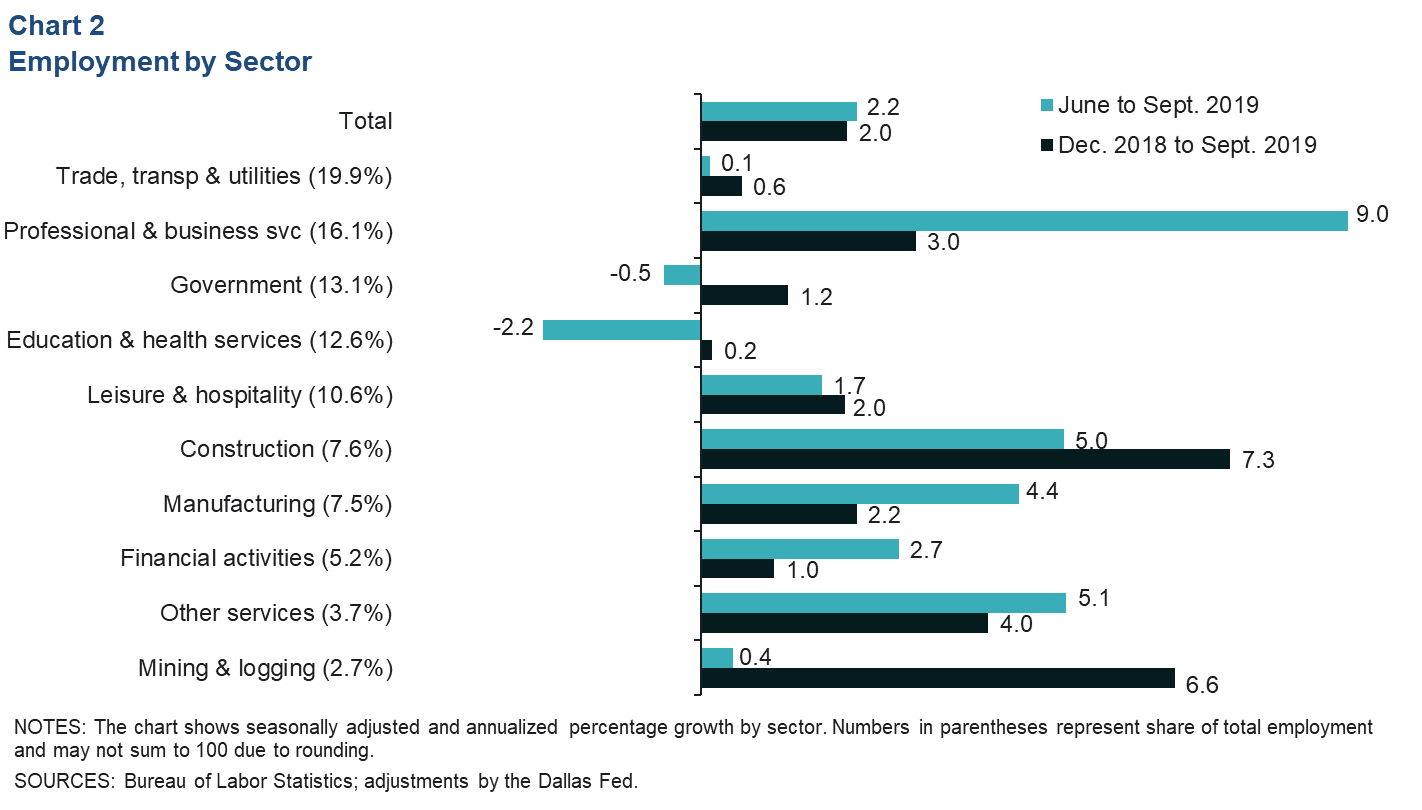
Looking at growth over the year so far, Houston has added jobs at an annual 2.0 percent rate (47,300).
The Houston unemployment rate fell slightly to 3.6 percent in September. Unemployment has remained low the past six months as the labor force has grown at a 2 percent annual rate—in line with the average rate over the past 19 years. For reference, the unemployment rate was 3.4 percent in Texas and 3.5 percent in the U.S.
Professional, Scientific and Technical Jobs Lead Services
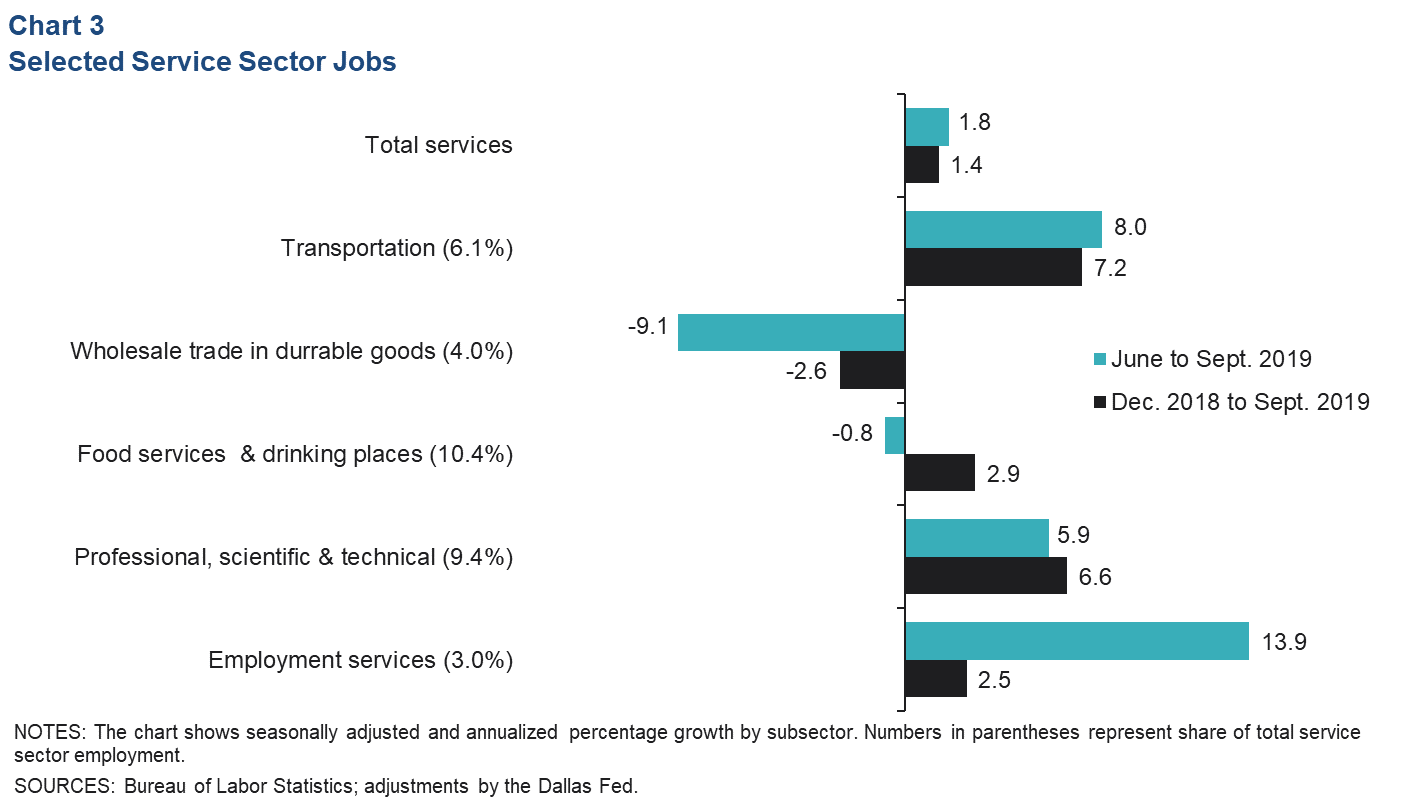
Total service sector job growth was 1.8 percent over the three months ending in September (11,500) (Chart 3). A large share of that job growth came from professional, scientific and technical jobs (3,500) and transportation (3,000). Employment services (2,500)—a subsector of professional and business services—was the fastest-growing industry. Wholesale trade in durable goods (-2,600) lost the most jobs among the service sectors.
Health Industry Jobs Slow
Job growth in health care and social assistance slowed to 0.8 percent from third quarter 2018 to third quarter 2019 (2,800 jobs)—its weakest rate since first quarter 1999 (Chart 4). The industry has been broadly slowing since the 2015–16 oil bust and the resulting local recession. Health care dipped sharply in 2017, and several hospital systems cited health policy uncertainty and a shift in the source of health payments to less-lucrative insurance plans as contributing factors to layoffs at that time.
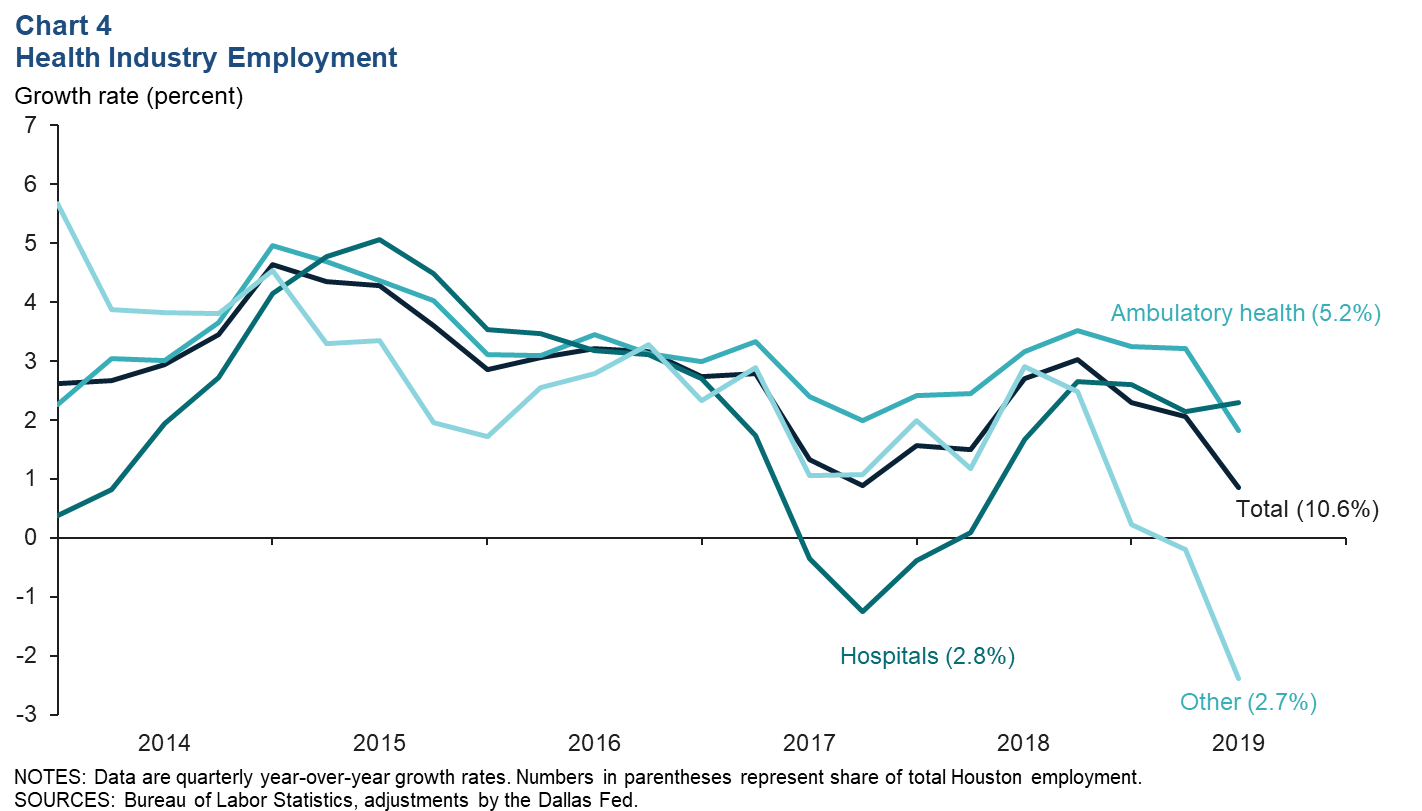
The largest health employment sector is ambulatory health (such as physician and dentist offices), and it slowed to a 1.8 percent year-over-year growth rate in third quarter 2019 (2,900 jobs). Hospital job growth has been hovering near 2.3 percent for the past year (1,800). The “other” health category (such as chiropractors and assisted living facilities) has shed jobs (-2,100).
Real Estate
Home Sales Rising
Seasonally adjusted existing-home sales improved in September, particularly for homes priced between $200,000 and $499,999 (Chart 5). Homes sales in that range were hampered by rising mortgage rates in 2018, but as rates have reversed course in 2019, sales have accelerated. Sales of homes priced below $200,000 have been trending down the past two years due to limited supplies and rising demand pushing lower-priced homes into the higher-priced categories.
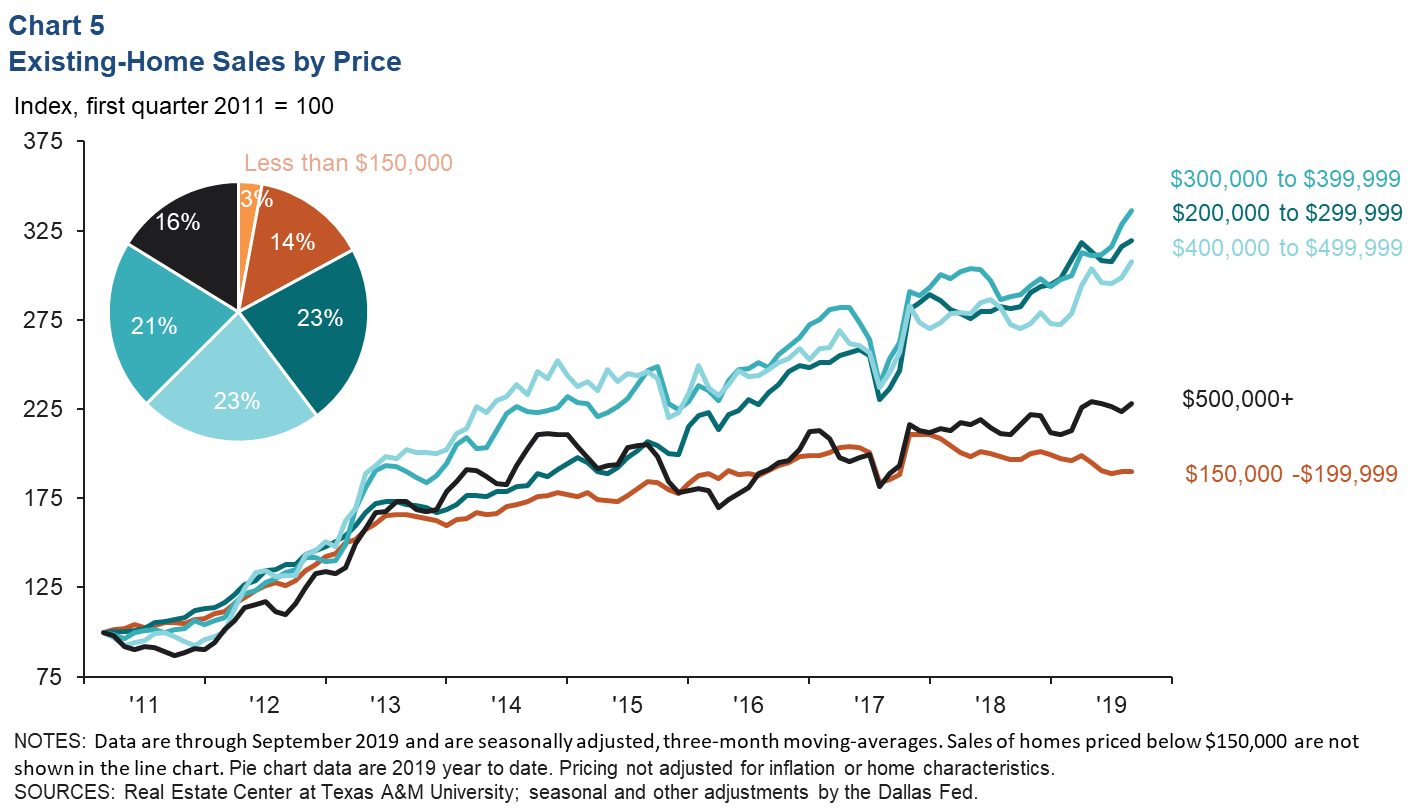
The main measure of housing supply is the months of housing inventory (number of listings divided by the number of homes sold). It has been holding near 3.9 months, with lower-priced markets having the tightest inventory at less than two months and the highest-priced home bracket having inventory above eight months.
Housing Permits Surge
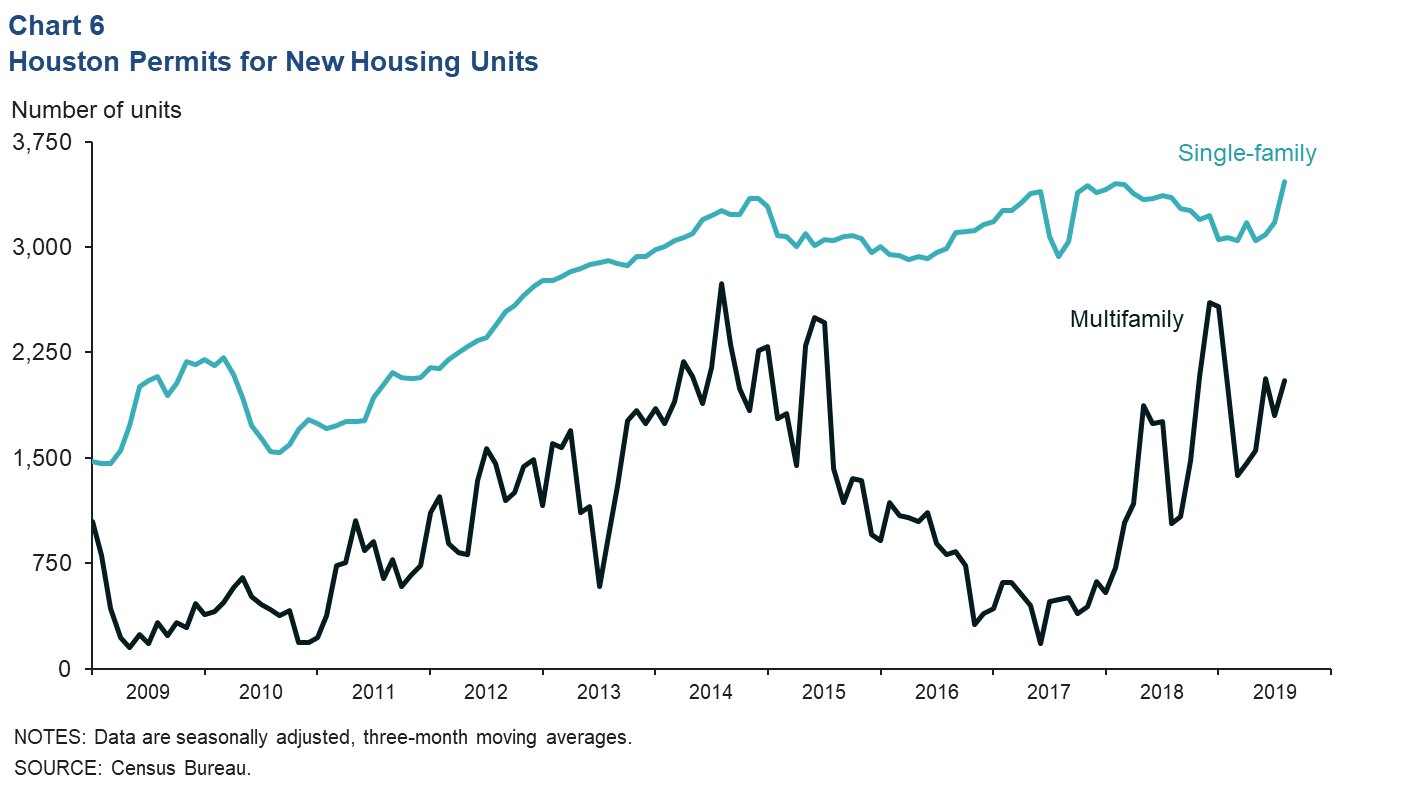
Housing permits have surged in recent months. Single-family units have averaged a record-setting 3,469 permits the past three months—the sharpest increase in the series since Hurricane Harvey artificially depressed activity in 2017 (Chart 6). Multifamily permits have been trending up since early 2018. Strong permit growth presages healthier residential construction activity in the coming year, supporting construction jobs.
NOTE: Data may not match previously published numbers due to revisions.
About Houston Economic Indicators
Questions can be addressed to Jesse Thompson at jesse.thompson@dal.frb.org. Houston Economic Indicators is posted on the second Monday after monthly Houston-area employment data are released.